On August 3, 2026, oil plunged as markets absorbed the weekend geopolitical reversal. Trump canceled planned large-scale Iran strikes, prioritized a two-stage peace process and demanded immediate full Hormuz passage. Futures quickly priced easing conflict and supply interruption: front-month WTI settled at $80.34 a barrel, down $4.33 or about 5.1% from July 31's $84.67; front Brent settled at $83.77, down about 4.6%, with intraday losses over 7%. Both reached multweek lows.
The rapid removal was of accumulated geopolitical premium, while physical balances had not materially improved. Hormuz merchant passages remained in single digits and war-risk premiums more than ten times prewar norms. Investors bet on an overstated premium fading, but extremely deep backwardation showed physical traders' caution over whether the supply gap was actually narrowing.
Nearly 5% daily decline takes both benchmarks to multweek lows
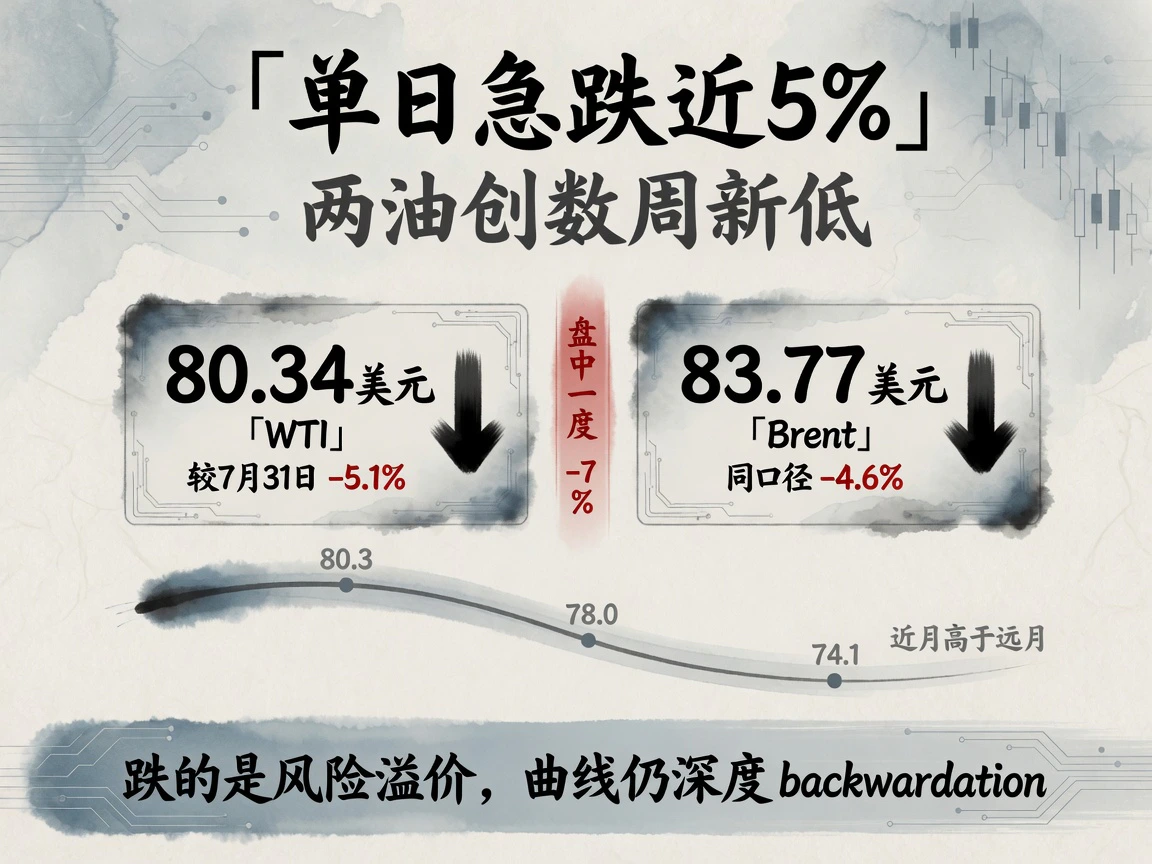
Official August 3 settlement comparisons showed September WTI $80.34, down $4.33 or about 5.1% from July 31's $84.67. Front Brent settled near $83.77; Reuters' 23:52 GMT quote was $83.85, down $4.08 or about 4.6%. September Brent ceased trading on July 31, making October the prompt contract from August 3; changes use a consistent same-contract comparison. Brent at one point fell over 7% toward $81.5 before some technical buying, still leaving a severe loss.
At the August 4 Beijing-time morning cutoff, about 08:43–08:48, live Asian quotes showed modest stabilization: WTI around $80.7, Brent around $84.3, while Trading Economics showed about $84.5, up roughly 0.9% intraday. These were live snapshots, not final settlements. Brief stabilization still fell well short of reversing the technical breakdown.
The curve remained exceptionally backwardated: WTI September $80.3, October $78.0, December $74.1; Brent October $83.5, November $80.9, December $79.0. Brent-WTI spreads narrowed broadly to $5–$6. Nearby premiums remained extreme: the WTI current-September versus following-September spread was quoted at about -$12 under the source convention. Macro investors traded ceasefire hopes while physical networks still saw rigid logistical disruption, with deferred surplus risk intact.
Strikes canceled, reopening hoped for; negotiations remain uncertain

Trump's August 3 cancellation was the immediate catalyst. He said Gulf allies and Iran requested a diplomatic window. The U.S. envisaged immediate unconditional full passage in stage one and nuclear negotiations in stage two, presenting this as a final ultimatum and opportunity.
Iran rejected rumors of direct U.S. contact, saying it was discussing only a temporary local Gulf corridor with Oman. Regional mediators also said no formal-talk timetable or venue was settled. Traders pragmatically discounted the halted near-term escalation while continuing to regard an implemented agreement and free navigation as unproven.
Repeated failed talks left a persistent shadow. Diplomacy can erase several dollars of premium in a day, but stalled mediation or an incident can restore that space just as quickly.
Single-digit passage and tenfold insurance premiums show no physical relief
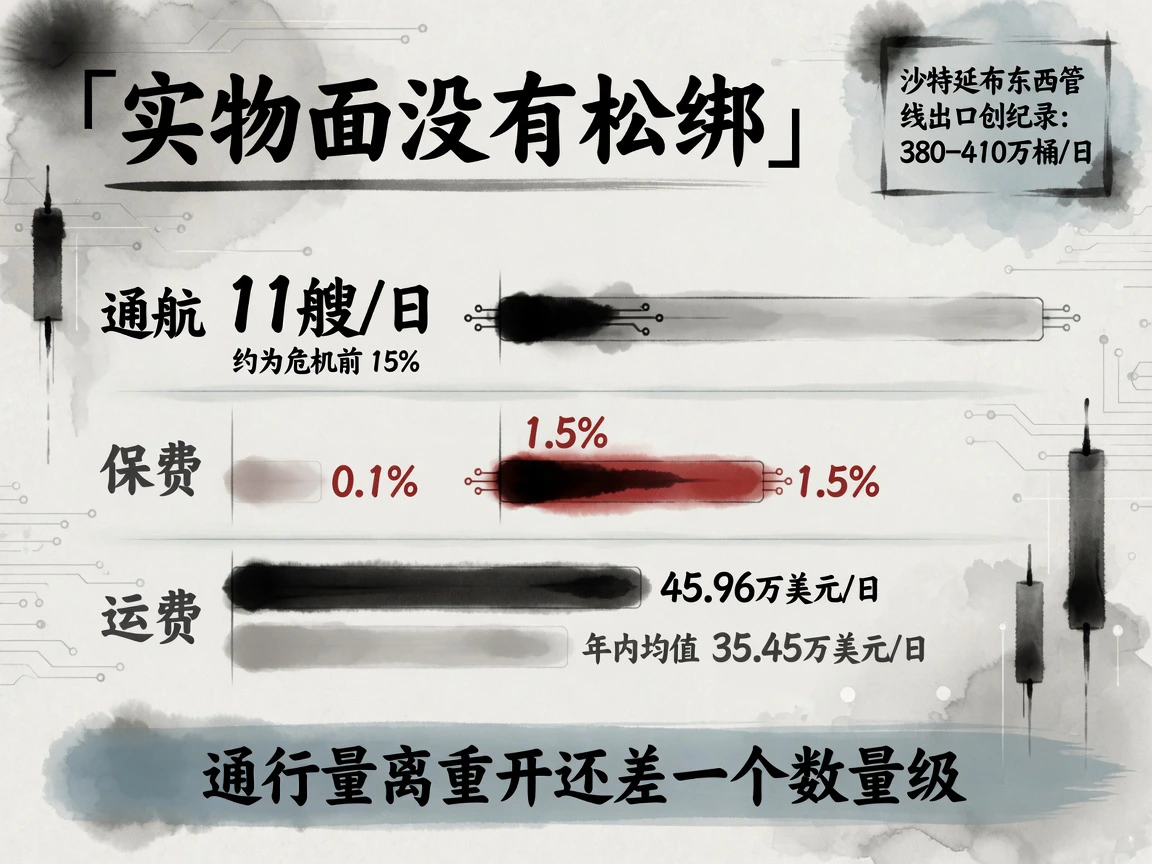
The futures fall could not conceal impaired logistics. Current passages were described as around 11 merchant vessels daily, roughly 15% of precrisis intensity. EIA's normal baseline is over a hundred large vessels a day carrying nearly one fifth of seaborne crude trade. The source also describes sparse single-digit passage as at least an order of magnitude below normalized operation.
War-risk rates remained around 1.5% of hull value per voyage versus about 0.1% before the crisis, still more than tenfold despite easing from late-July extremes of 3%–10%, according to The National, S&P Global and Lloyd's List. Middle East–Far East VLCC spot earnings on July 31 were about $459,600 daily versus a year-to-date norm around $354,500, per TradeWinds. High transport and insurance burdens discouraged mainstream owners from returning to the Gulf.
Bypasses approached physical limits. Aramco's east-to-west pipeline exports through Yanbu reached records, with some periods at 3.8 million–4.1 million barrels daily, according to Lloyd's List. August 3 tracking showed up to six Saudi tankers turning back outside Aden toward Suez for safety. That evening a merchant vessel was hit by an unidentified projectile about 20 nautical miles northeast of Al Khasab; crew were safe and UKMTO warned shipping. Blockades and threats did not vanish with political statements.
More production cannot be shipped; stocks approach the floor
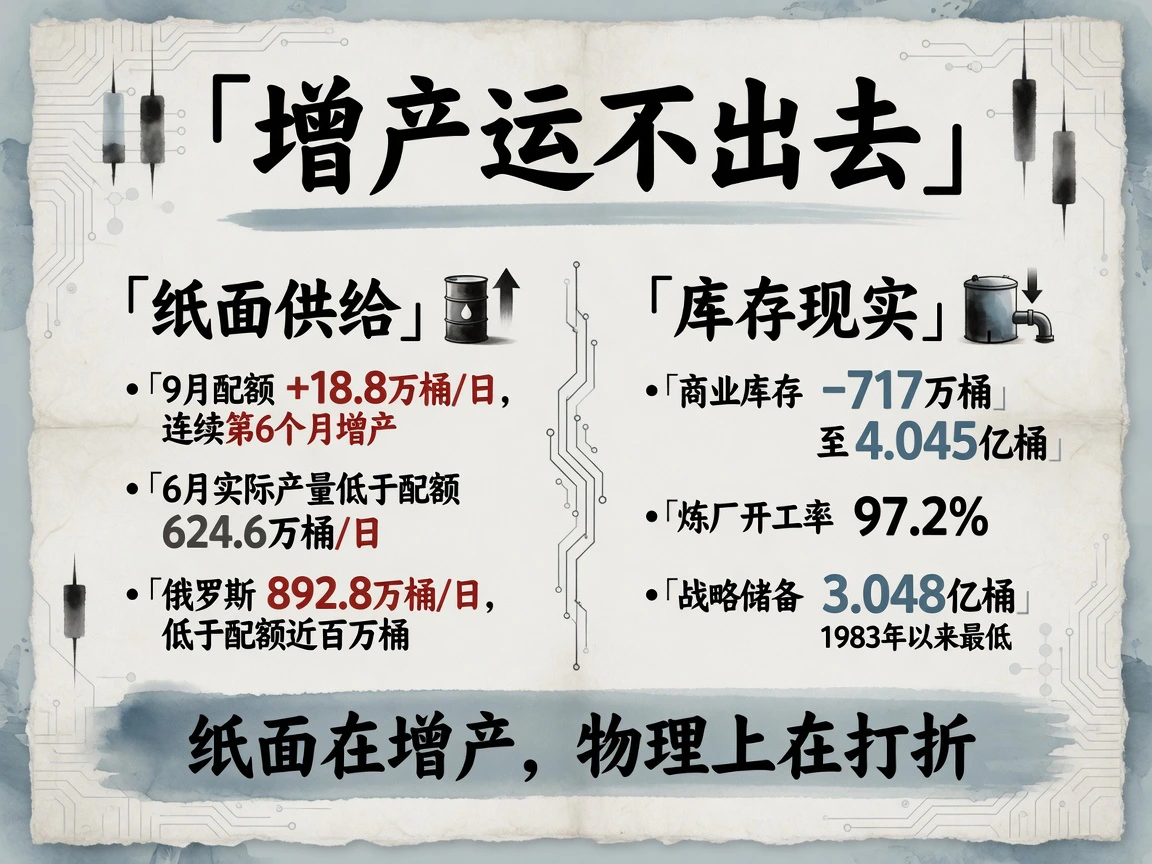
On August 2, seven core OPEC+ states—Saudi Arabia, Russia, Iraq, Kuwait, Kazakhstan, Algeria and Oman—decided on another 188,000 barrels/day quota increase in September. This sixth consecutive monthly increase gradually ends 2023's 1.65 million-barrel voluntary cuts. September 6's meeting would set October quotas.
Reuters characterized nominal increases as lacking practical meaning until Hormuz reopened: crude could not leave the Gulf effectively. Eight quota-bound core members produced only 20.276 million barrels/day in June, 6.246 million below quota. Russia's 8.928 million was nearly a million below its allocation. Transportation bottlenecks sharply discounted paper promises.
EIA's July 24 week, released July 29, showed commercial crude down 7.17 million barrels to 404.5 million, well beyond expectations and about 6%–7% below the five-year seasonal average. Cushing fell 771,000; utilization reached 97.2%; SPR fell to 304.8 million, lowest since 1983. The July 31 week, the first full week after renewed blockade, was next: API on August 4 evening, EIA August 5. Further low stocks and draws would imply the plunge removed financial premium while concealing continued physical scarcity.
Deep backwardation: Markets bet the premium was overstated
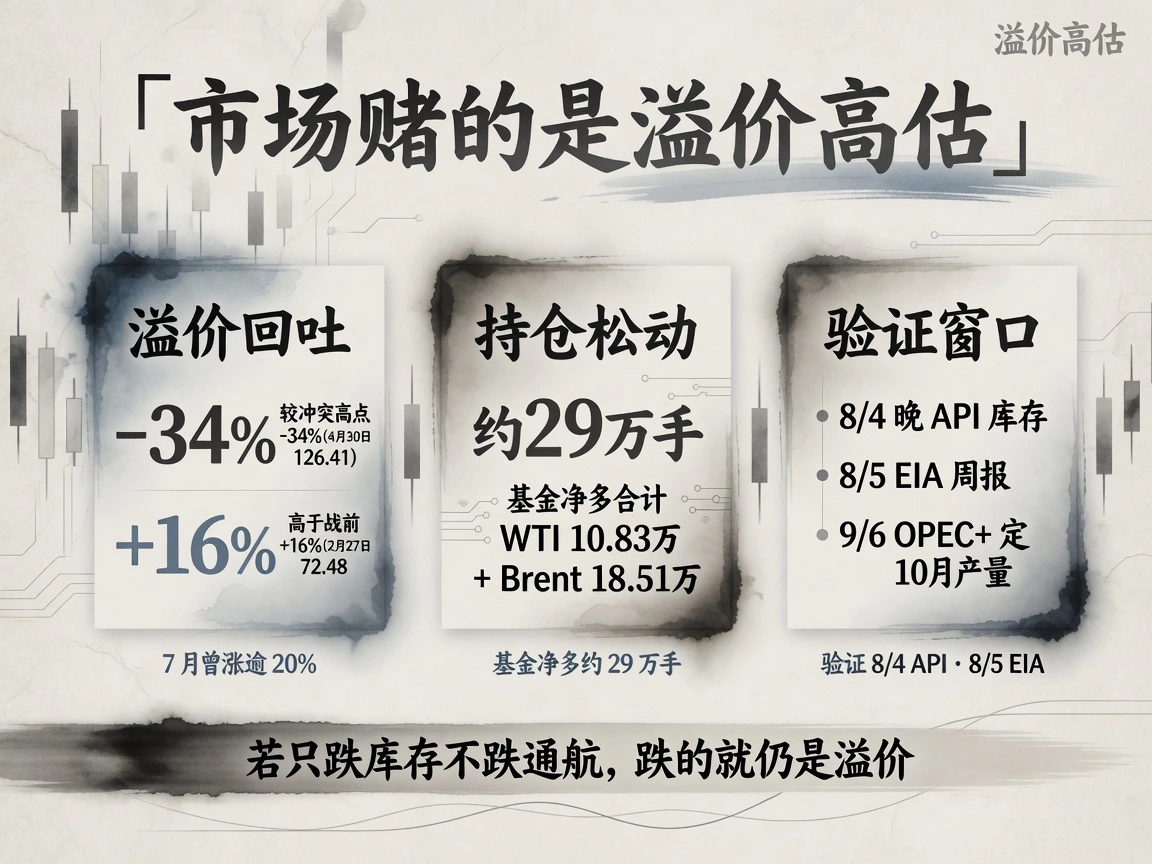
August 3 marked a tactical pricing shift from uncontrolled conflict toward a potential reconciliation discount. Reuters estimated Brent down about 34% from April 30's $126.41 conflict peak and only 16% above February 27's $72.48 precrisis close. Most of nearly six months' paper geopolitical premium had been squeezed out.
Institutional liquidation accelerated losses. CFTC and ICE reports through July 28 showed managed-money WTI net longs around 108,300 contracts, up 21,400 weekly, and Brent around 185,100, down 6,900, about 290,000 combined. Positions were not historically extreme, but speculation concentrated in prompt maturities could cascade through thin liquidity after adverse geopolitical news. July gains had exceeded 20% before an early-month daily drop over 5% erased ground, revealing fragile sentiment.
Cross-markets reflected the same logic. Lower oil eased stagflation fears; stocks rebounded, S&P 500 +1.5% and Dow at a record close. Treasury yields fell, with official Treasury figures at 4.70% for the 10-year, -5 bp, and 4.25% for the 2-year, -3 bp. The dollar consolidated around 99.8–100; spot gold held near the historically high $4,000 level. Joint cyclical and defensive recovery supported an easing energy-inflation alarm rather than imminent real recession.
The curve remains the physical test. Persistent backwardation means spot buyers still pay for scarce barrels, costly war-zone capacity and insurance, while deferred prices discount eventual normalization. Macro investors bet earlier premiums were excessive; actual goods flows had not eased because of White House remarks.
The next observation windows are dense and important:
- Whether API on August 4 evening and EIA on August 5 confirm continued exceptional commercial draws;
- Whether actual Hormuz daily passage and war-risk insurance rates improve materially under Iran-Oman discussions;
- Whether Trump's proposed August 3–4 U.S.-Iran talks gain concrete support;
- The September 6 OPEC+ guidance for October production.
Physical delivery ultimately decides commodities. The price decline reaches fundamentals only if navigation and insurance show sustained recovery. If inventories keep falling and ships remain obstructed, the valuation trough created by verbal hopes will eventually face renewed physical-market pressure.


