Daily Market Review · October 30, 2026
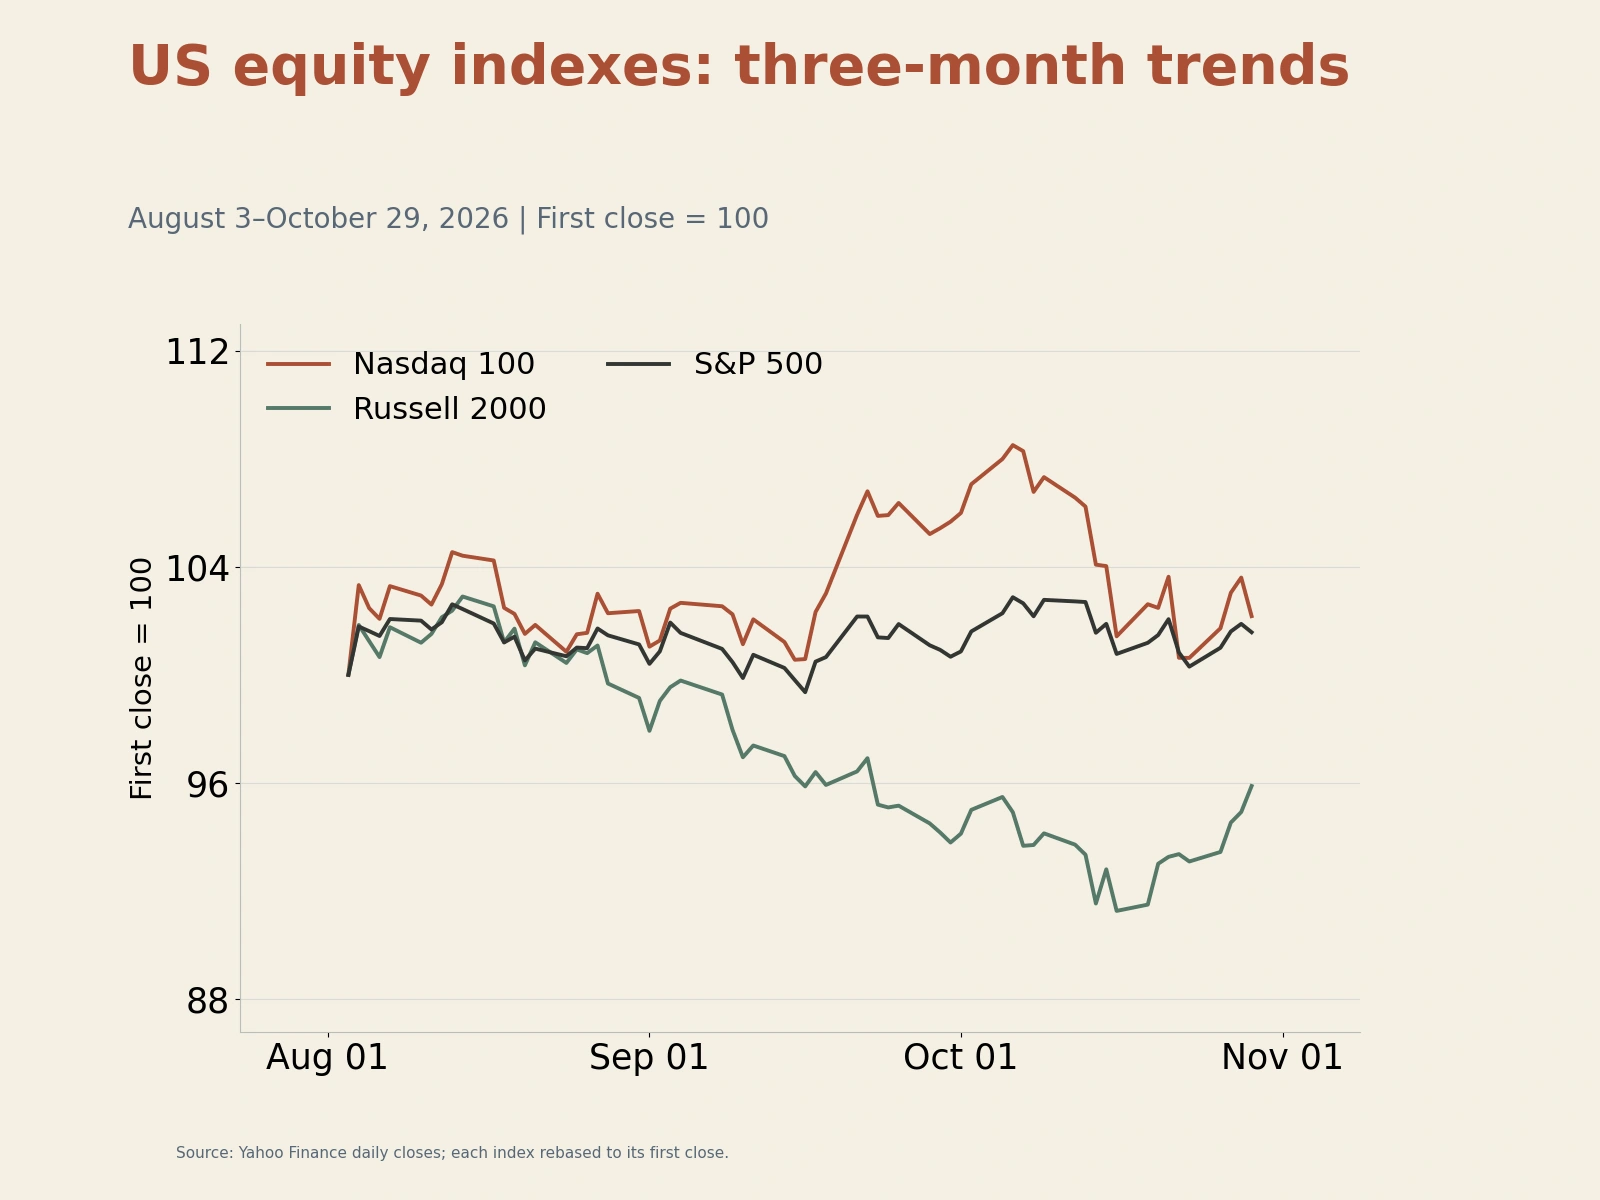
On October 29, 2026, US real GDP growth accelerated to an annualized 3.4% in the third quarter, but real consumer spending was almost flat in September. Heavy capital spending by cloud giants squeezed free cash flow, sending the Nasdaq 100 down 1.38% as money rotated into small caps and financials. Safe-haven demand and softer quarterly PCE inflation pulled the 10-year Treasury yield down to 4.98%. The ECB held its rate at 2.50%, while oil and gold both closed lower.
Read article ↗
Daily Market Review · October 29, 2026
AI hardware earnings support equities, but higher long-term yields, expensive energy and heavy cloud investment sharpen the focus on free cash flow.
Read article ↗
Daily Market Review · October 28, 2026
A US$63 billion AI-compute financing lifted chip stocks and the S&P 500. Oil and long Treasury yields fell, but short rates, the dollar and funding costs continued to constrain the recovery’s breadth.
Read article ↗
Daily Market Review · October 27, 2026
AI revenue and chip demand lifted U.S. equities, but high yields and funding costs persisted. Brazil’s post-election selloff disrupted borrowing, while Chinese liquidity support coexisted with issuer-specific credit risks.
Read article ↗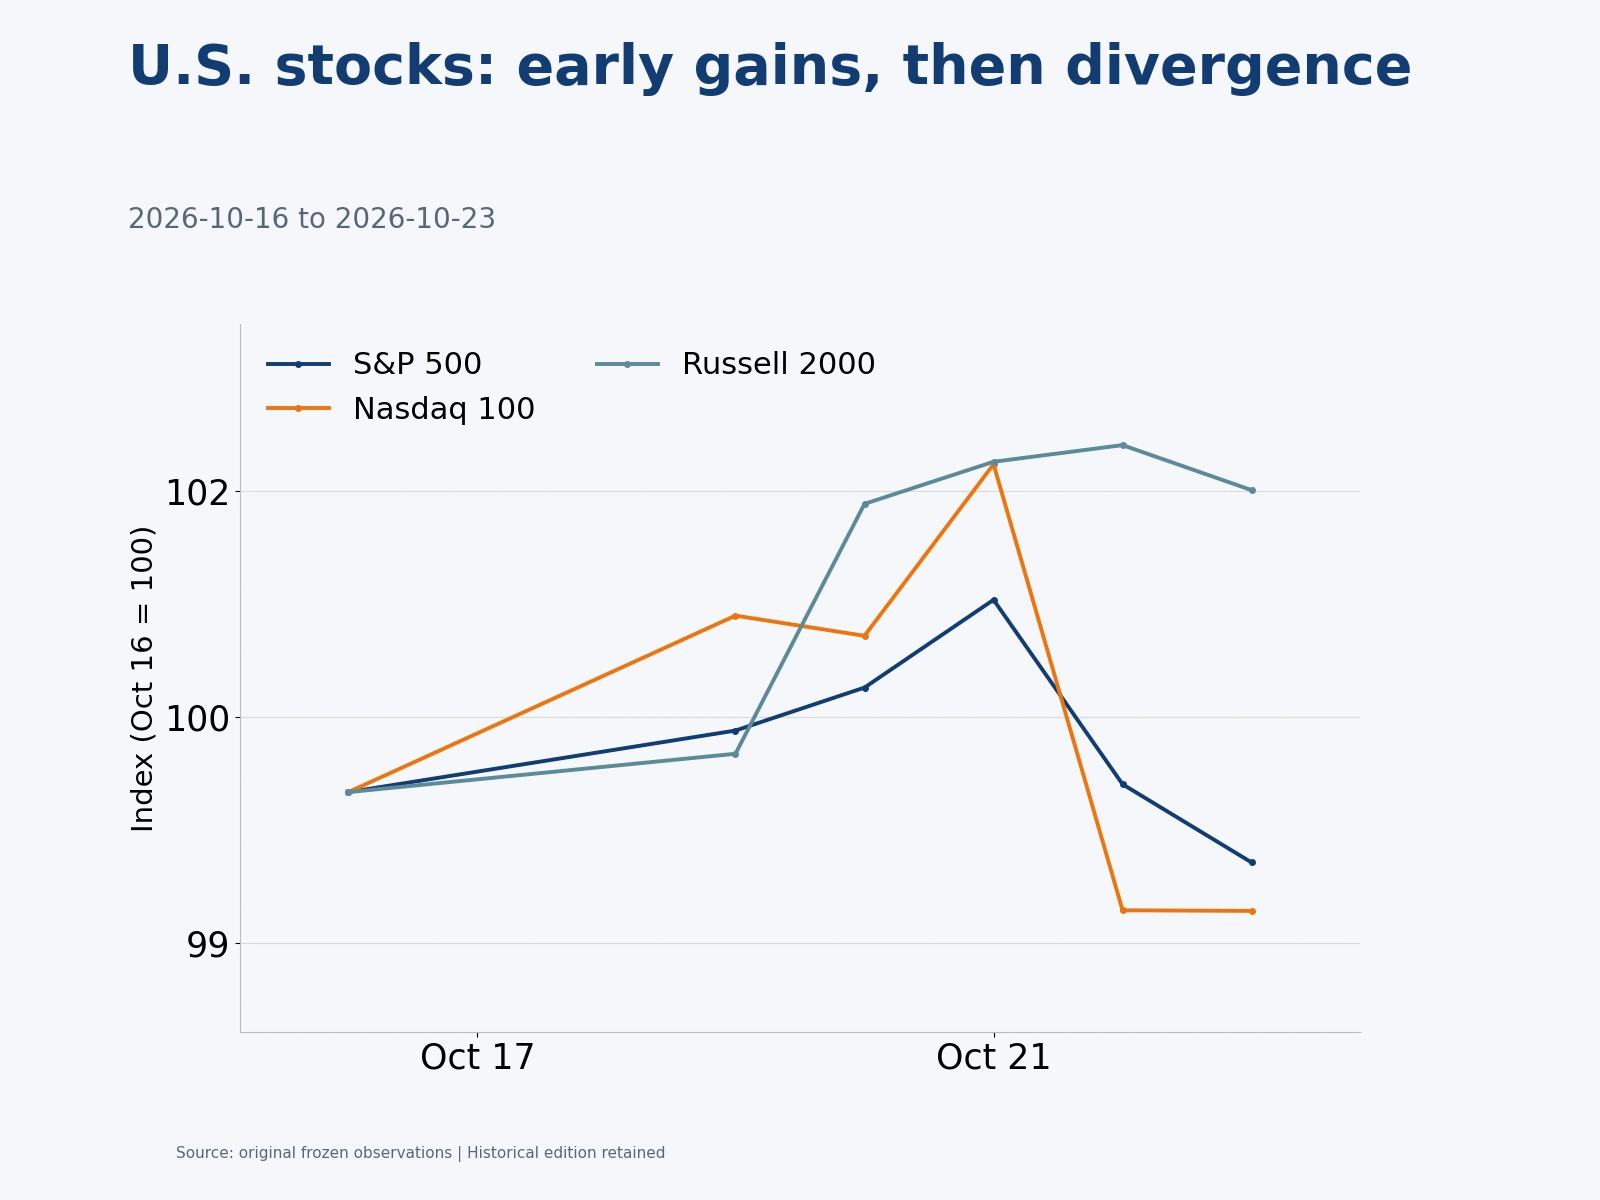
Daily Market Review · October 26, 2026
Long-term Treasury yields fell over the week, but AI funding needs widened credit premiums and weighed on technology shares. Brent gained 6.24% and gold lost 4.14% as investors focused on the cost of growth and the timing of cash returns.
Read article ↗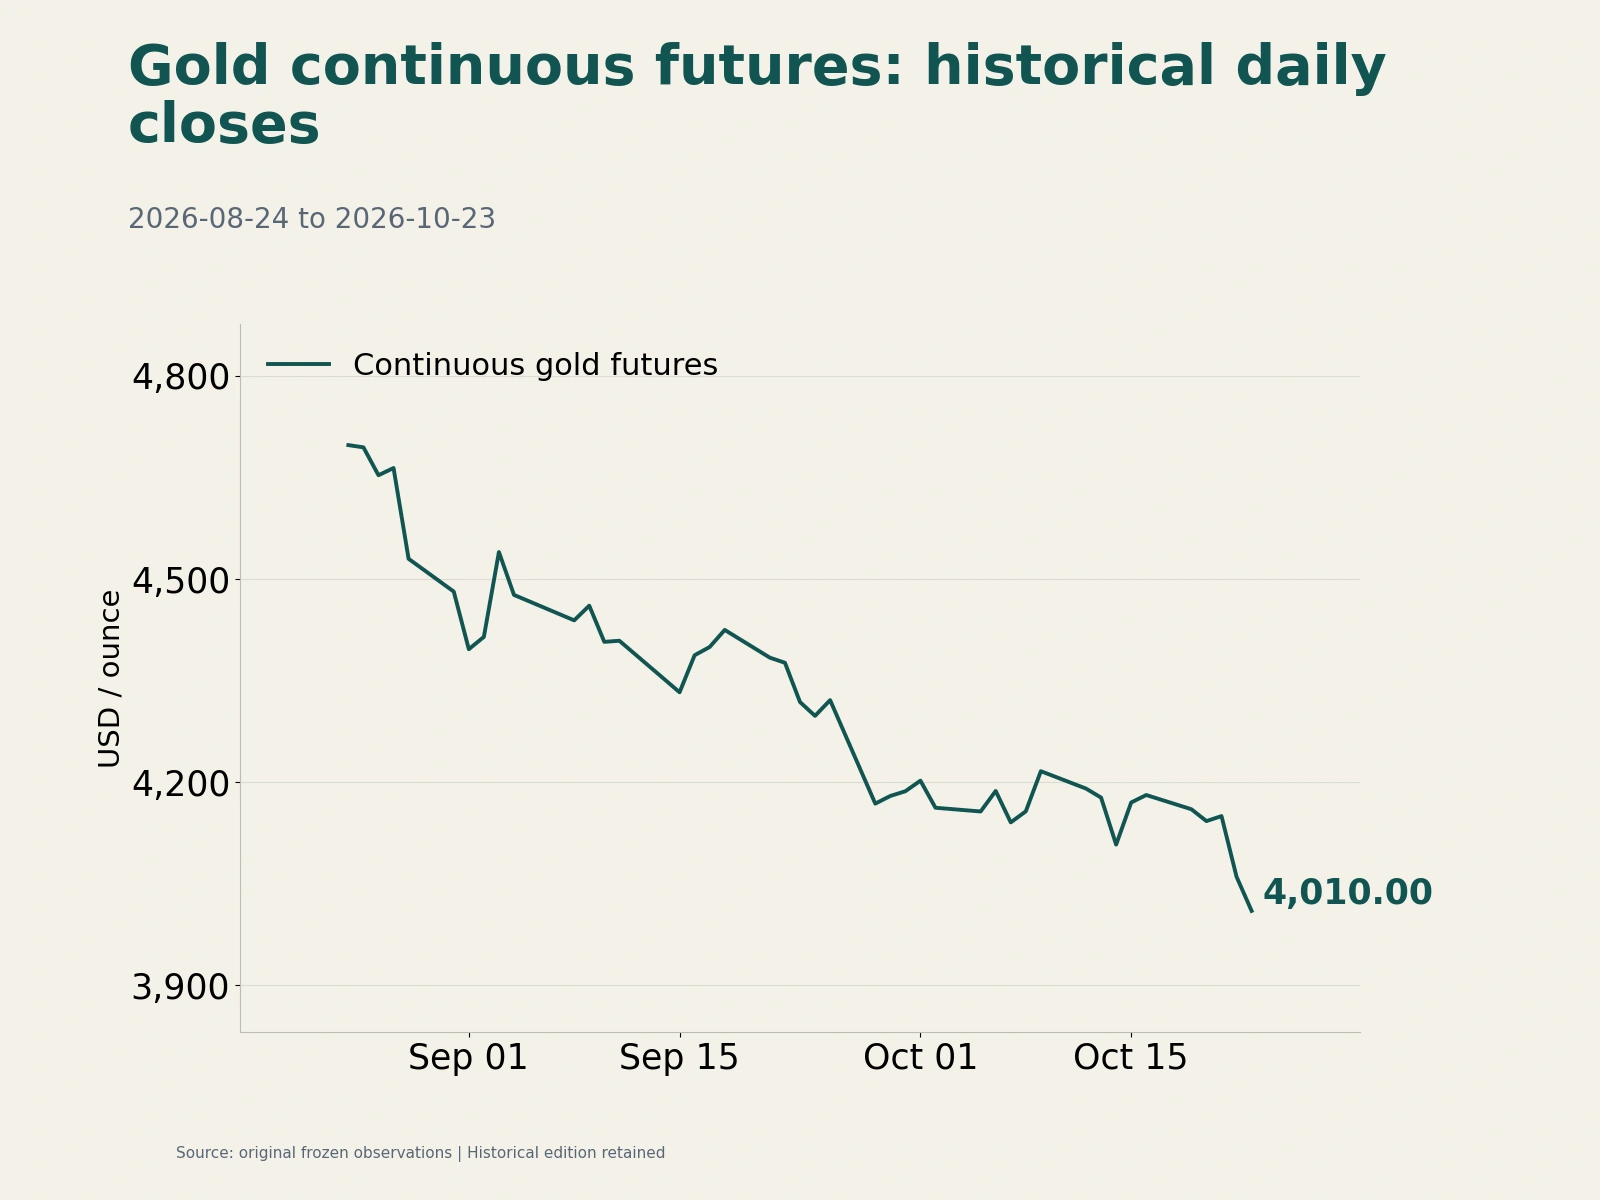
Daily Market Review · October 24, 2026
On October 23, higher US PMI output prices, a more than 3% rise in crude and a rebound in household inflation expectations pushed the 10-year Treasury yield back to 5.00% and global corporate bond spreads to 129 basis points. The S&P 500 and Dow fell and gold retreated. China's fiscal-financial coordination supported over RMB 28 trillion of credit in the first three quarters, while interest subsidies for first-home mortgages entered implementation.
Read article ↗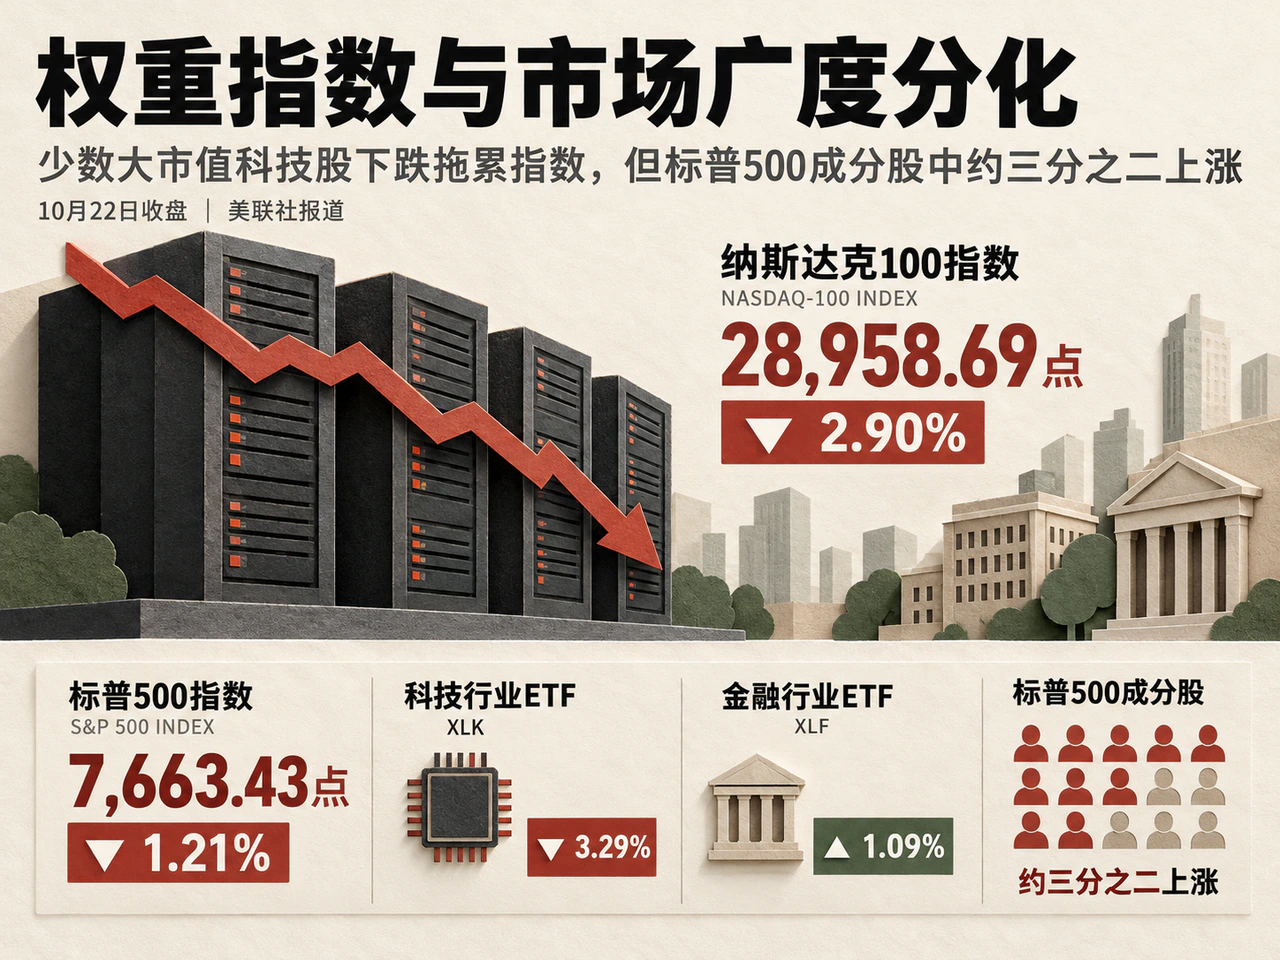
Daily Market Review · October 23, 2026
The Nasdaq 100 fell 2.90%, reviving concerns about financing AI investment. The 10-year Treasury yield dropped to 4.96%; Brent gained nearly 4%, gold weakened, and the French-German spread reached its highest since 2011.
Read article ↗
Daily Market Review · October 22, 2026
The Nasdaq 100 rose 1.13% on technology revenue growth. High Treasury yields weighed on mortgages; crude draws supported oil and rates restrained gold, while liquidity and industrial support eased some financing pressure.
Read article ↗
Daily Market Review · October 21, 2026
On October 20, 2026, US September housing starts fell for a third consecutive month. Together with oil's retreat from intraday highs, this pushed 10- and 30-year Treasury yields lower. The Dow and small caps outperformed large technology stocks, but high funding costs kept earnings delivery, free cash flow and refinancing costs under scrutiny across traditional blue chips and AI infrastructure.
Read article ↗
Daily Market Review · October 20, 2026
Cloud and chip stocks lifted the Nasdaq 100 by 1.17% on October 19, while leveraged computing providers faced expensive debt. The 10-year Treasury yield rose 6 basis points to 5.15%; US housing sentiment hit its lowest since June 2012. Russian-sanctions exemptions and recovering Gulf supply lowered prompt Brent, while gold fell 0.67% under pressure from the dollar and real yields. China's third-quarter GDP grew a stronger-than-expected 4.5%.
Read article ↗
Daily Market Review · October 19, 2026
During October 12–18, WTI jumped 10.41% above $100, US September CPI rose 3.7% year on year, and fuel bills squeezed core retail growth. Growth concerns lowered the 10-year Treasury yield by 15 basis points as high-yield spreads widened. Computing-related debt and chip competition triggered a technology repricing, sending the Nasdaq 100 down 5.49%.
Read article ↗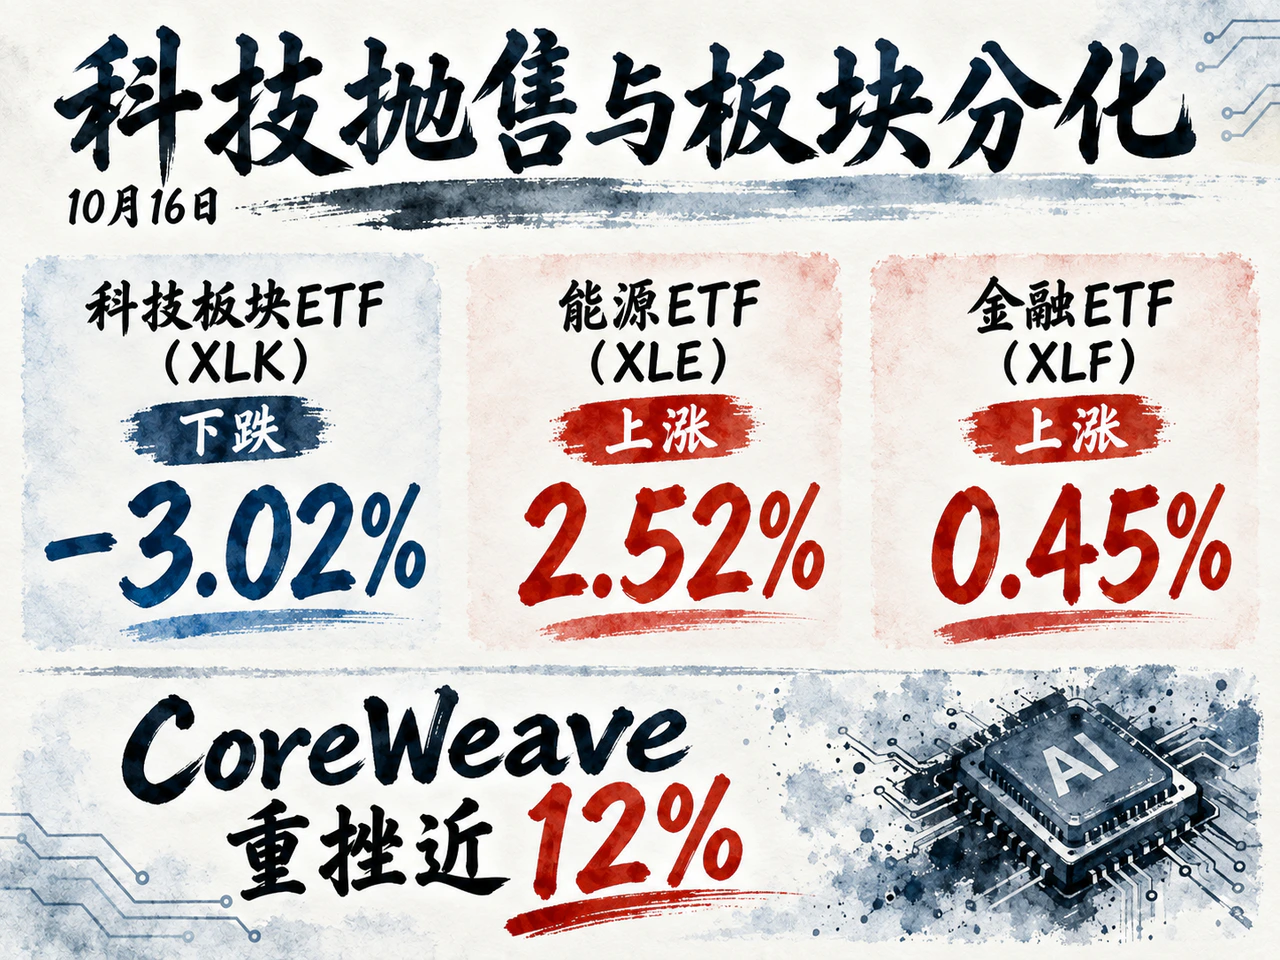
Daily Market Review · October 17, 2026
On October 16, concerns over debt-funded, capital-intensive AI expansion triggered a technology selloff. CoreWeave fell nearly 12% and the Nasdaq 100 lost 2.50%. U.S. September import prices rose 8.1% year on year, the most in over four years. Brent's 3.56% rise to $109.69 and a fiscal-year deficit near $2 trillion kept the ten-year Treasury yield at 5.09%, while expectations of a rate-hike pause lowered the two-year yield three basis points to 4.74%.
Read article ↗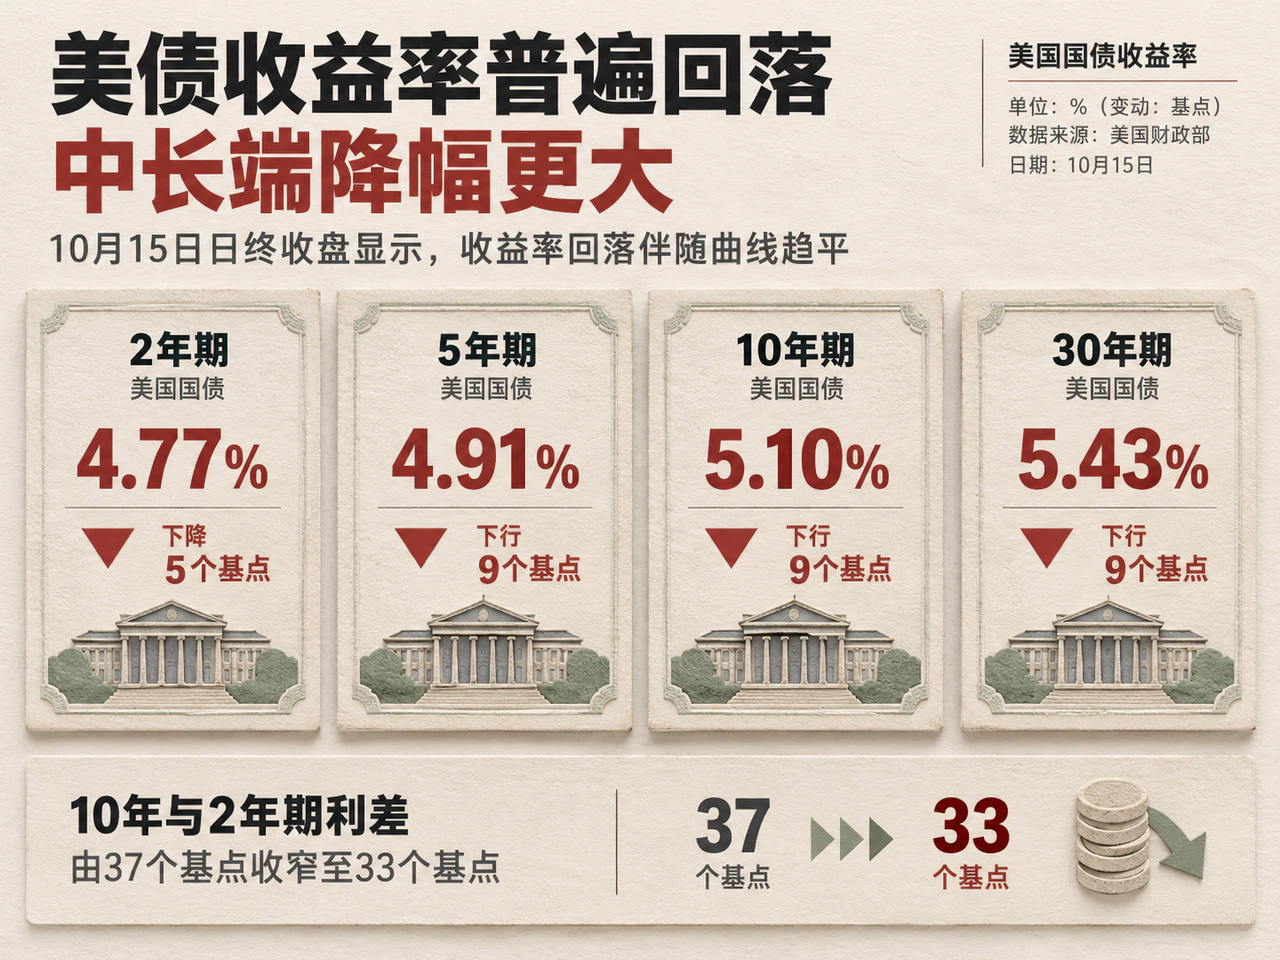
Daily Market Review · October 16, 2026
On October 15, 2026, US September PPI rose 1.3% month on month, its largest increase in over four years, yet the 10-year Treasury yield fell nine basis points to 5.10% as attention shifted to high rates' constraints on consumption and leveraged AI firms' debt service. Stocks rotated toward financials, small caps and traditional blue chips; chip selling hit Japan and Korea. A weaker dollar lifted gold 1.86%, while US crude inventory draws and tanker-sanctions expectations split WTI and Brent.
Read article ↗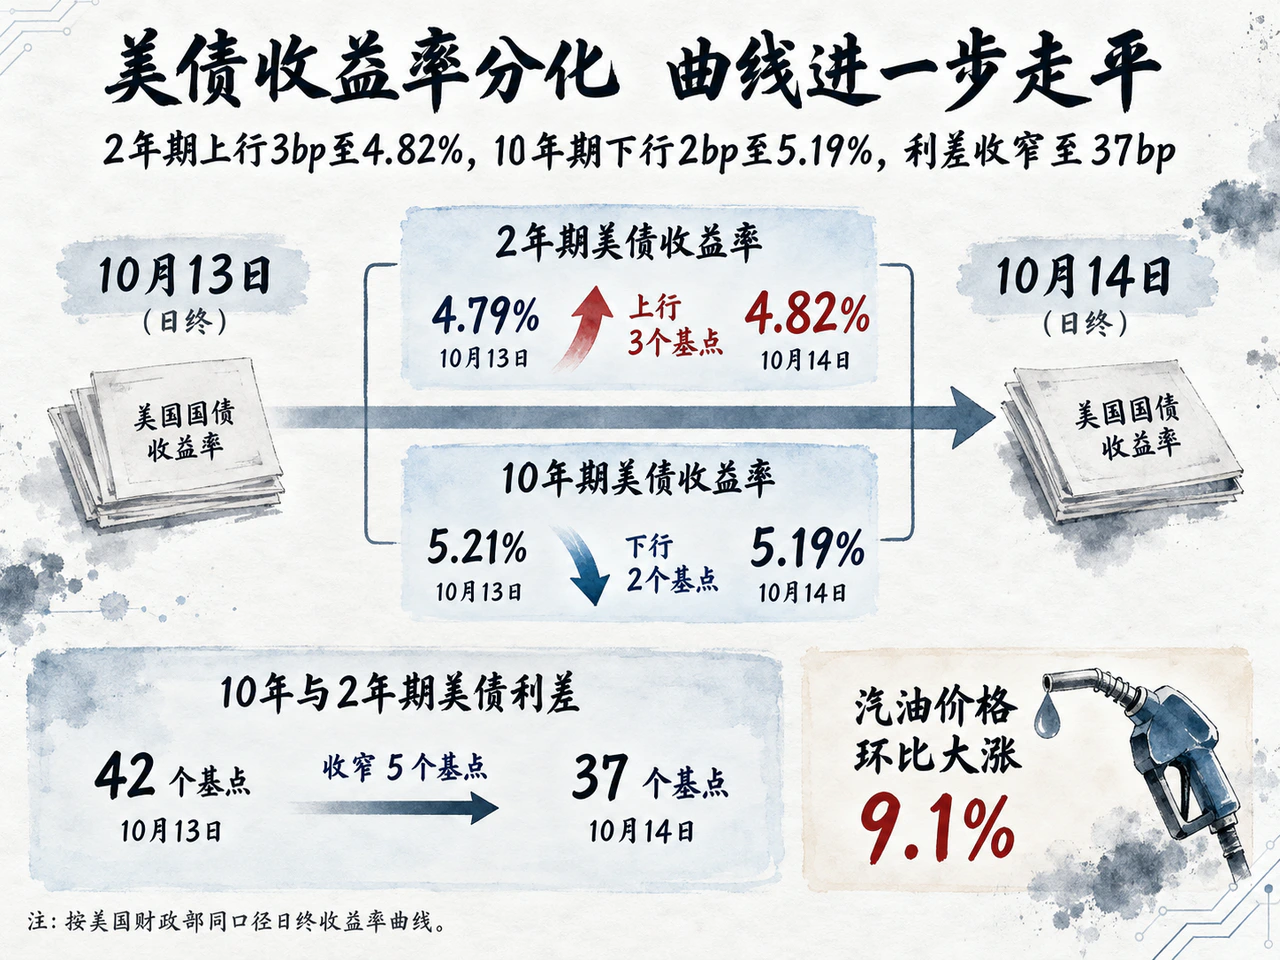
Daily Market Review · October 15, 2026
U.S. September CPI rose a stronger-than-expected 3.7% year on year. The Treasury curve flattened, but a late long-bond rally could not mask simultaneous AI equity and credit weakness. Onshore oil stocks fell sharply, nearly 30% of G7 and Spanish debt matures within a year, and strong Chinese exports coexist with weak household credit, tightening cross-asset scrutiny of cash flows and credit quality.
Read article ↗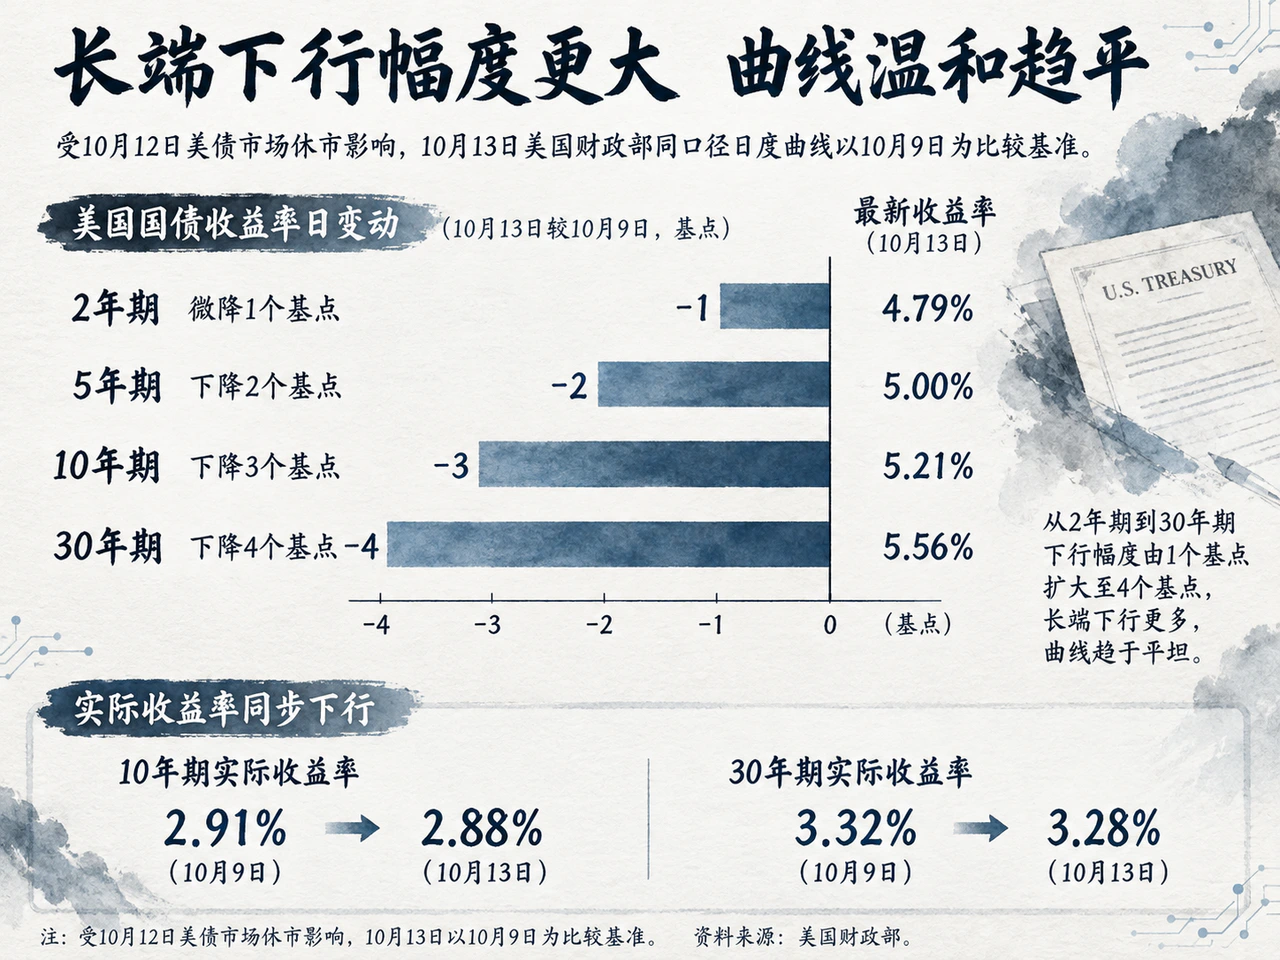
Daily Market Review · October 14, 2026
October 13 brought a mild Treasury bull flattening, strong allocation demand and persistent short-rate constraints. U.S. stocks edged lower amid earnings and memory competition; oil and gold diverged, while long technology bonds drew strong demand and growing long-term supply tested market capacity.
Read article ↗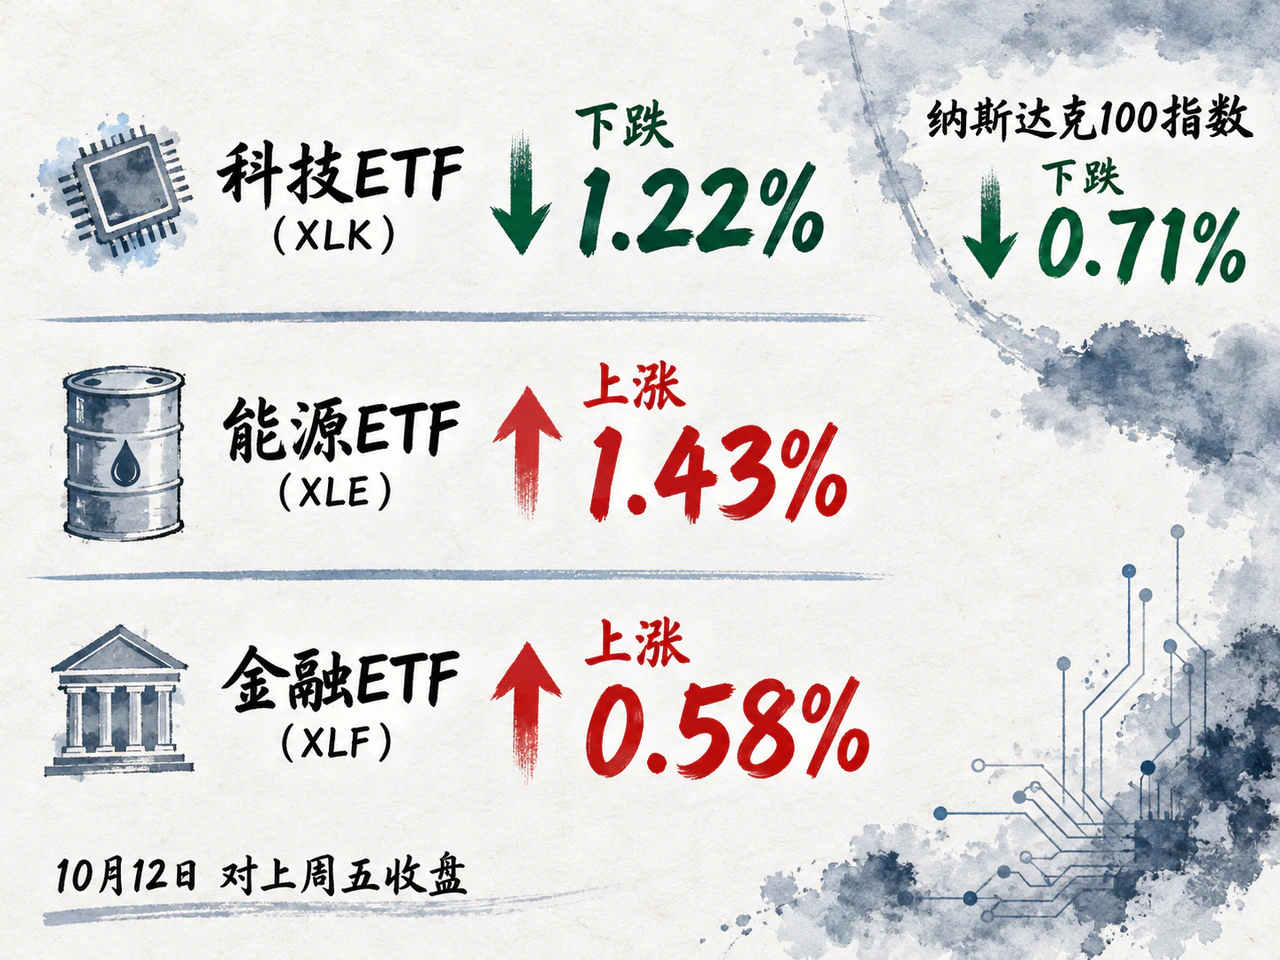
Daily Market Review · October 13, 2026
October 12 markets diverged: the Nasdaq 100 fell 0.71% on semiconductor weakness while the Dow edged higher; oil rose and gold fell. BlackRock upgraded short Treasuries. China will cut the NEV export rebate to 9% from April 2027, accelerate RMB 550 billion of unused debt quota, and reached an interim hybrid-car export framework with Europe.
Read article ↗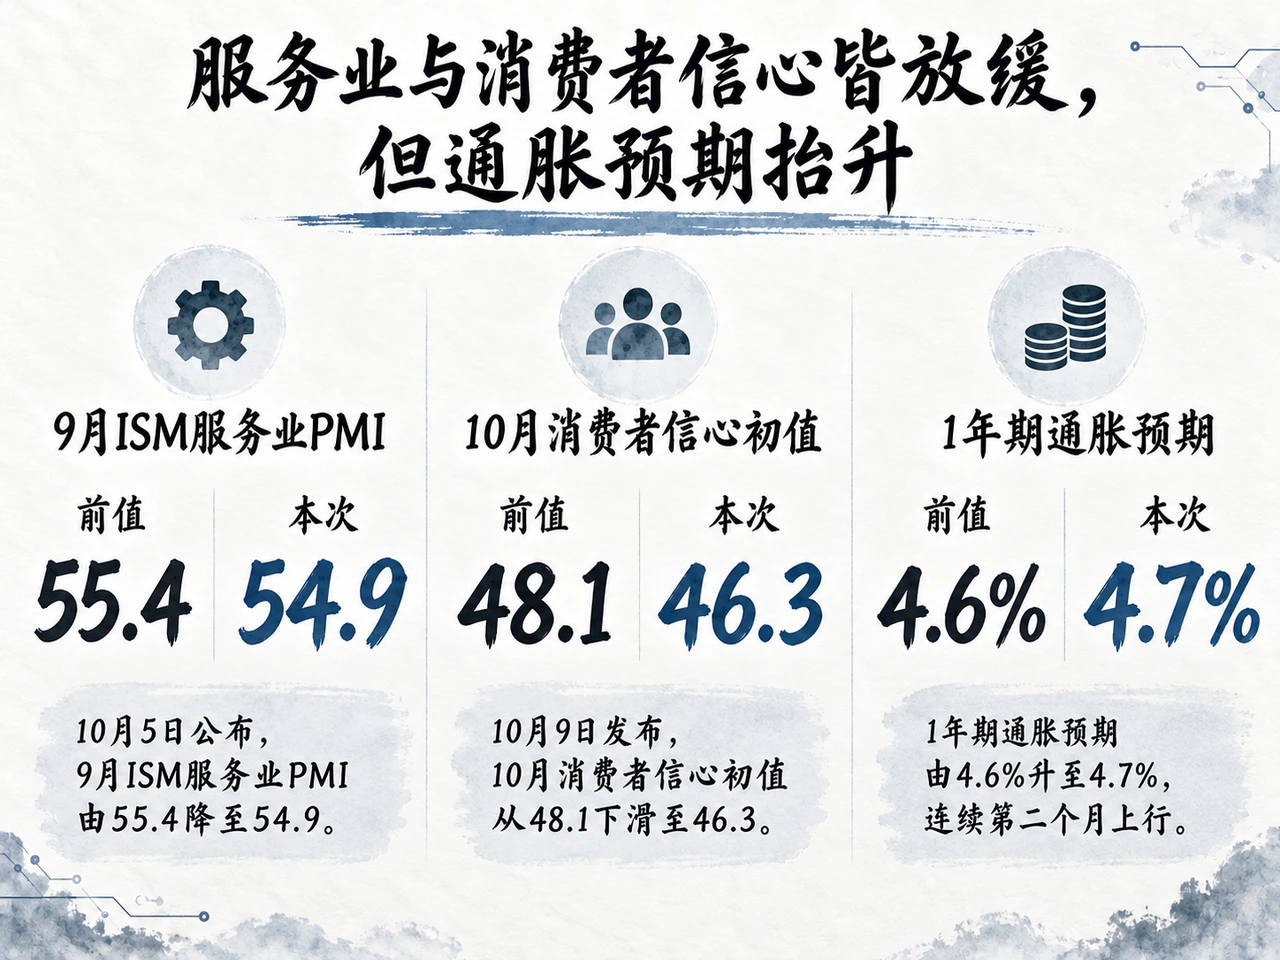
Daily Market Review · October 12, 2026
October 5–11 brought modest recovery and deep divergence. Energy and financials lifted the S&P 500 1.15%, while technology capex faced revenue scrutiny. The 10-year Treasury yield fell to 5.24%; auctions were firm but credit split. Supply disruptions lifted Brent 2.42%, gold recovered to $4,216.30, and Asian equities faded from highs as Chinese fiscal and monetary policies supported demand.
Read article ↗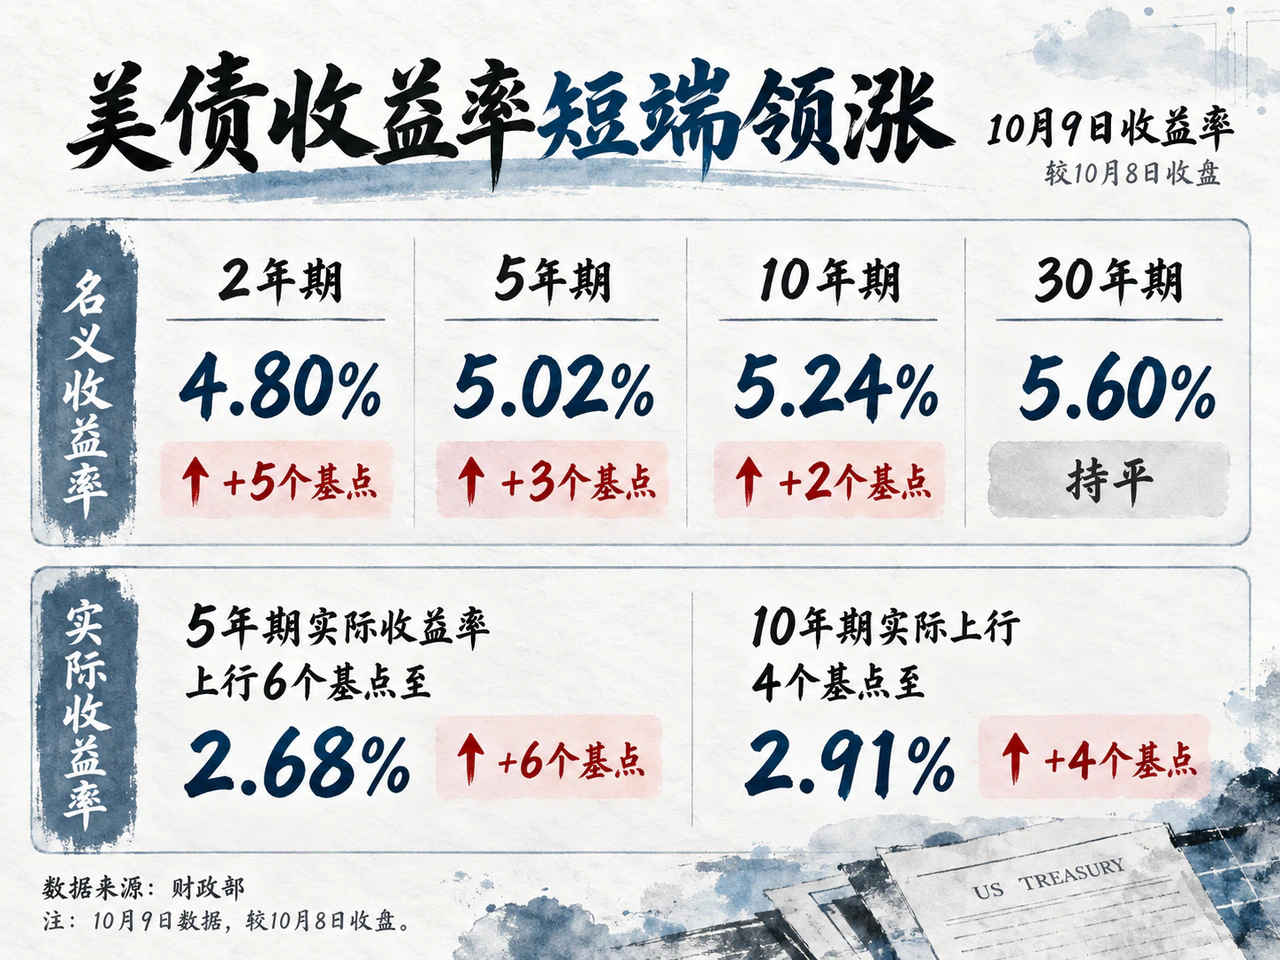
Daily Market Review · October 10, 2026
On October 9, 2026, AI commercialization prospects lifted U.S. stocks, with the S&P 500 gaining 0.59%. Michigan survey inflation expectations rose for a second month, driving a short-end-led rise in Treasury yields and higher real rates. Dip buying lifted COMEX gold 1.52% back above $4,220, while oil erased early losses to finish slightly higher.
Read article ↗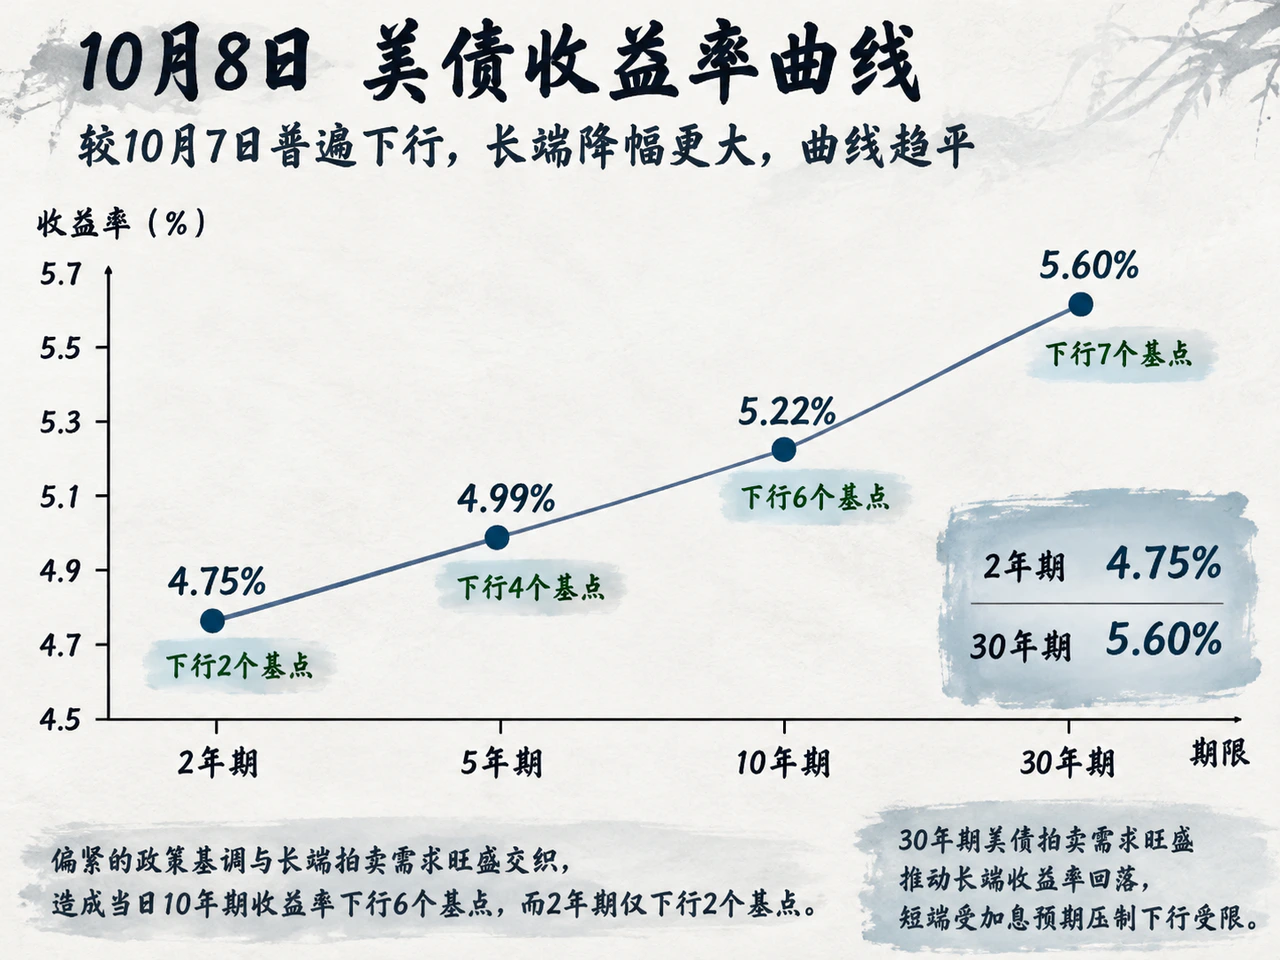
Daily Market Review · October 9, 2026
October 8 long-bond auction demand lowered yields while hike expectations restrained the front end. AI monetization and financing scrutiny hit technology; Gulf oil shutdowns lifted crude and lower real yields supported gold.
Read article ↗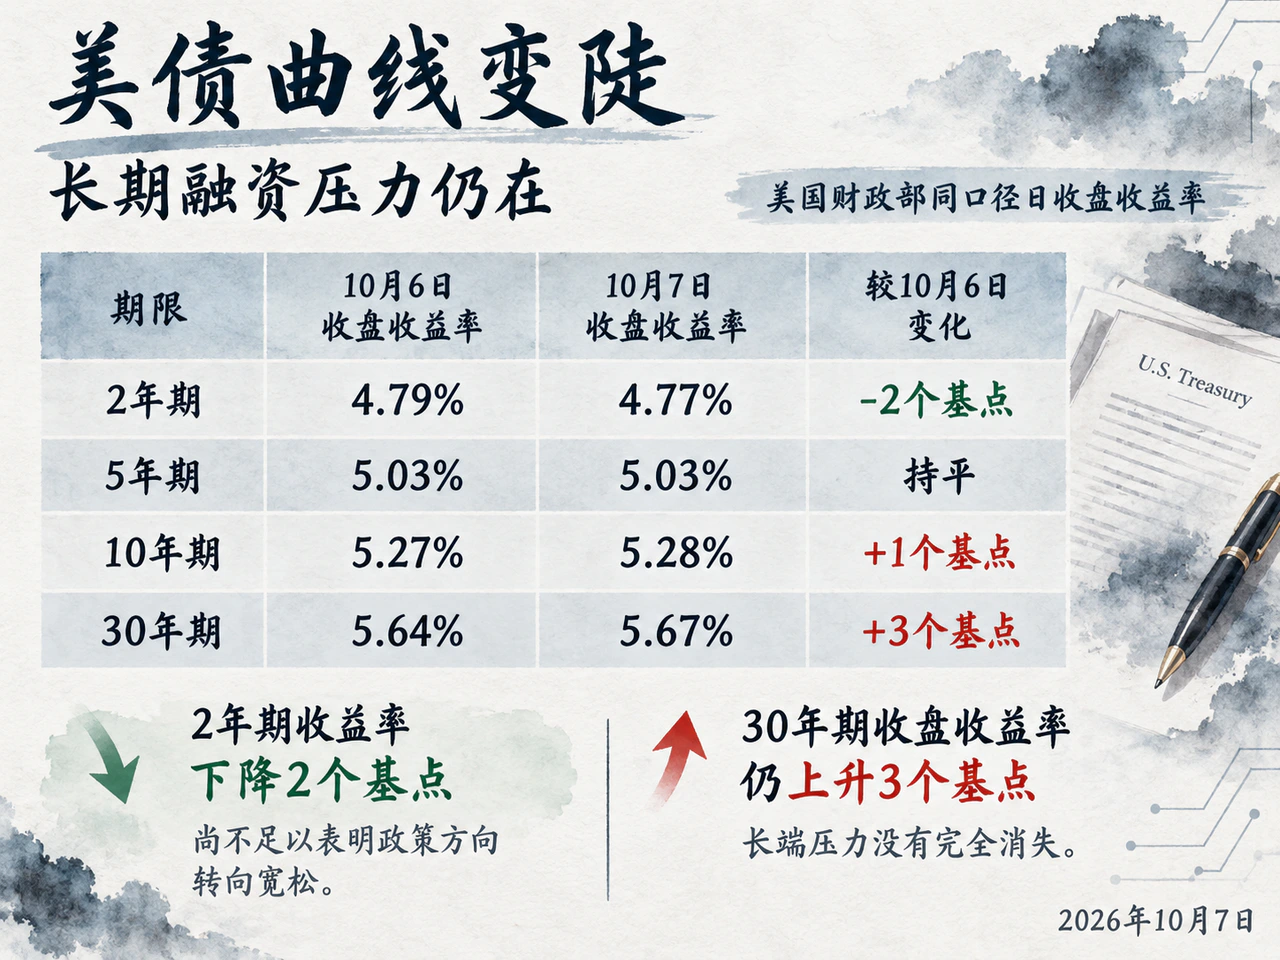
Daily Market Review · October 8, 2026
On October 7 the 2-year yield eased to 4.77% while long yields rose. Small caps, homebuilders and gold underperformed. After-hours AI-infrastructure and consumer earnings, plus Samsung's preliminary results, highlighted profit divergence amid high funding costs.
Read article ↗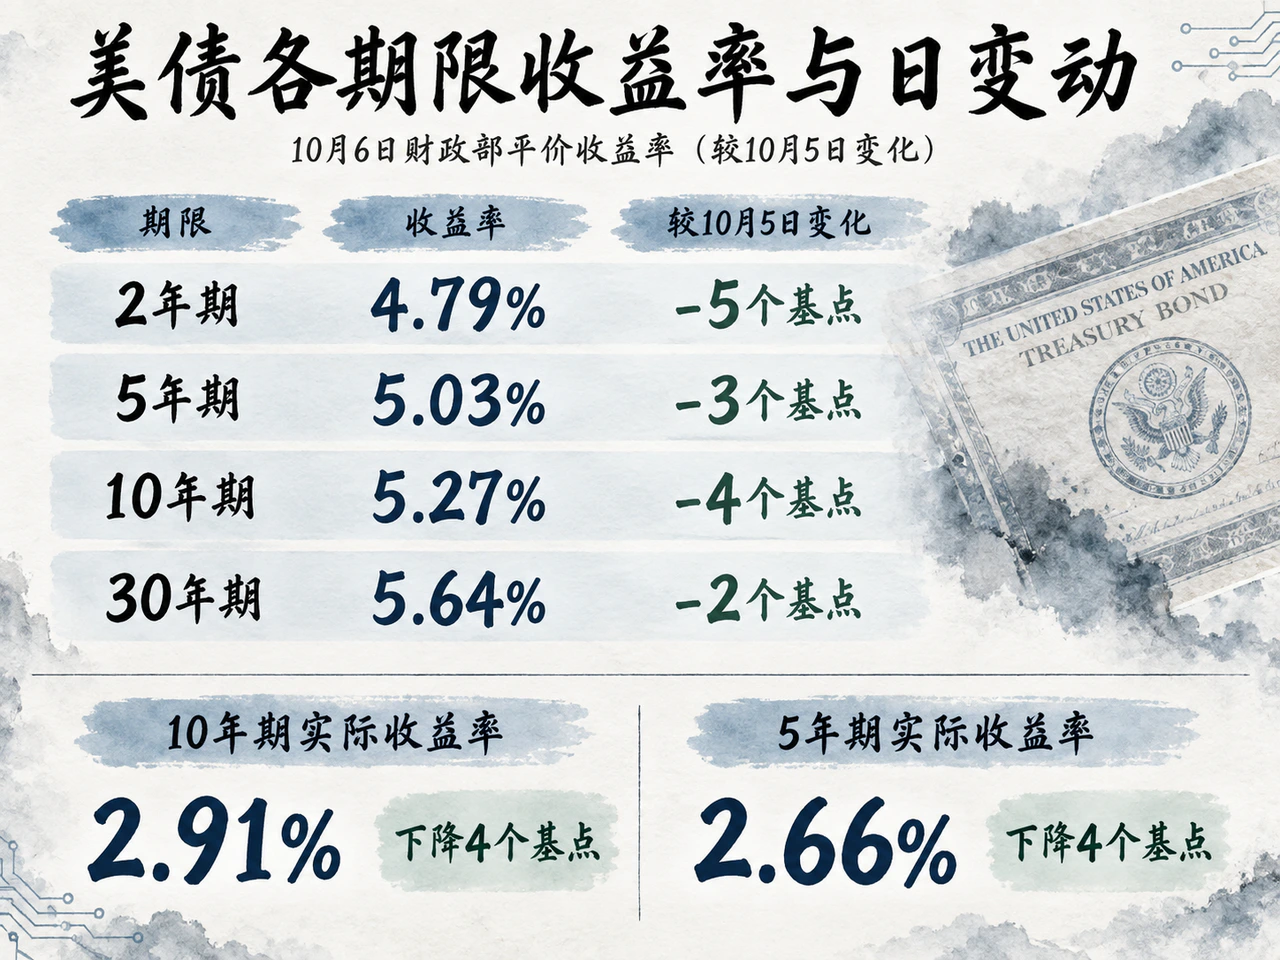
Daily Market Review · October 7, 2026
On October 6, 2026, Treasury yields fell across maturities, the S&P 500 hit a record close and gold strengthened. Small caps declined and oil recovered a steep intraday loss. A wider US trade deficit, higher capital-goods imports and faster private hiring showed resilient demand. Corporate guidance supported large caps, while inflation compensation and elevated oil still limited easing expectations.
Read article ↗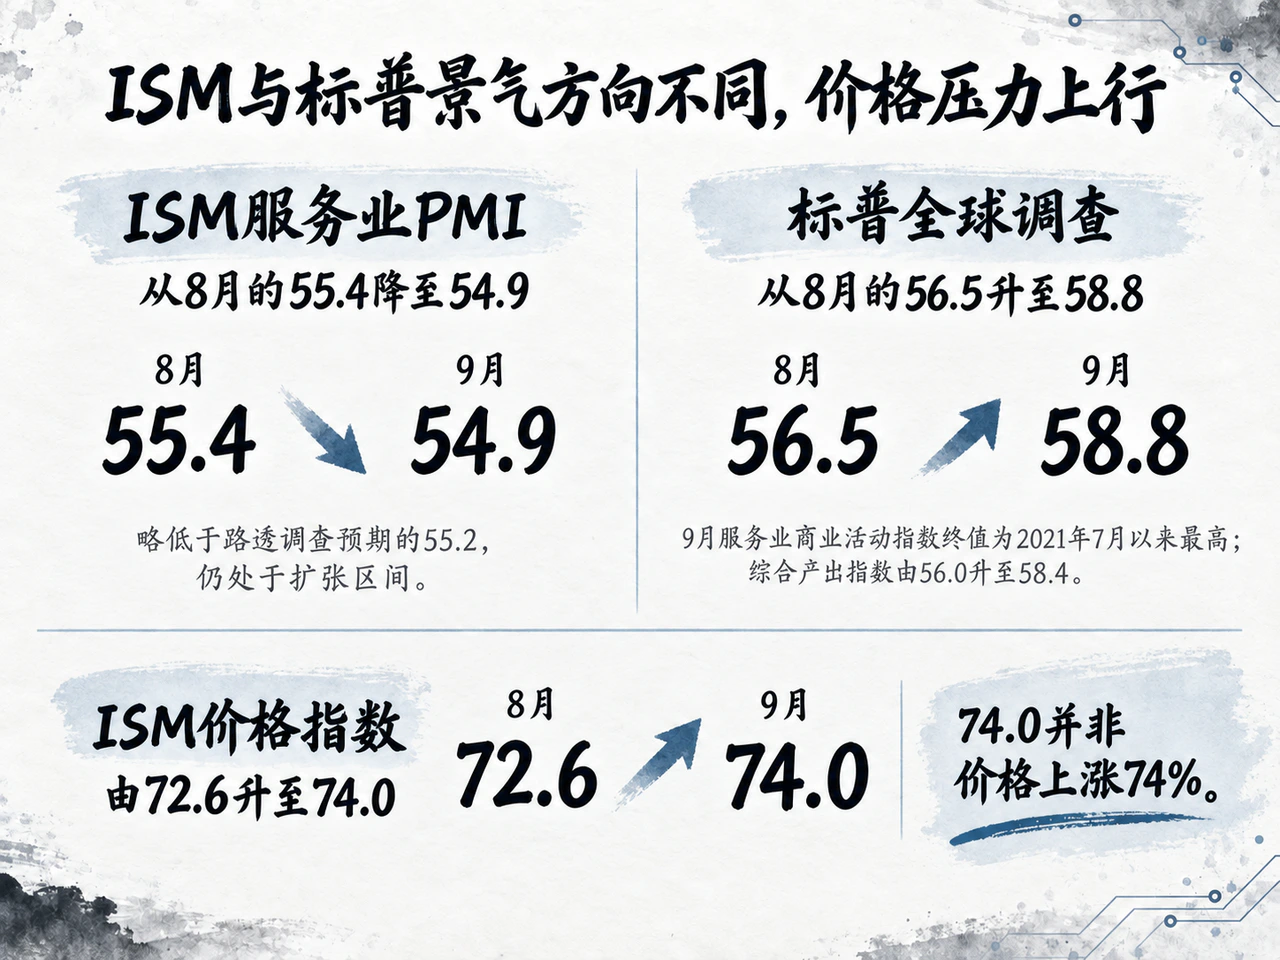
Daily Market Review · October 6, 2026
On October 5, the S&P 500 rose 0.66%, oil fell about 2% and long-term U.S. Treasury yields continued to rise. Earnings expectations and takeover news supported equities, while service-sector cost pressures and financing needs constrained long bonds. France's budget dispute and Brazil's election results drove national-market divergence; Asia's next focus was orders and policy implementation.
Read article ↗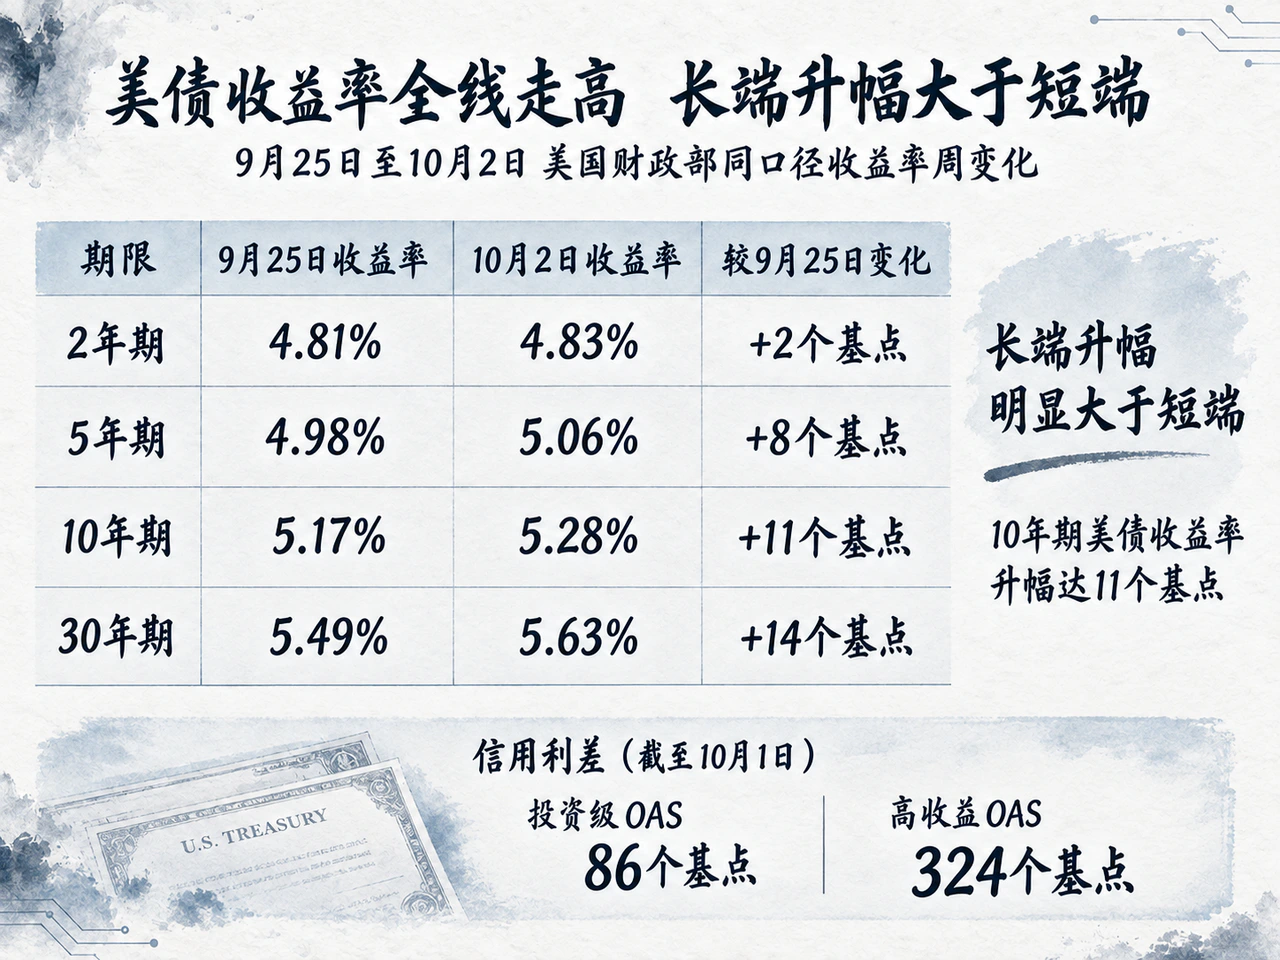
Daily Market Review · October 5, 2026
During September 28–October 4, 2026, near-term Fed hike fears eased while long-term borrowing costs rose, taking the 10-year Treasury yield to 5.28%. Technology guidance and shareholder returns supported a divided equity market, gold and oil fell, and investors increasingly tested actual earnings and cash flows.
Read article ↗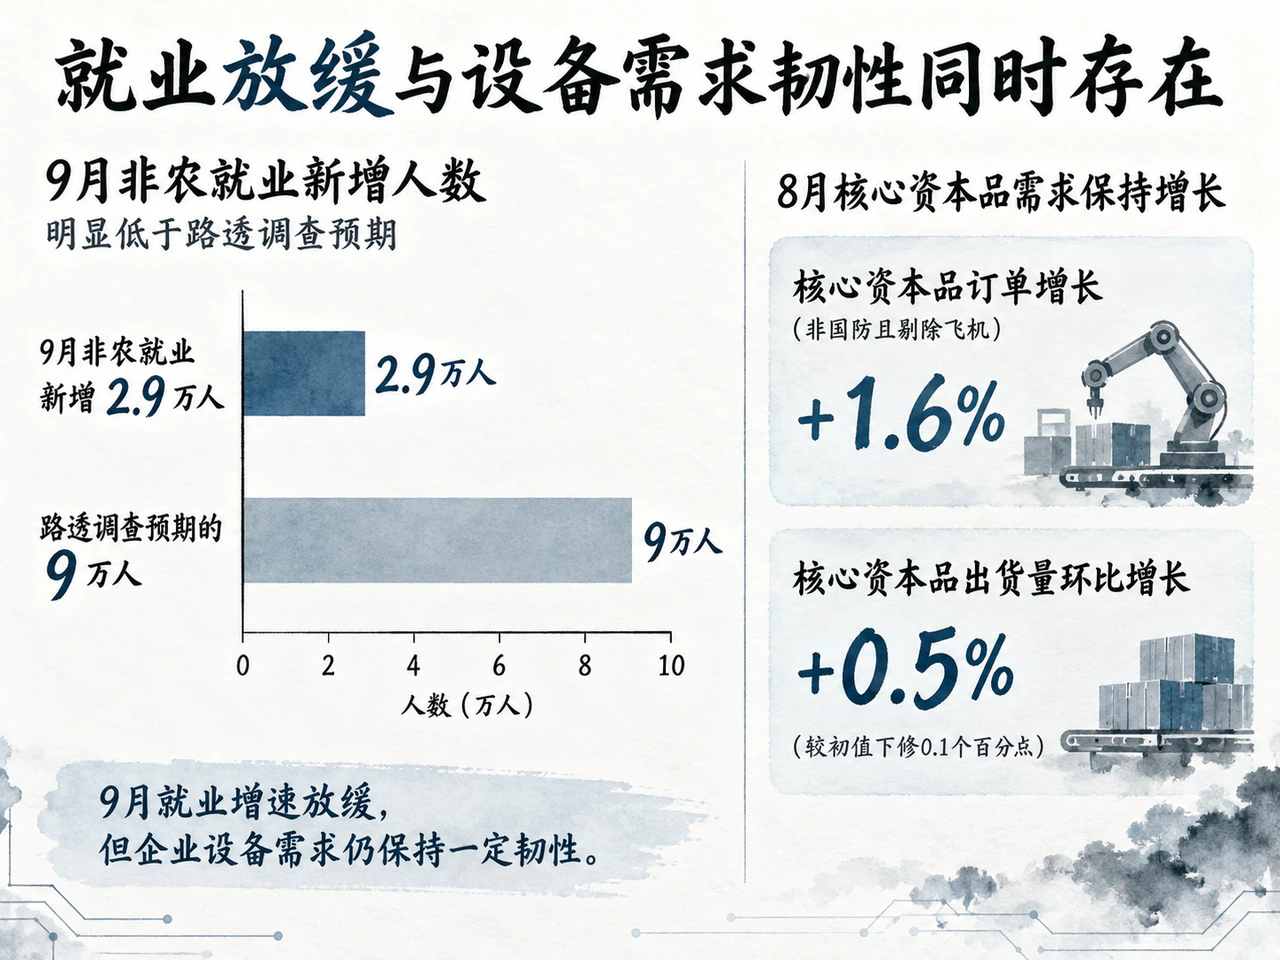
Daily Market Review · October 3, 2026
September payroll growth of just 29,000 eased tightening fears and lifted US stocks, but rising real rates pushed Treasury yields higher and gold lower. G7 reserve releases and rejection of a US diesel export ban eased supply risks as oil diverged. Elevated French sovereign spreads highlighted still-tight credit conditions.
Read article ↗
Daily Market Review · October 2, 2026
On October 1, Treasury yields reversed early rises, with the two-year down 10 basis points. Patient Fed comments eased hike fears and stocks edged higher, but manufacturing input prices and oil rose while credit and earnings diverged.
Read article ↗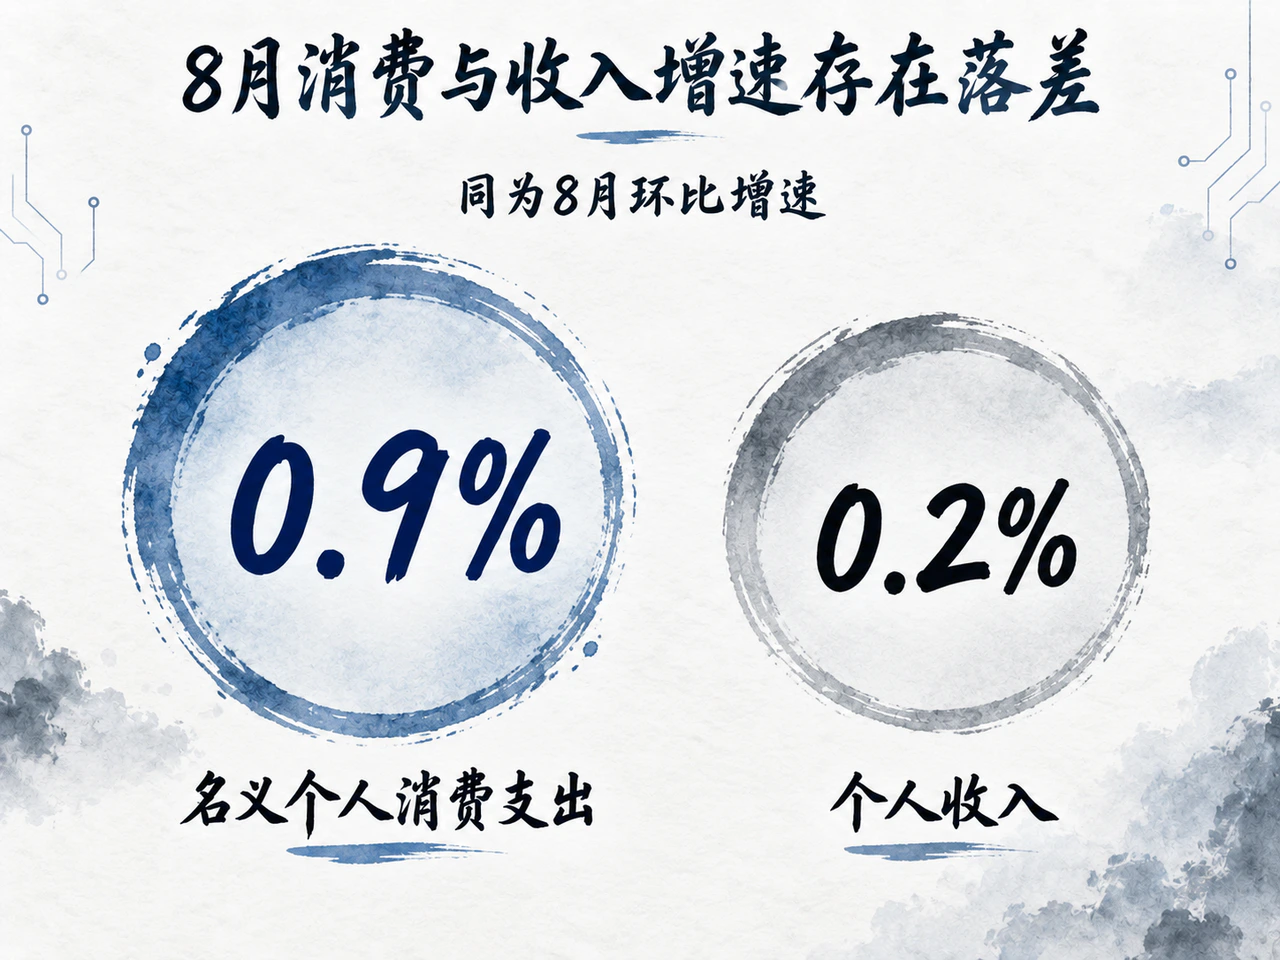
Daily Market Review · October 1, 2026
On September 30, core PCE rose a softer-than-expected 0.2% in August, but strong spending and corporate-bond supply pushed the 10-year Treasury yield to 5.29%. Most equity sectors fell while Nasdaq 100 gained 0.23% on computing orders. Oil rose, real rates constrained gold, and China's manufacturing PMI returned to expansion at 50.1% alongside input-cost pressure.
Read article ↗
Daily Market Review · September 30, 2026
Weak U.S. employment and confidence data lowered the two-year yield to 4.89% on September 29, while supply pressures helped lift the ten-year to 5.26%, widening the spread to 37 basis points. Stocks diverged narrowly, with chips and memory lifting the Nasdaq 100 by 0.21%. Vendor continuous-futures closes showed WTI down 3.56% at $89.30 and gold up 1.06% at $4,212.70. China expanded structural support and first-home mortgage interest subsidies, while markets awaited its manufacturing PMI and Micron earnings.
Read article ↗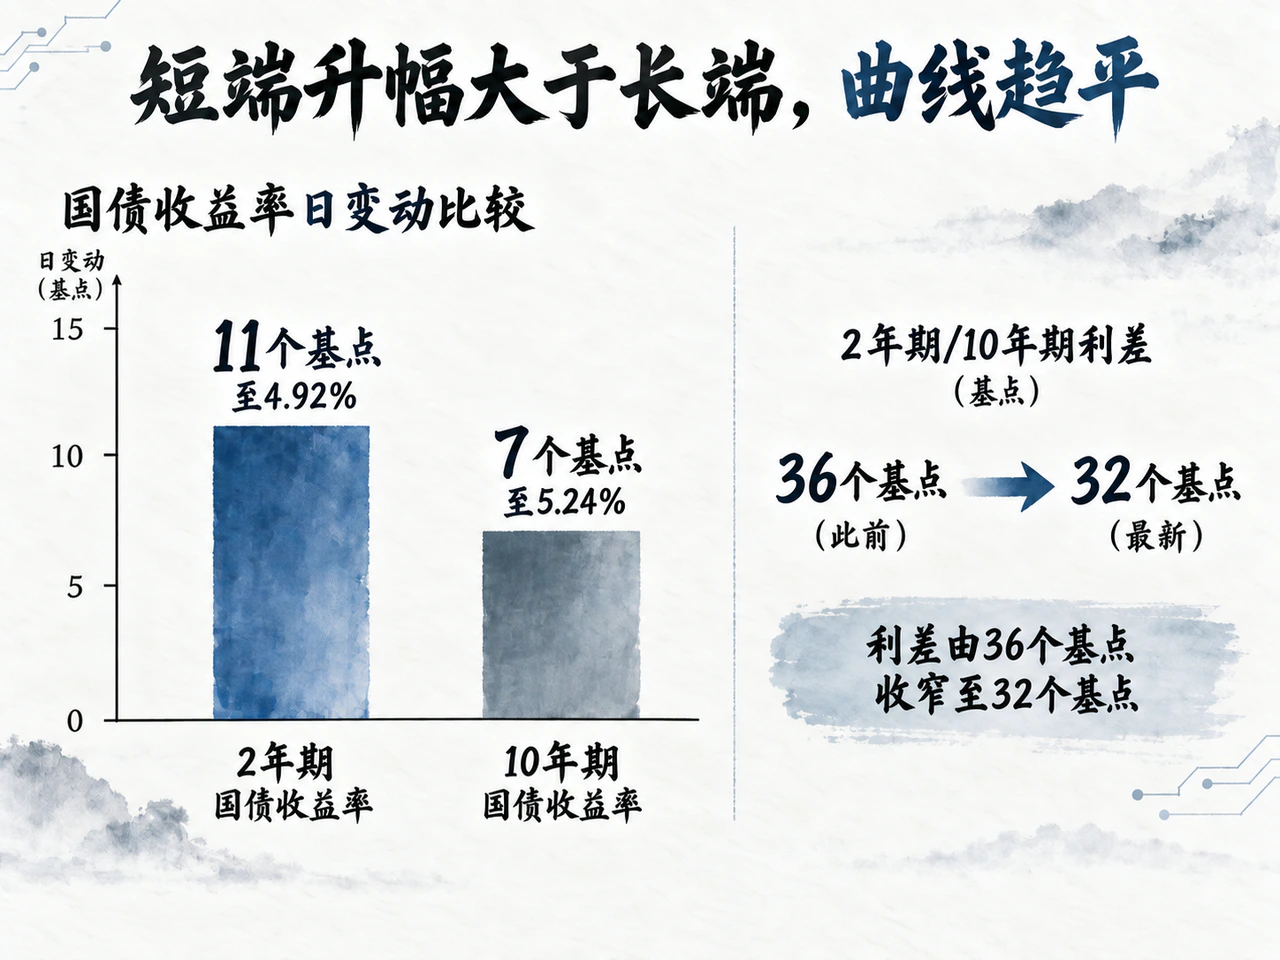
Daily Market Review · September 29, 2026
On September 28, 2026, Treasury yields rose across the curve, the S&P 500 fell 0.77%, gold dropped 3.81% and oil surrendered most early gains. Nvidia's $150 billion buyback authorization and U.S.-China tariff concessions on $60 billion of goods failed to offset macro tightening pressure. China's central bank injected over RMB 1 trillion through reverse repos to offset quarter-end liquidity needs.
Read article ↗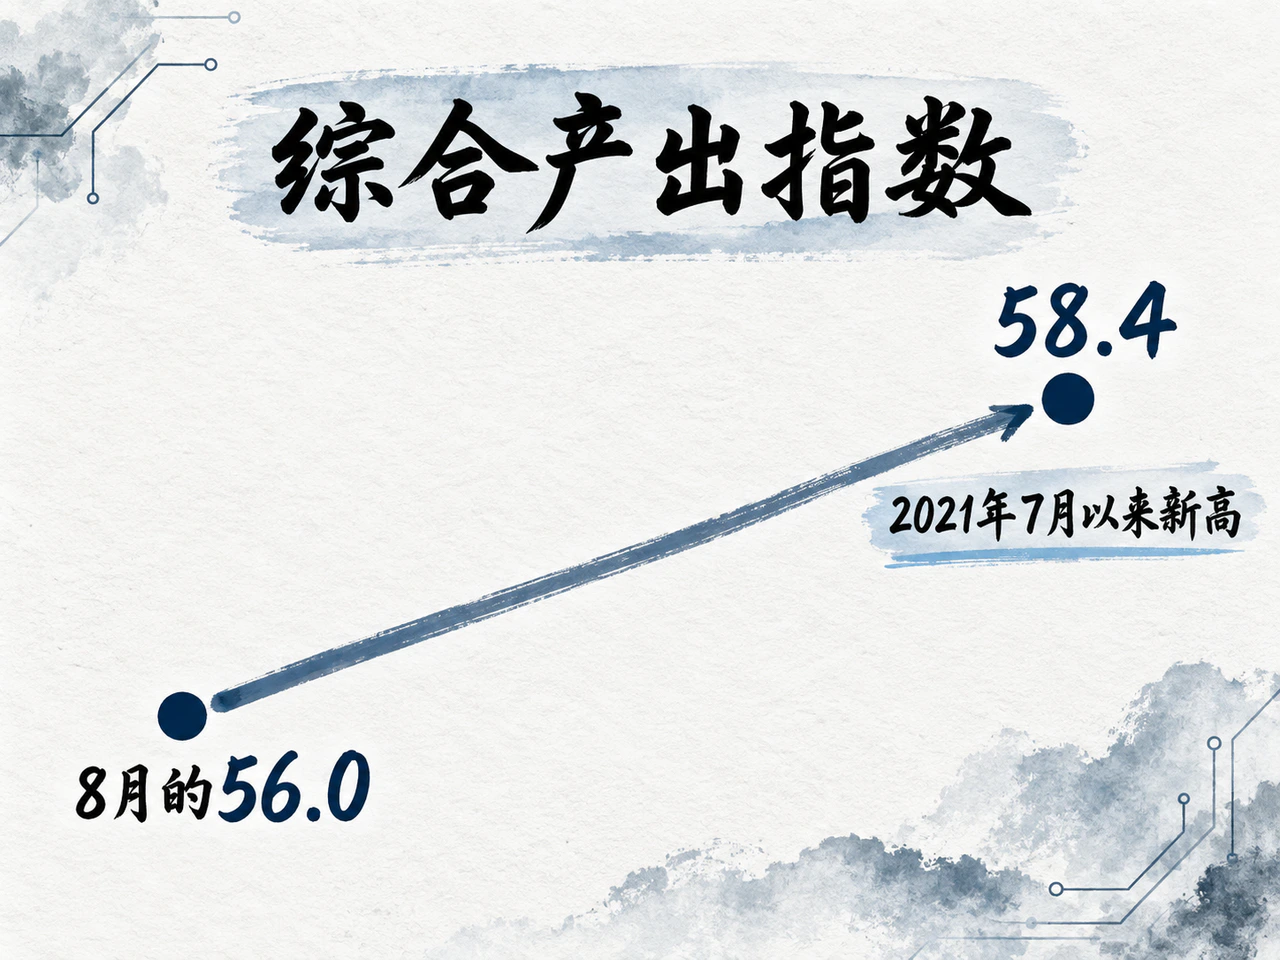
Daily Market Review · September 28, 2026
Strong U.S. demand data lifted the ten-year Treasury yield 16 basis points to 5.17%, raising real financing costs. Nasdaq 100 gained 3.25%, while small caps and financials fell. Brent's nearby premium widened and gold lost 2.34%.
Read article ↗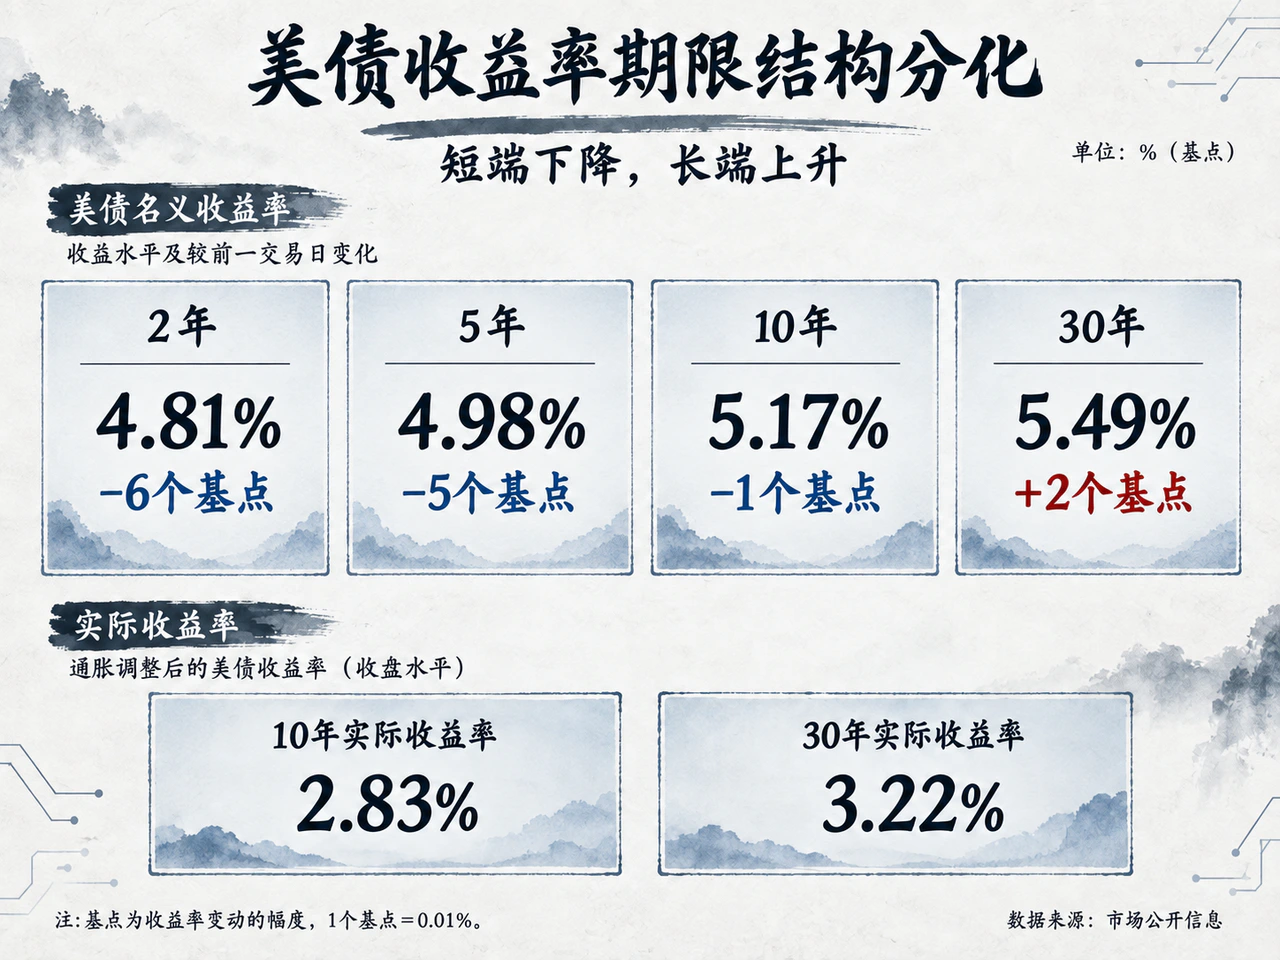
Daily Market Review · September 26, 2026
Oil retreated on September 25, supporting US equities, lower short Treasury yields and a weaker dollar as COMEX gold rebounded. Yet the 30-year yield rose to 5.49% and one-year Michigan inflation expectations jumped to 4.6%, showing persistent long-term financing and inflation constraints. Core capital-goods orders showed investment resilience, while crude backwardation remained pronounced.
Read article ↗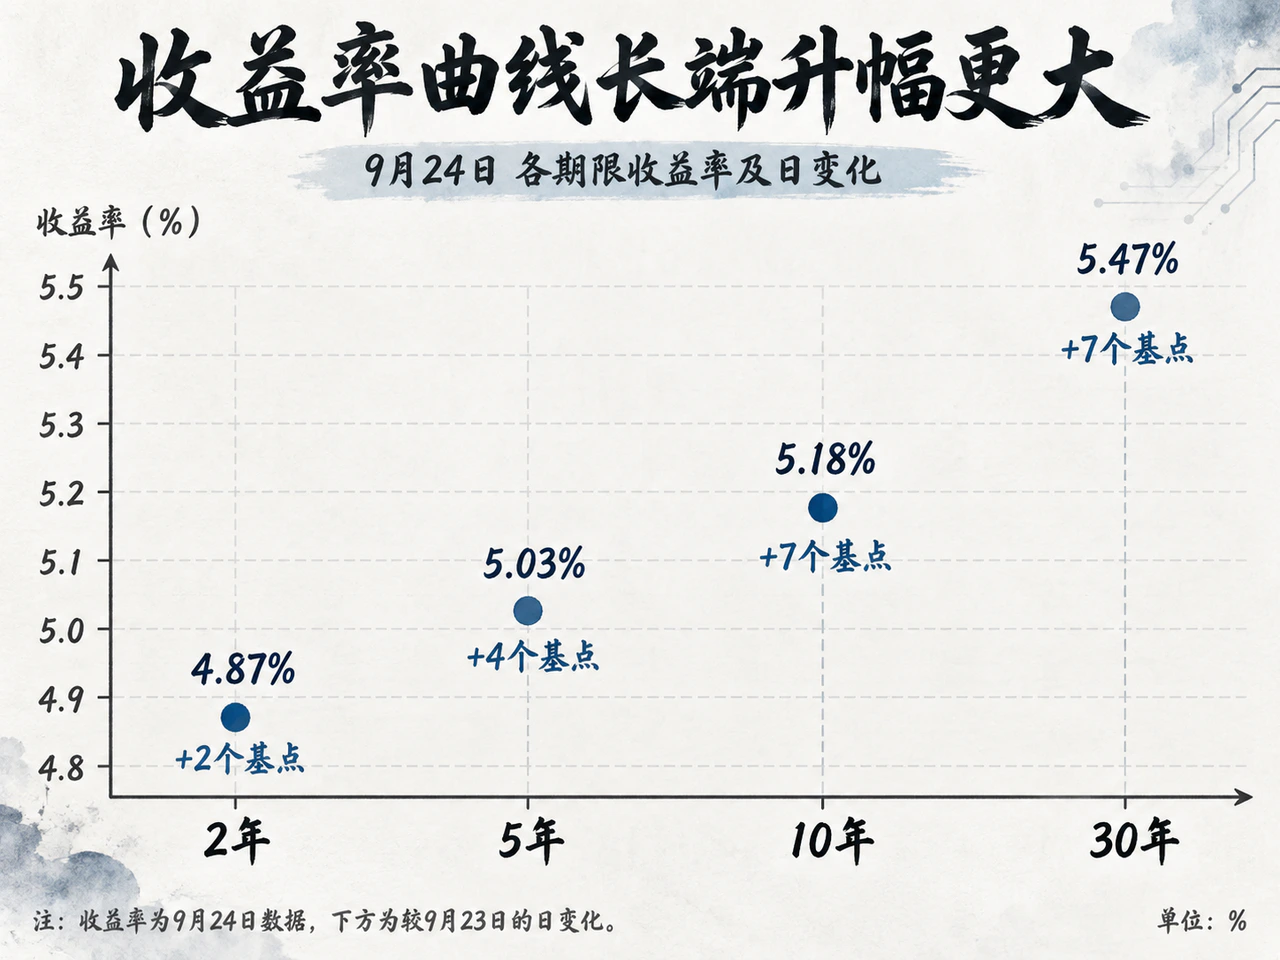
Daily Market Review · September 25, 2026
On September 24, 2026, long Treasury yields and oil rose as U.S. stocks finished narrowly mixed. Low jobless claims and a weak 7-year auction lifted the 10-year yield 7 basis points to 5.18%. Saudi-led missile interceptions raised geopolitical fears, taking Brent above $106 while gold edged lower. Heavyweights obscured broad sector weakness and AI delivery bottlenecks hit hardware. The U.S.-China trade truce was extended and China's central bank emphasized moderate easing.
Read article ↗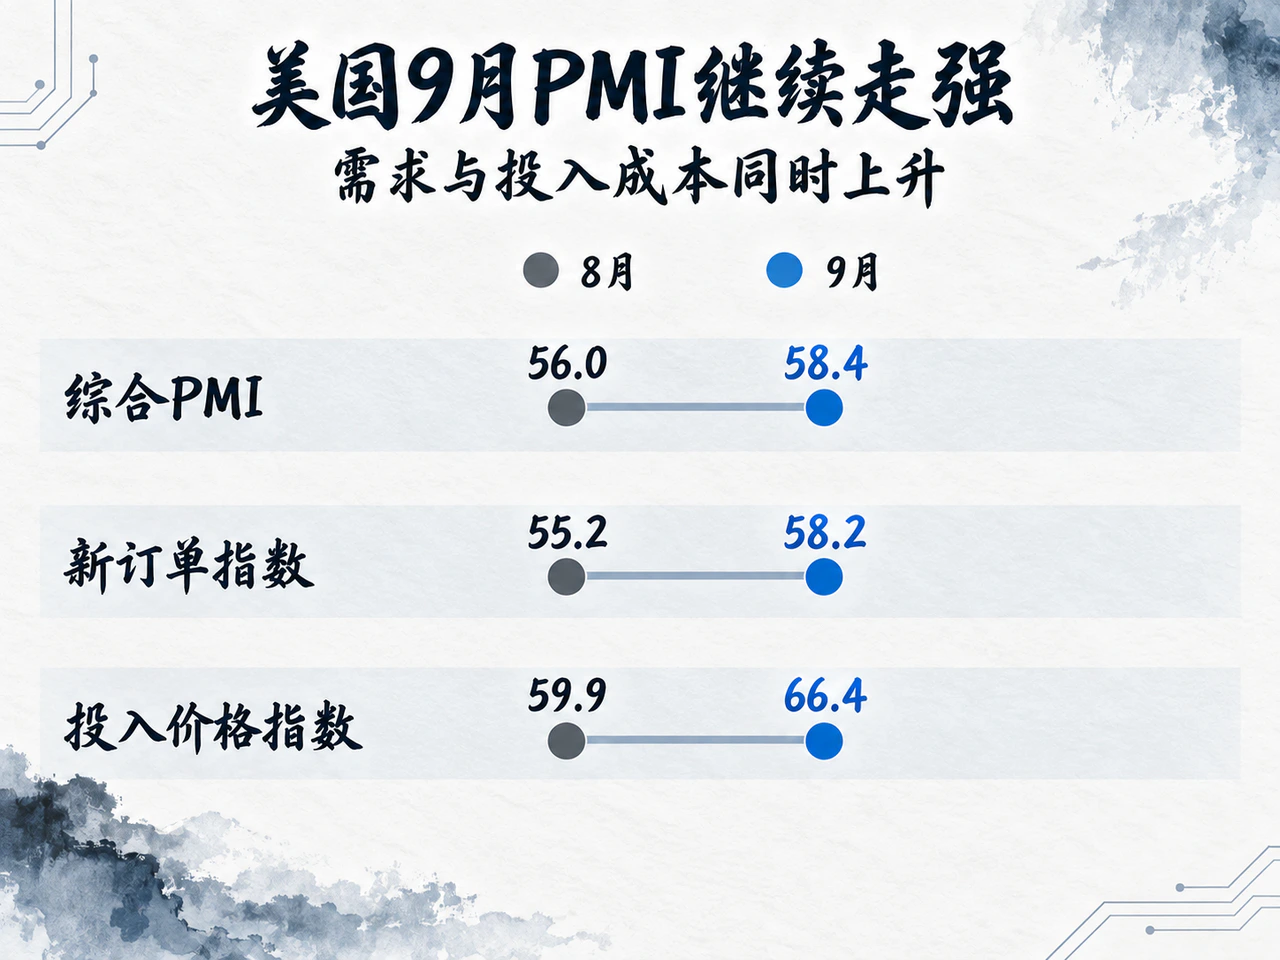
Daily Market Review · September 24, 2026
On September 23, 2026, the preliminary U.S. composite PMI reached a more-than-five-year high. Greater rate-hike expectations lifted Treasury yields across the curve, led by the 5-year. Major U.S. indices fell; energy rose with oil and dollar strength pressured gold. SoftBank completed more than $10 billion of multicurrency financing, while Asian central banks worked to smooth quarter-end funding volatility.
Read article ↗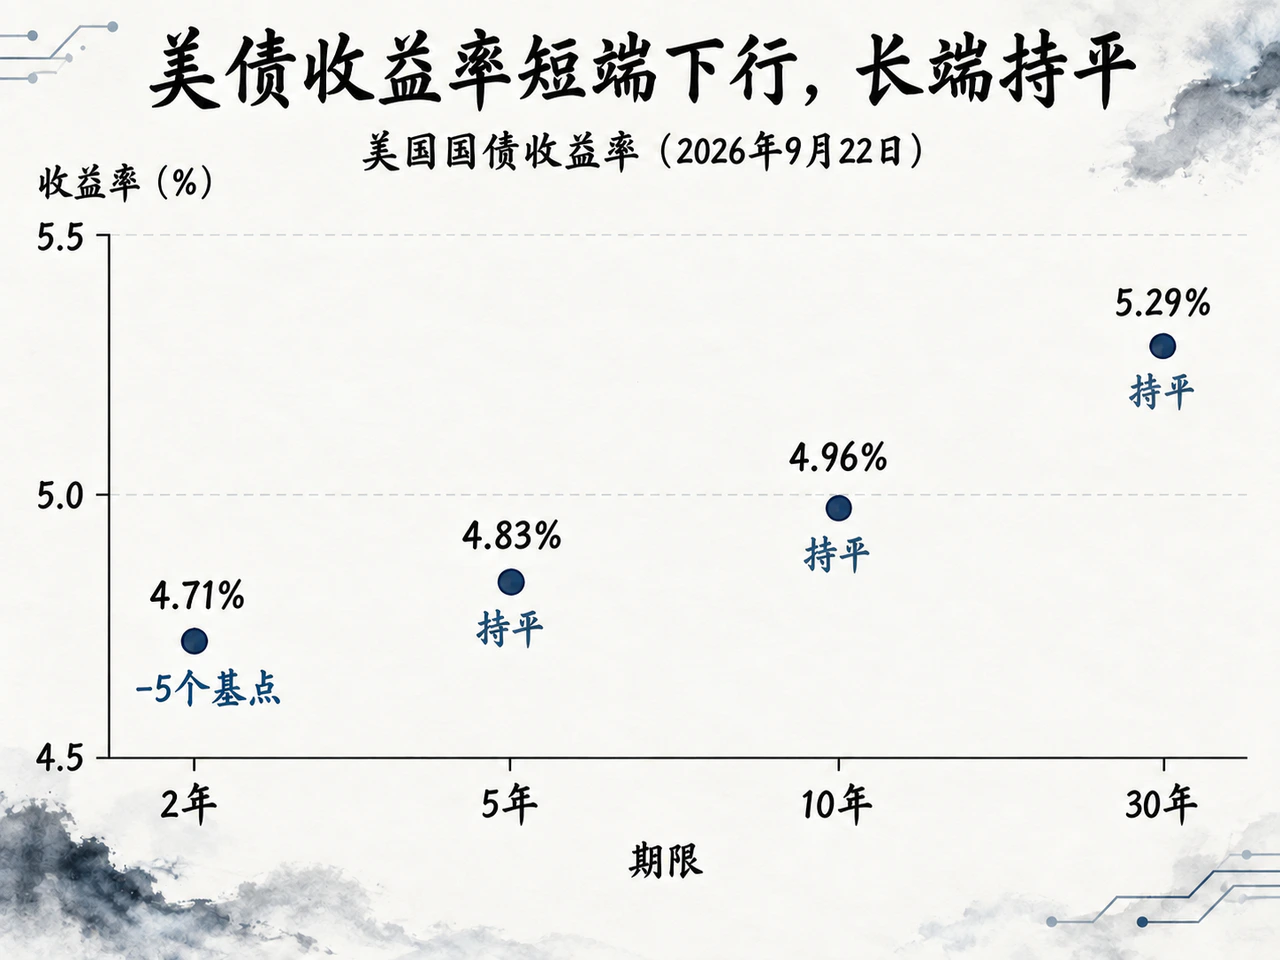
Daily Market Review · September 23, 2026
On September 22, lower oil and short-term Treasury yields brought marginal relief, but long-term benchmarks stayed firm. Meta's AI assistant supported computing hardware while threatening intermediary platforms; expected technology debt issuance widened AI credit premiums. Manufacturing orders and hiring expectations weakened, oil fell while gold held up, and offshore funding and global supply chains remained constrained by rates and tariffs.
Read article ↗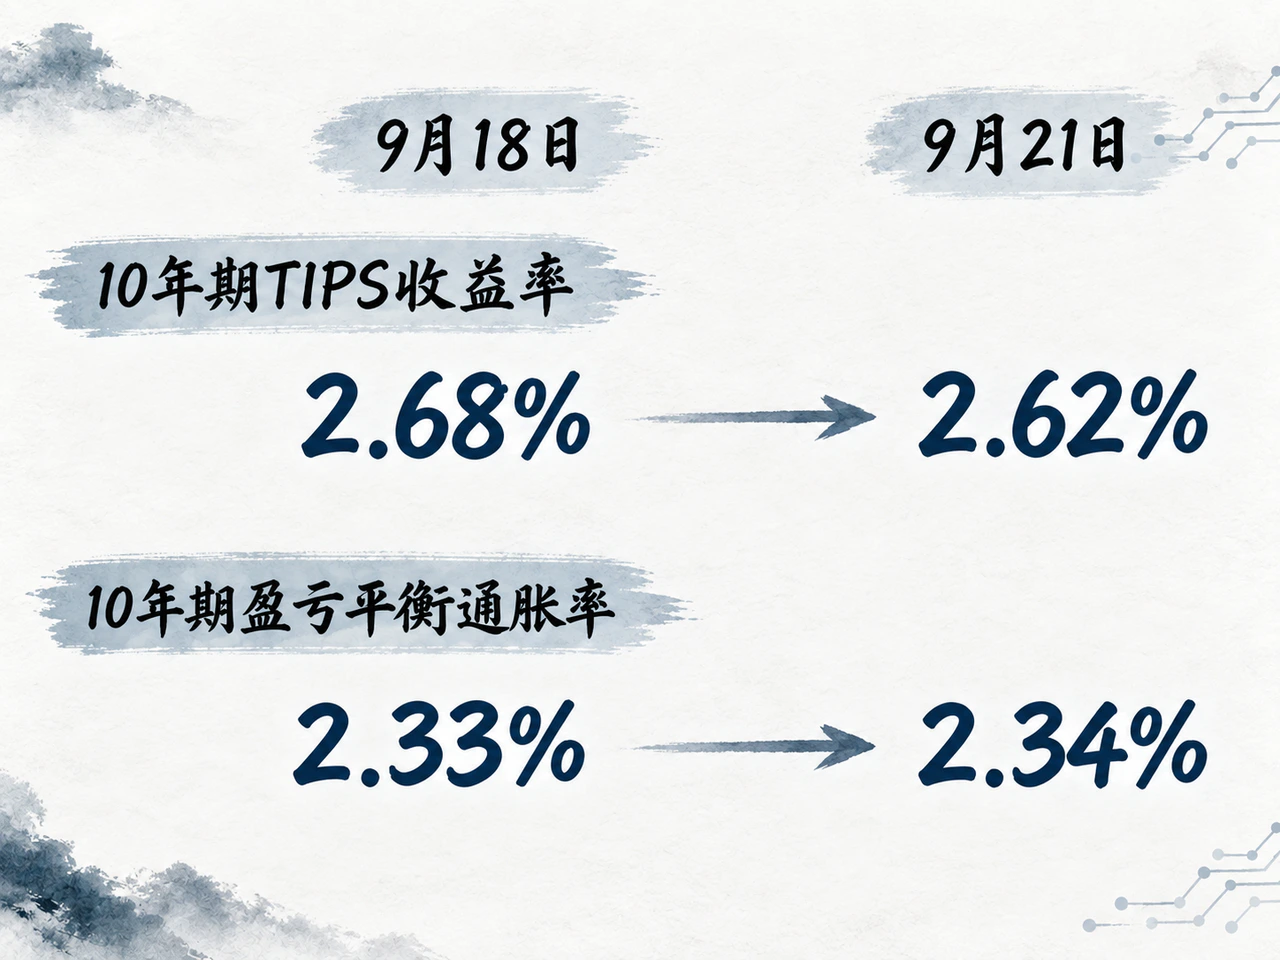
Daily Market Review · September 22, 2026
On September 21, 2026, US technology leaders lift stocks and lower real yields support longer Treasuries. Higher bill-auction discount rates and a stronger dollar show persistent short-term funding constraints. Saudi oil exports pressure crude, while AI investment drives SoftBank's multibillion-dollar bond sale.
Read article ↗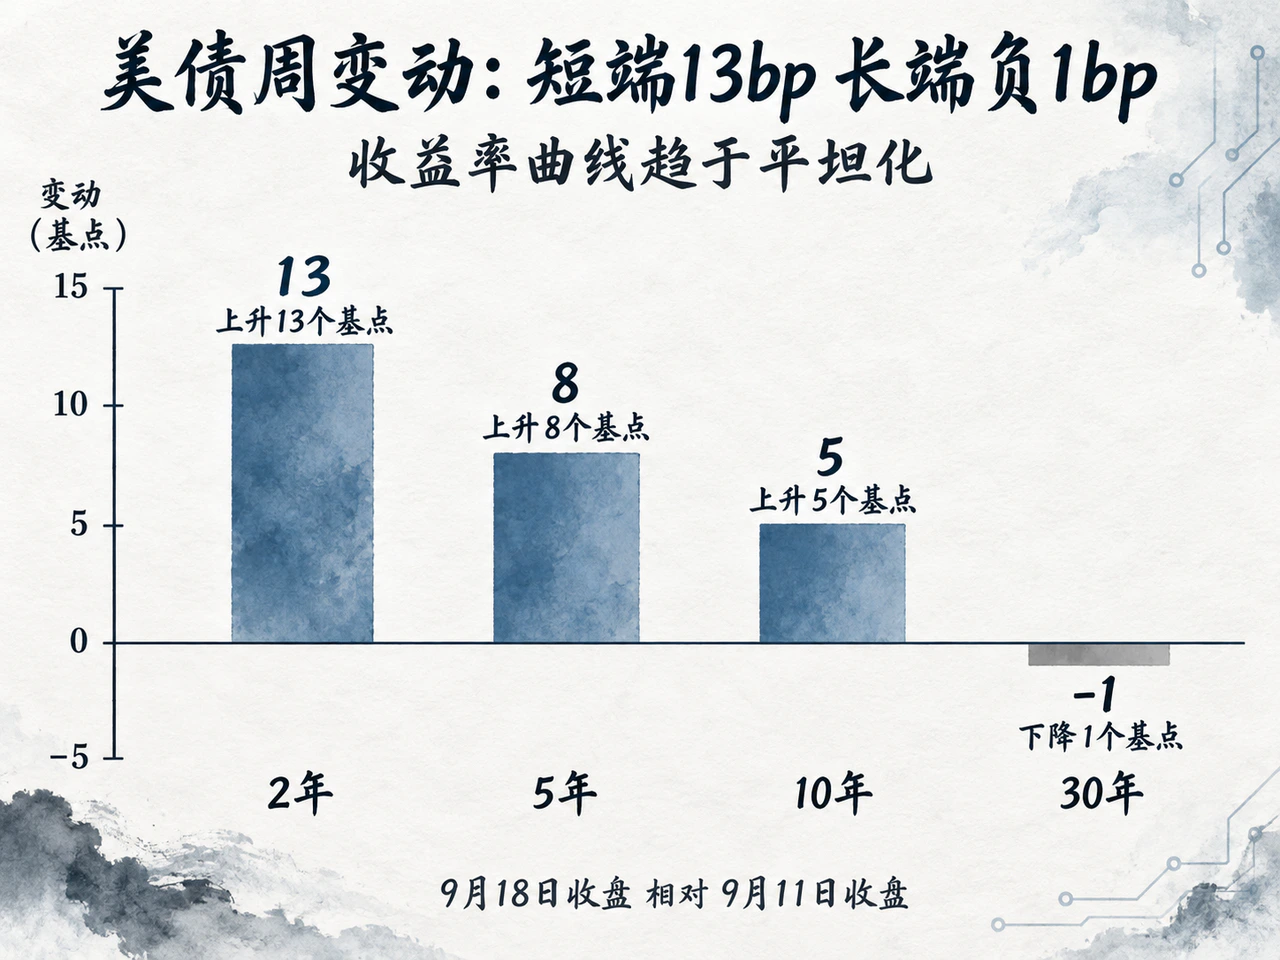
Daily Market Review · September 21, 2026
During September 14–20, a 25-basis-point Fed increase and strong nominal retail sales flattened the Treasury curve and raised real discount rates, pressuring cyclicals and small caps. Power and chip orders helped technology lead. Oil surrendered geopolitical premium, gold rose on short covering, and a post-close sanctions law introduced implementation uncertainty for the next opening.
Read article ↗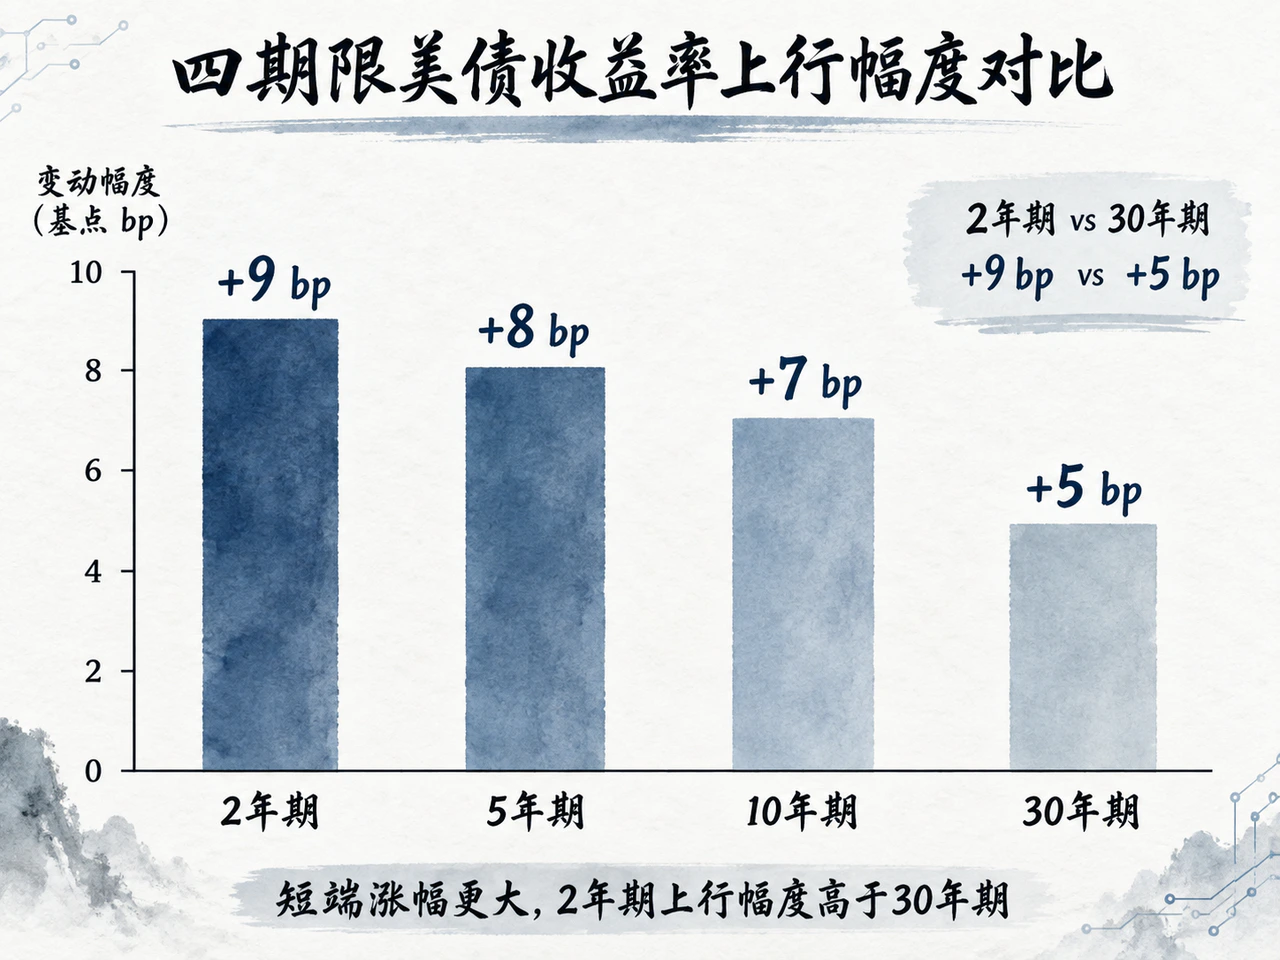
Daily Market Review · September 19, 2026
On September 18, 2026, the Treasury's comparable closing 10-year yield reaches 5.01%, with larger short-end increases flattening the curve. Semiconductors help US benchmarks eke out gains despite most stocks falling. Saudi pipeline repairs ease oil-supply fears, gold edges up but faces high real rates, and China's fiscal and high-tech investment data show structural bright spots.
Read article ↗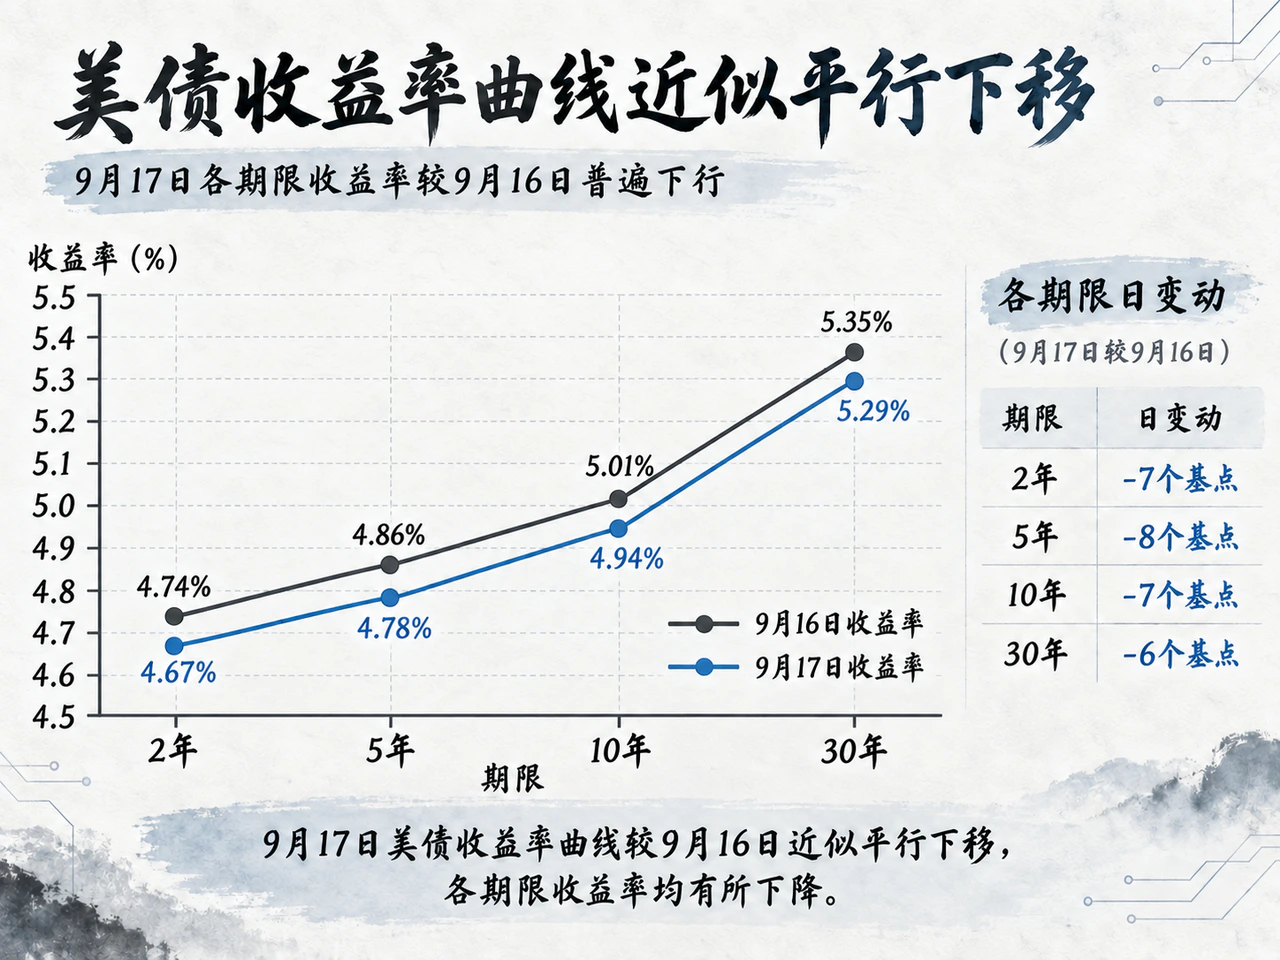
Daily Market Review · September 18, 2026
On September 17, 2026, Saudi supply arrangements eased immediate fears and lowered oil prices, while Treasury yields shifted down by about 7 basis points across maturities. Expectations of large AI supply-chain orders helped the S&P 500 rise 1.14% and Nasdaq 100 gain 1.73%. Low jobless claims and stronger manufacturing price indices nevertheless pointed to persistent inflation. High TIPS real yields and mortgage rates constrained the economy, limiting market breadth, while gold slipped slightly.
Read article ↗
Daily Market Review · September 17, 2026
The Fed unanimously raised rates 25 basis points, while stronger-than-expected August core retail sales helped lift the 2-year Treasury yield to 4.74% and flatten the curve. US indices diverged: chips held up while financials and transport fell. Oil dropped around 3%, gold weakened under higher real yields, and HKMA expanded offshore renminbi liquidity arrangements.
Read article ↗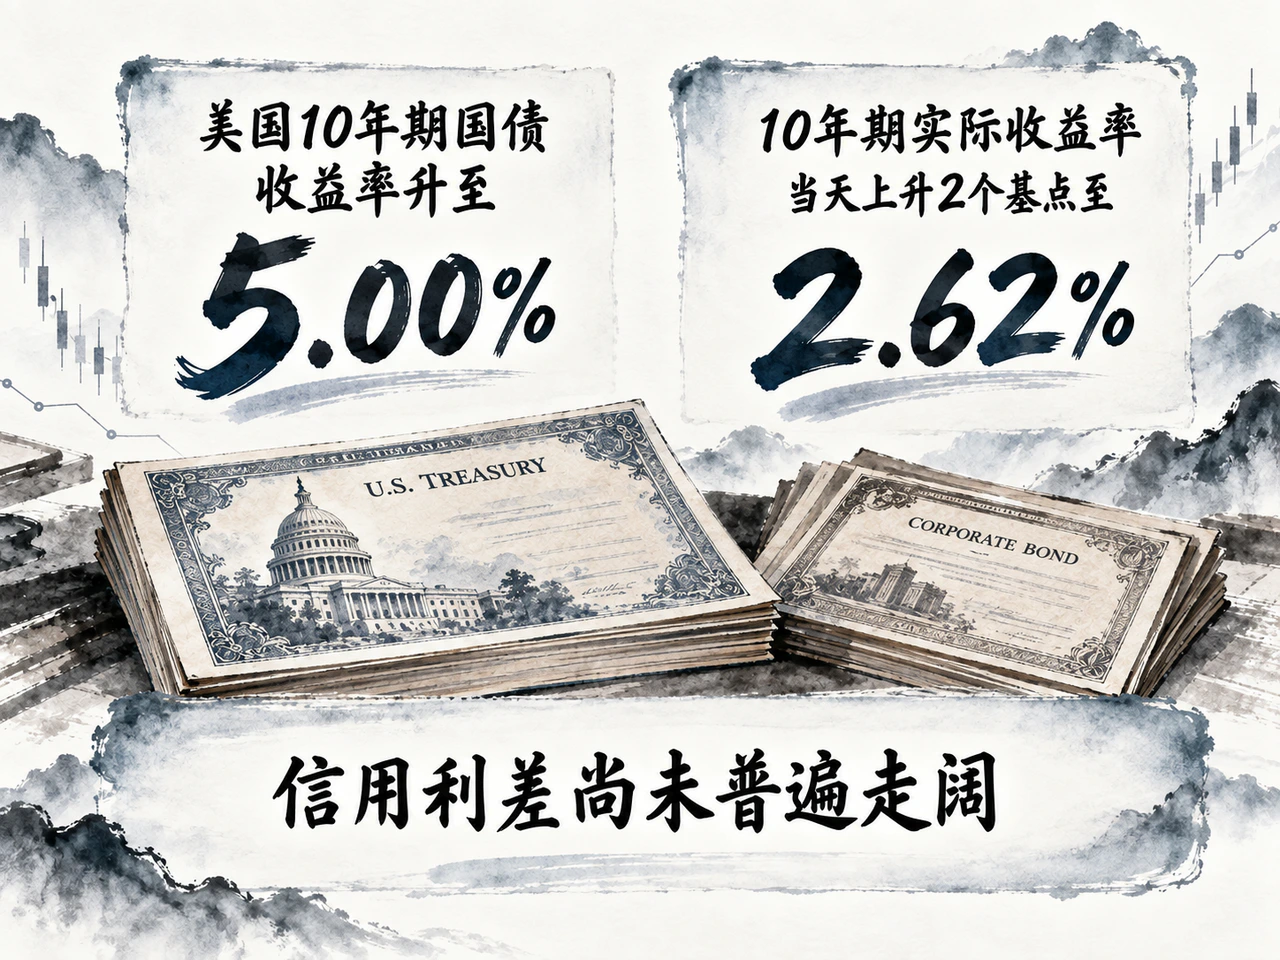
Daily Market Review · September 16, 2026
WTI rose nearly 4% and the ten-year Treasury yield reached 5.00%, while U.S. stocks and gold fell. U.S. manufacturing orders cooled as prices rose; Chinese industrial growth accelerated, but consumption and investment remained weak.
Read article ↗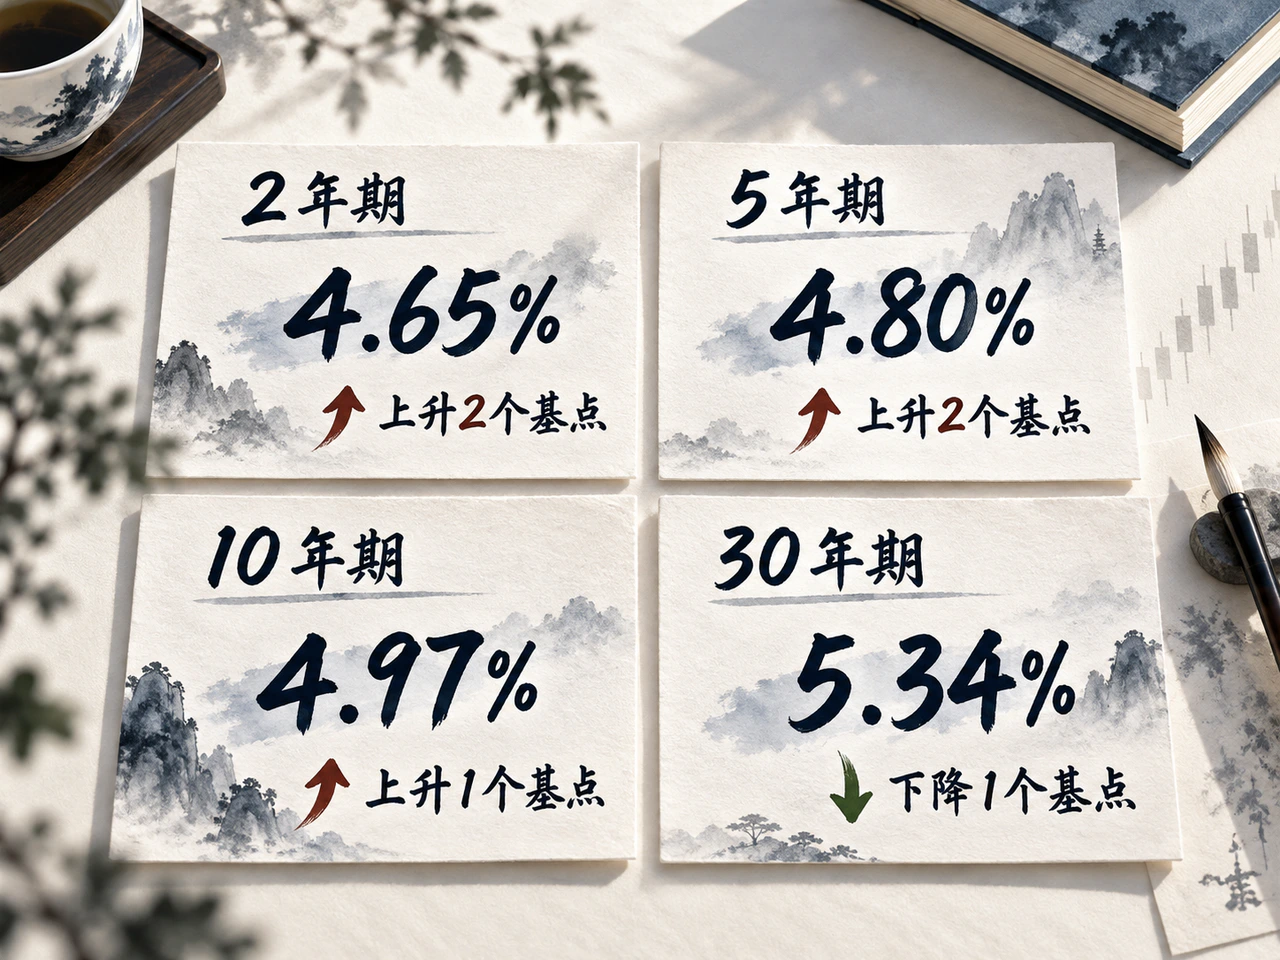
Daily Market Review · September 15, 2026
Oil-supply risks lifted crude while a stronger dollar weighed on gold. The Treasury curve flattened slightly and high rates constrained financing. Calls for slower AI development hurt chips while software rallied; Chinese financial data showed divergent household and business borrowing demand.
Read article ↗
Daily Market Review · September 14, 2026
September 7–13 energy gains reinforced hike expectations, lifted short/intermediate Treasury yields and left US equities lower. Stable credit spreads and growing AI orders offered selective support as supply constraints met slower demand.
Read article ↗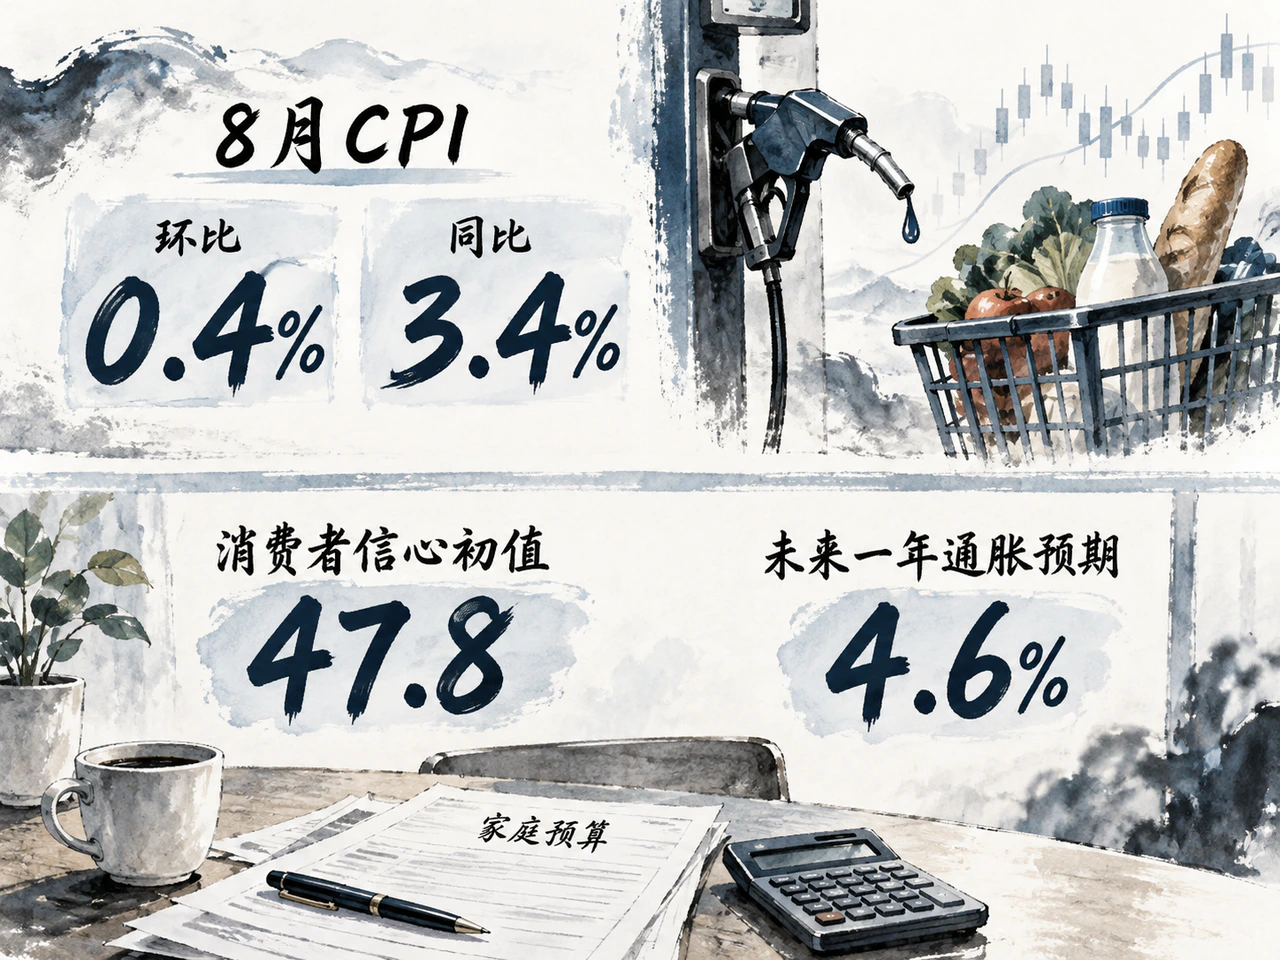
Daily Market Review · September 13, 2026
U.S. stocks rebounded on September 11, supported by in-line inflation, lower oil and growing AI orders, but short Treasury yields and real rates continued to rise. Purchasing power, corporate financing and energy supply remained constrained. The speed at which orders become cash returns will affect the durability of the recovery.
Read article ↗
Daily Market Review · September 12, 2026
Lower oil and strong technology earnings lifted U.S. stocks, but core monthly inflation exceeded expectations and short Treasury yields kept rising. Tight energy supply, fiscal funding needs and corporate capital expenditure continued constraining the recovery.
Read article ↗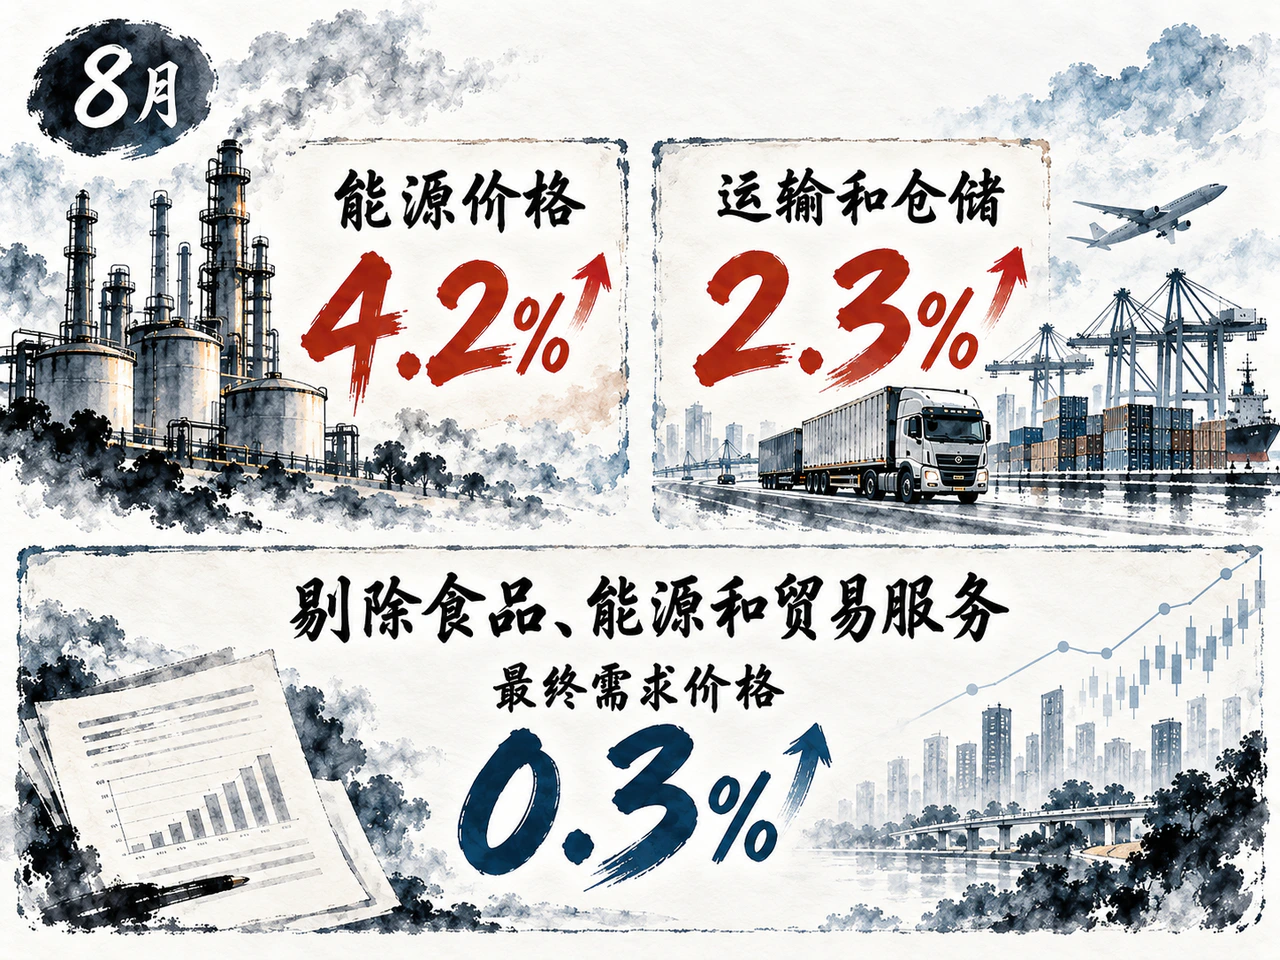
Daily Market Review · September 11, 2026
Surging oil revived inflation concerns, lifting Treasury yields and hurting technology and small caps. Underlying service prices remained mixed; Oracle's cloud growth supported earnings expectations ahead of August CPI.
Read article ↗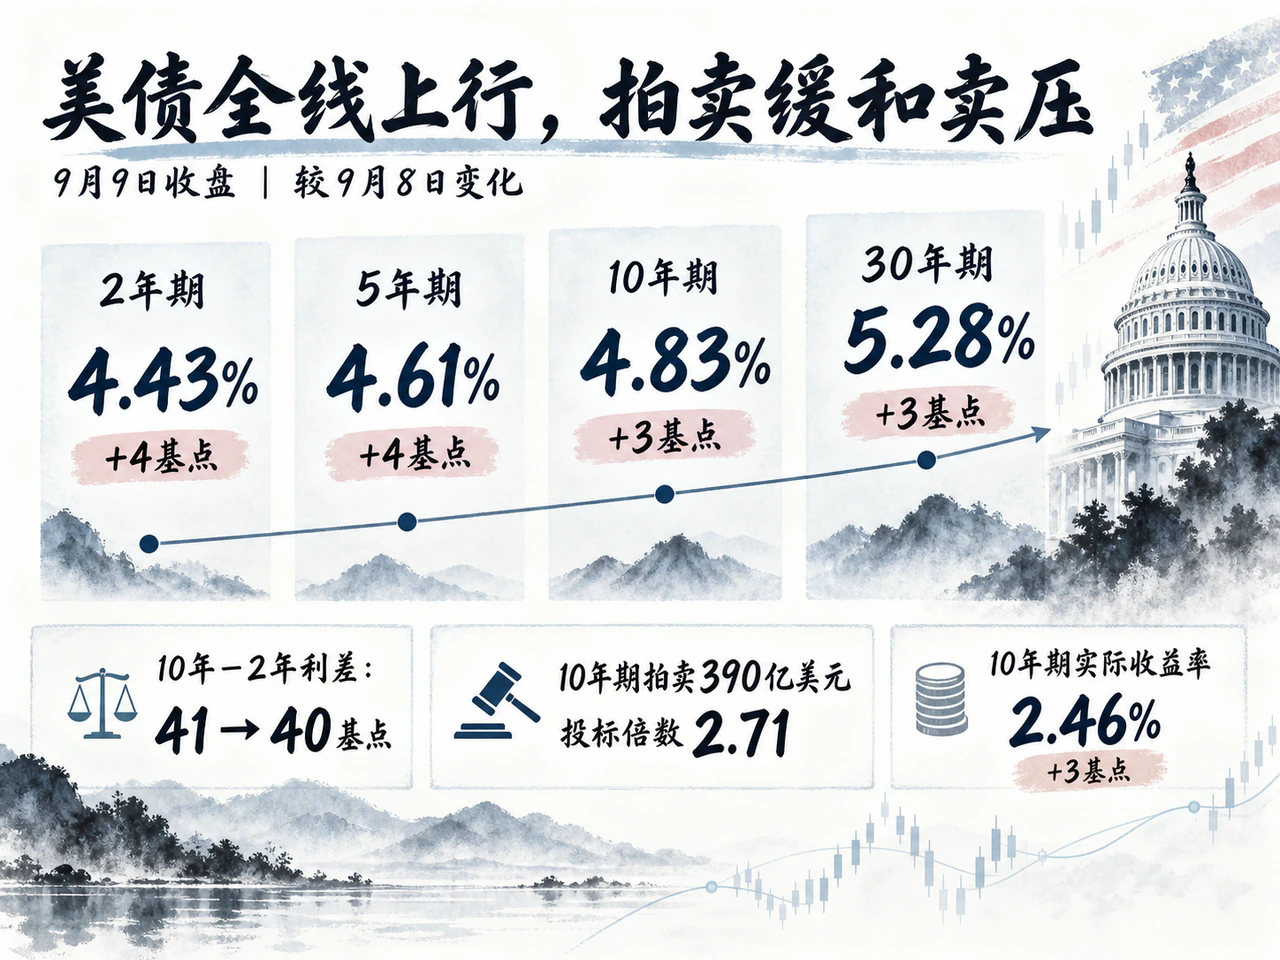
Daily Market Review · September 10, 2026
Brent returns above $100, Treasury yields rise across the curve and US stock indices fall. Energy and high rates squeeze demand, while a strong Treasury auction and technology launches provide selective support. US inflation releases are key before next week's rate meeting.
Read article ↗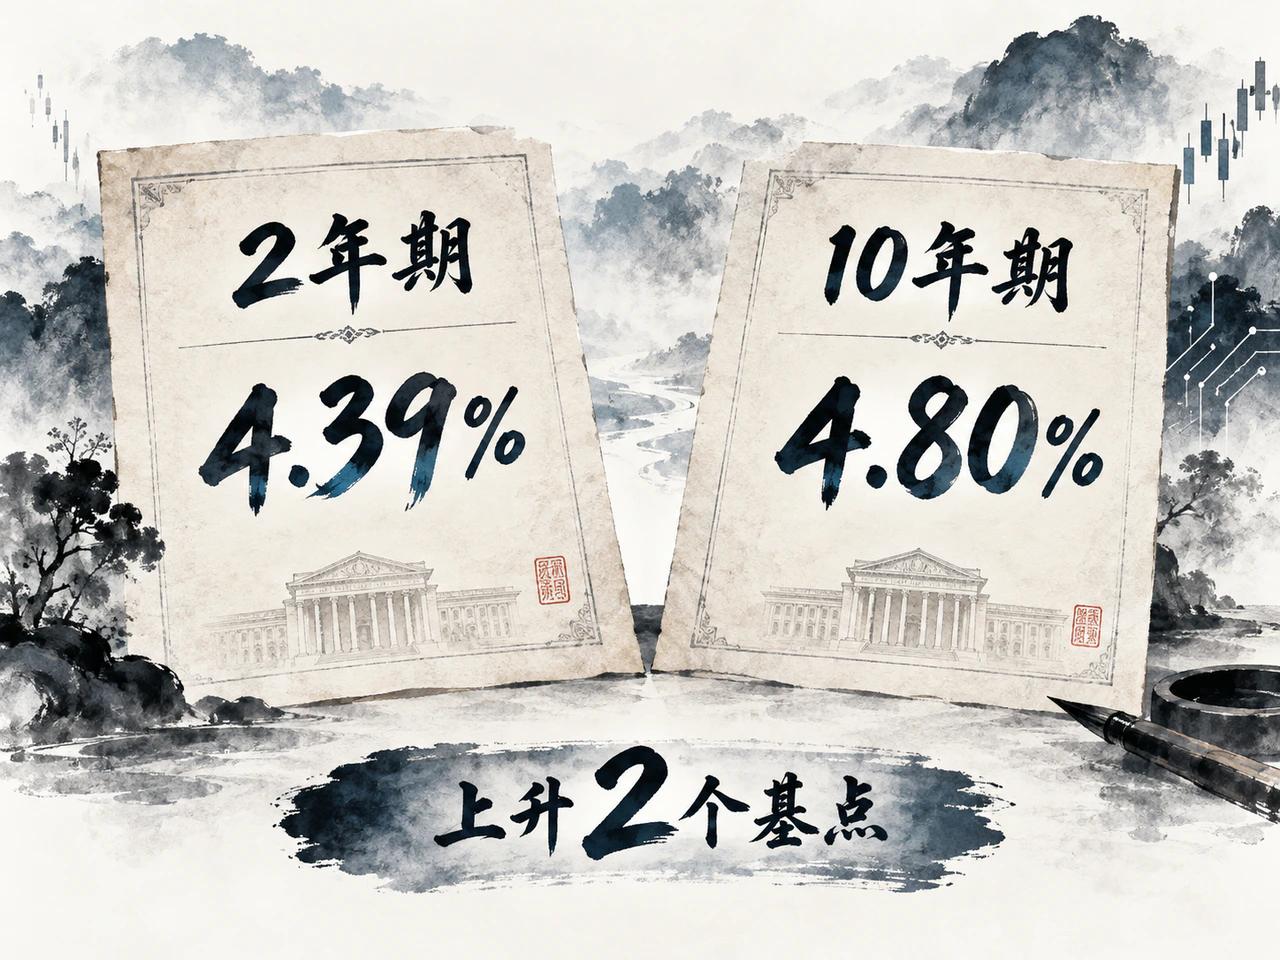
Daily Market Review · September 9, 2026
Oil and Treasury yields rose as major US indices declined. Weaker employment confidence and greater debt-service pressure complicated growth risks while inflation limited policy room. Energy and technology were relatively resilient, with earnings continuing to diverge.
Read article ↗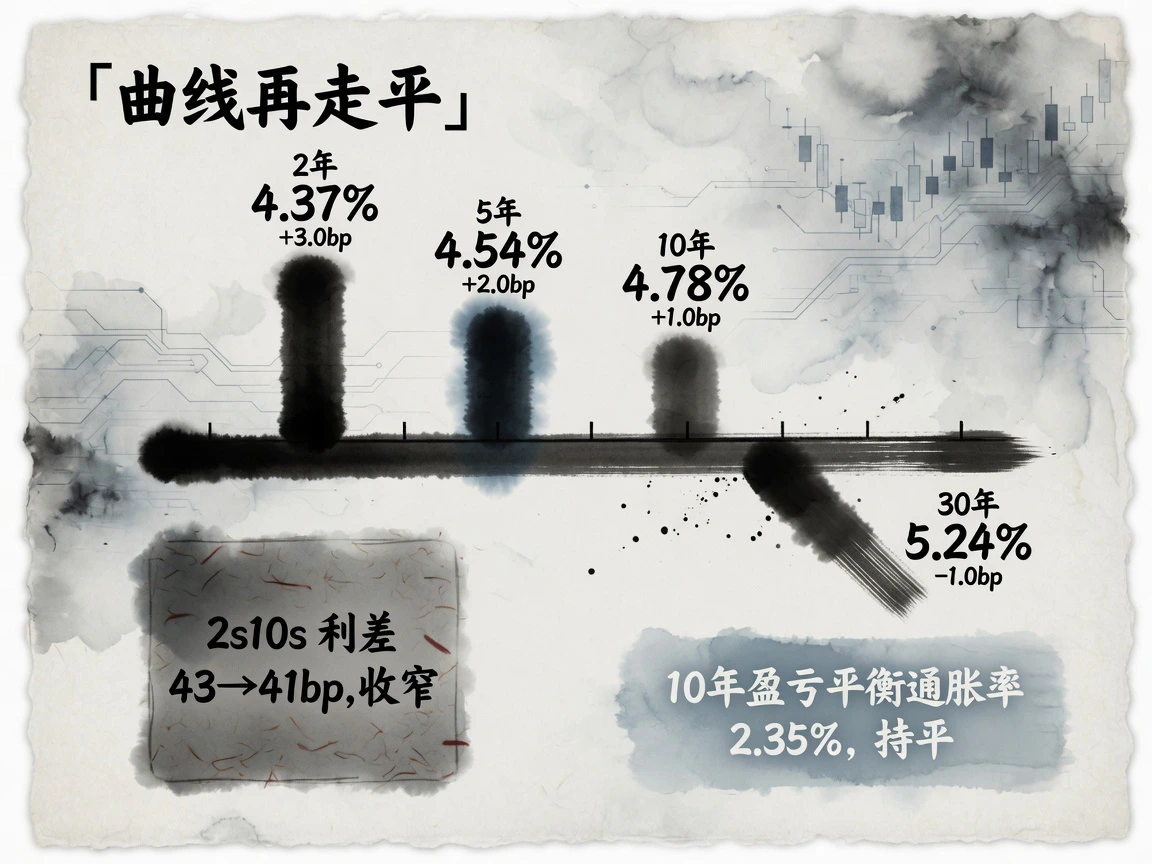
Daily Market Review · September 7, 2026
Payrolls strengthen September hike expectations and flatten Treasuries again. Jobs, inflation and energy costs will jointly shape premeeting judgments.
Read article ↗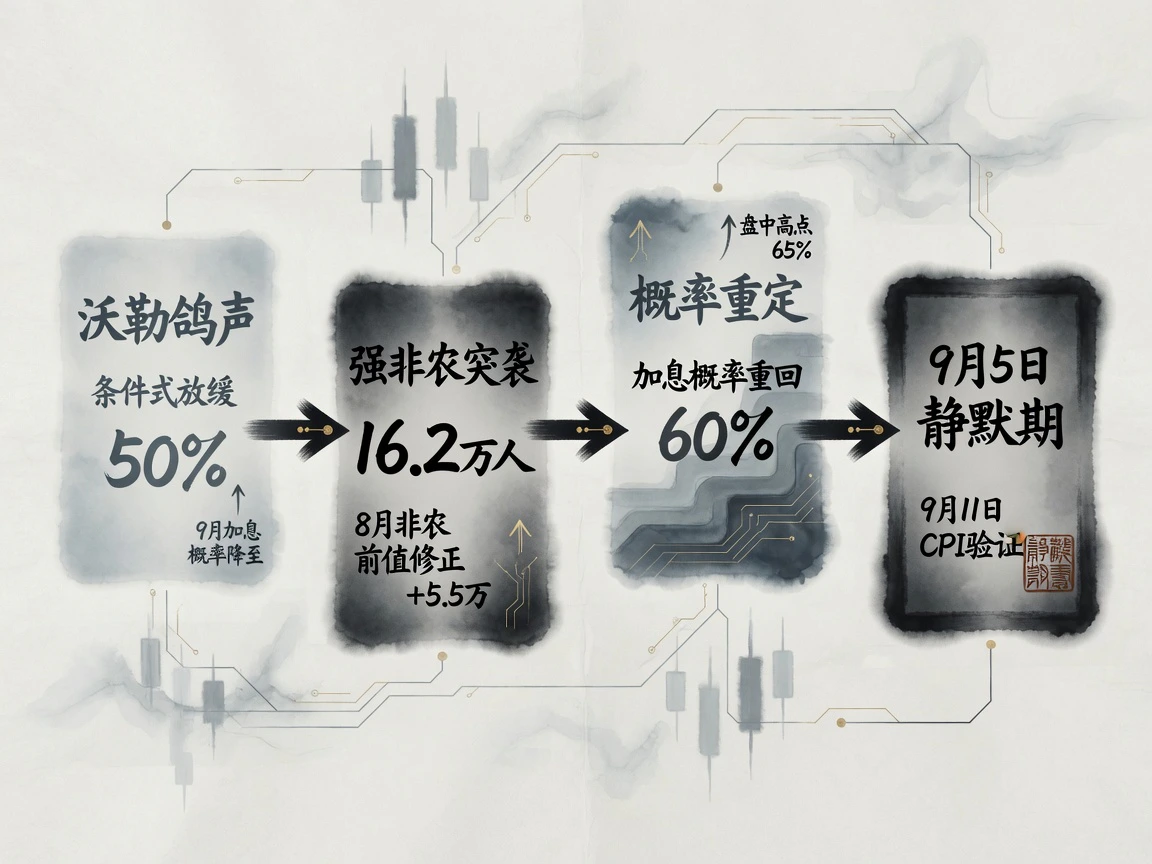
Daily Market Review · September 5, 2026
On September 4, rate expectations completed a two-day reversal. Waller's conditional dovish remarks had cut September hike odds to 50% and lifted stocks, bonds and gold; August payroll growth of 162,000, almost three times forecasts, then changed the picture.
Read article ↗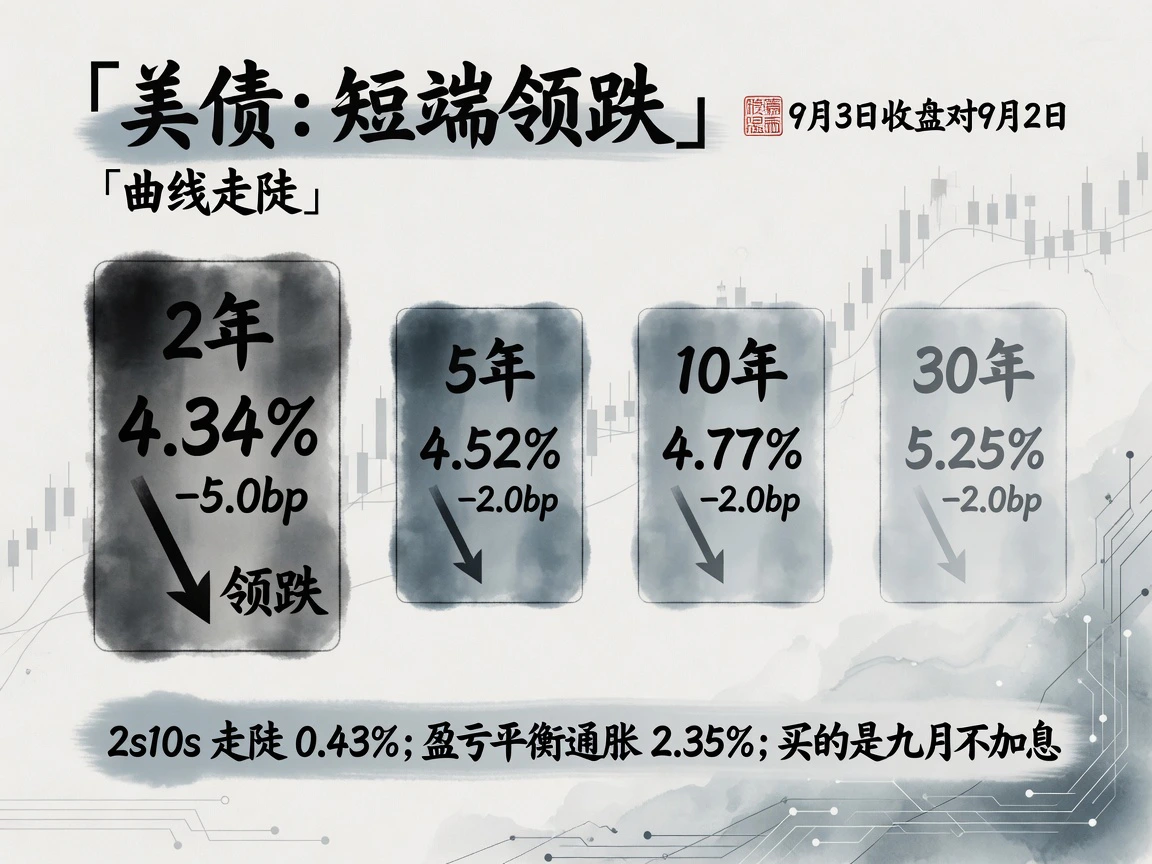
Daily Market Review · September 4, 2026
On September 3, 2026, markets focused on whether the Fed would hike on September 15–16. Waller offered a clear conditional view: if the next two weeks continued July's disinflation, he favored holding to give disinflation a chance and waiting another meeting.
Read article ↗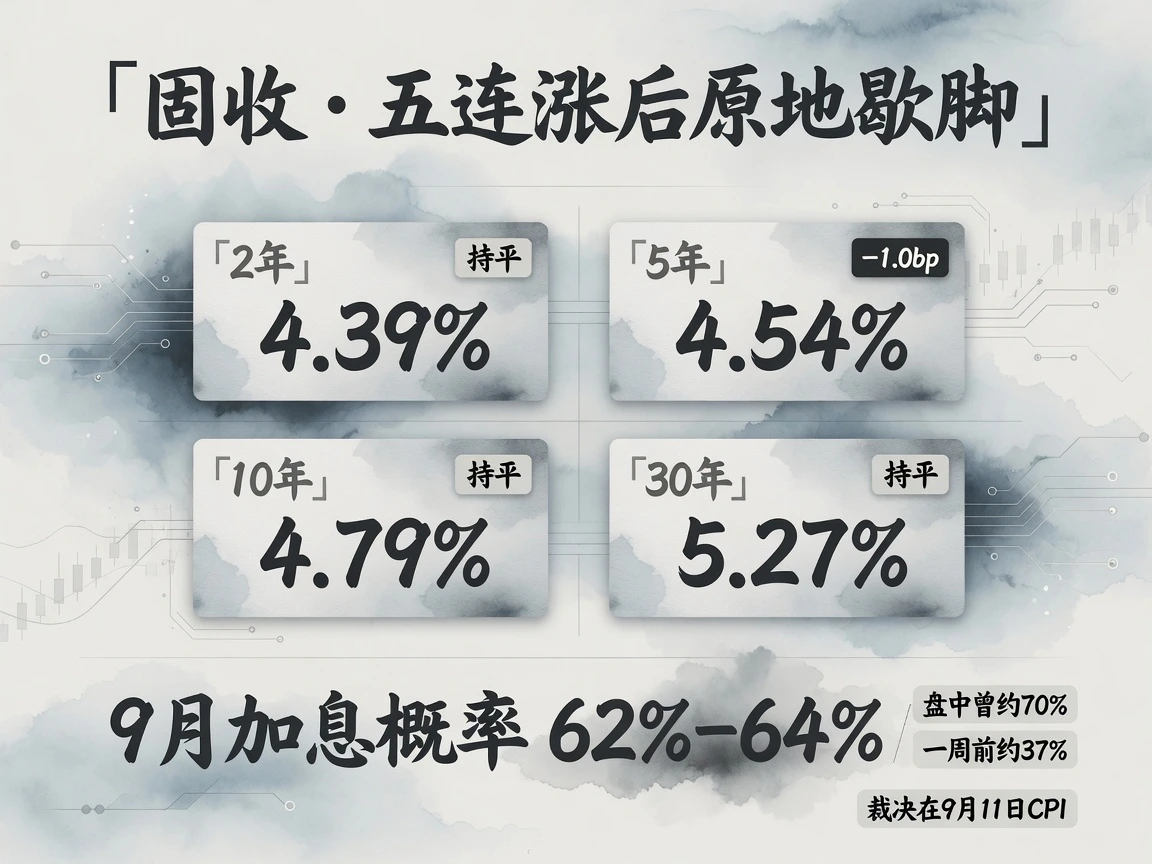
Daily Market Review · September 3, 2026
On September 2, Treasury yields paused after several days of increases, while softer ADP jobs and balanced Fed communication reduced September hike odds from roughly 70% intraday to 62%–64%. U.S. equities and gold recovered, and a sharp yen rally added a new variable for carry trades and global liquidity.
Read article ↗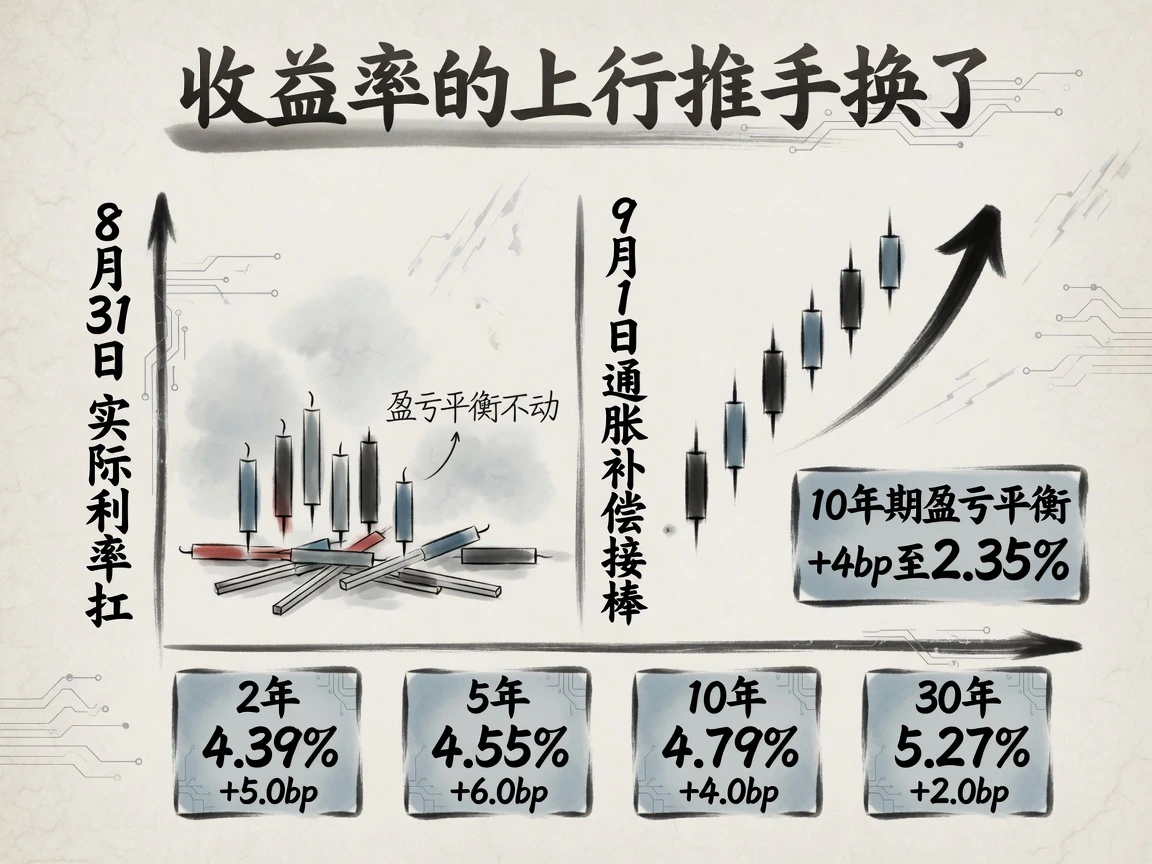
Daily Market Review · September 2, 2026
On September 1, 2026, softer data, sticky prices, hawkish Fed communication and higher oil converged. September hike odds reached around two-thirds and Treasury yields rose for a fifth session. A 4 basis-point rise in 10-year breakevens shifted the driver of nominal yields from real rates to inflation compensation.
Read article ↗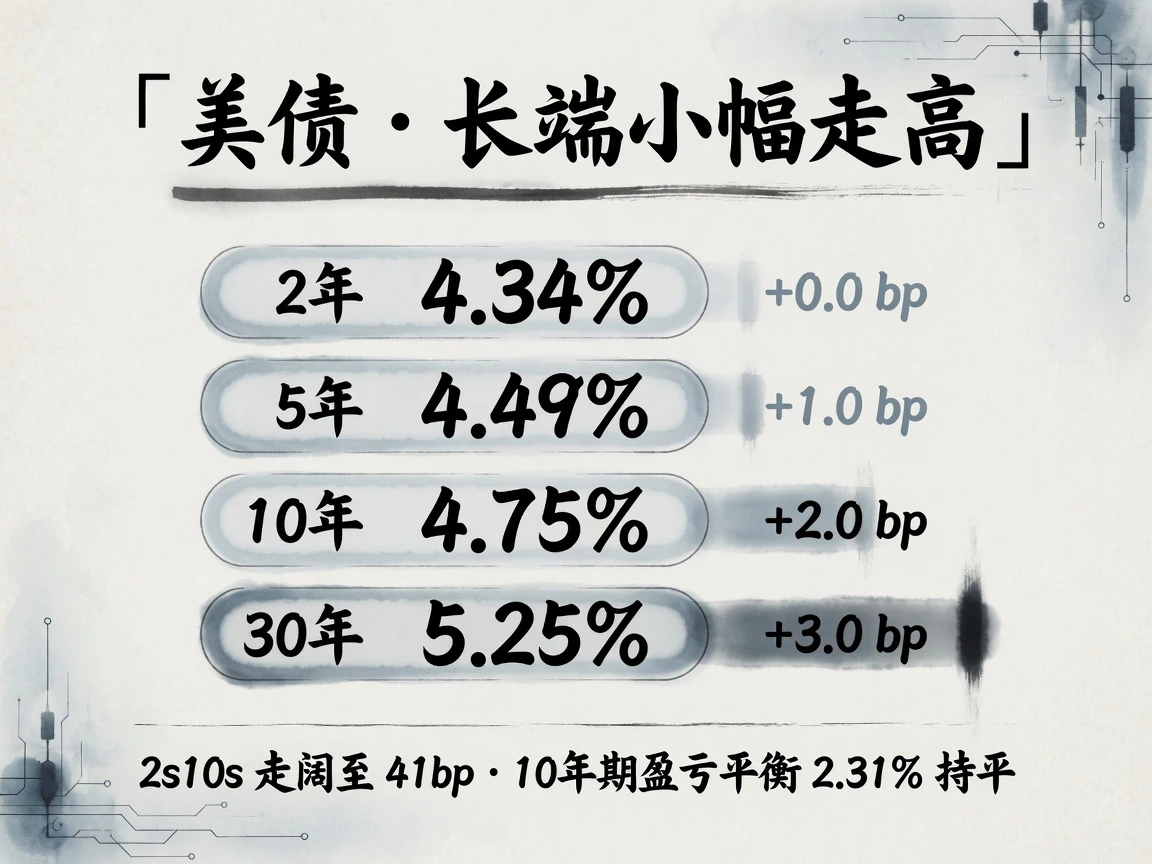
Daily Market Review · September 1, 2026
On August 31, 2026, renewed US-Iran fighting overlapped with hawkish repricing after Jackson Hole. Markets traded the geopolitics–oil–hikes chain in a measured way: the 2-year Treasury held 4.34%, the 10-year rose 2 basis points to 4.75%, and the 30-year rose 3 to 5.25%…
Read article ↗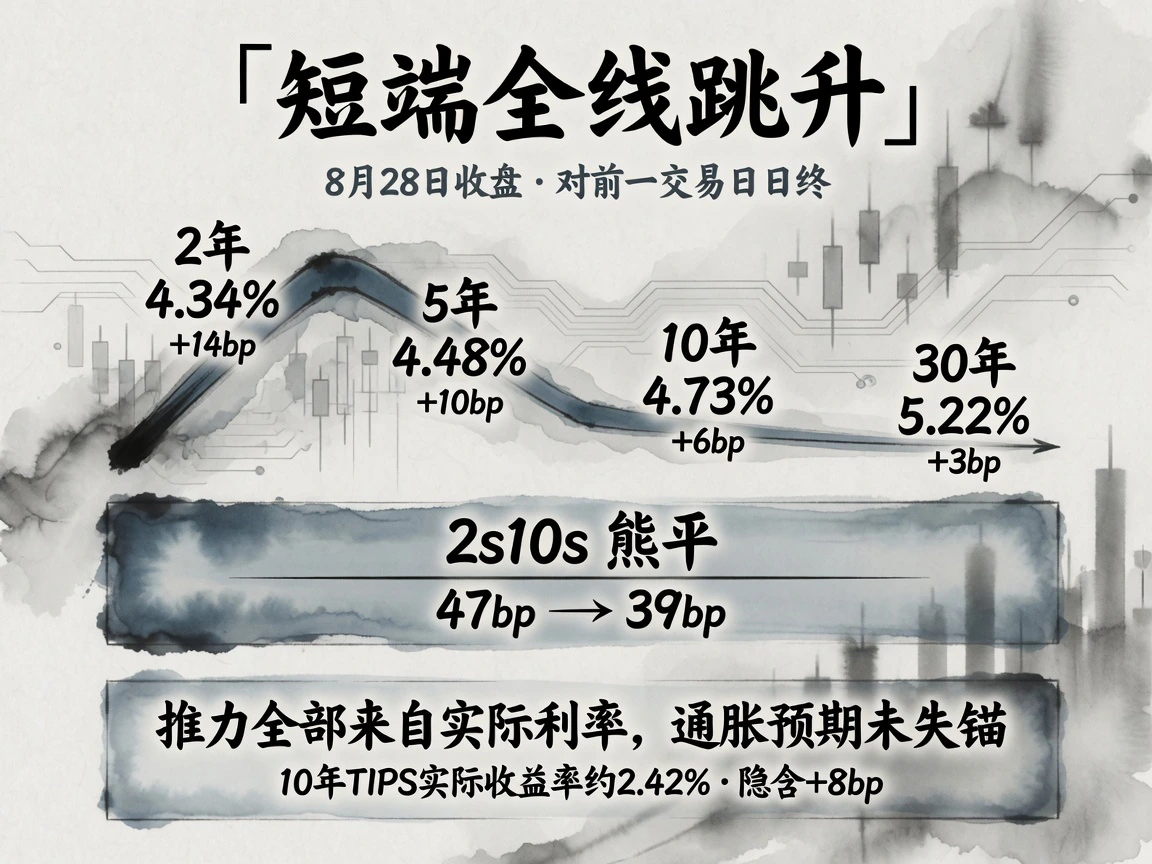
Daily Market Review · August 30, 2026
On August 28, 2026, Chair Warsh's first Jackson Hole keynote made September policy a data question. Hike pricing rose from about 35% to 55%–58%, exceeding hold odds for the first time since late July, as 2-year Treasury yields surged…
Read article ↗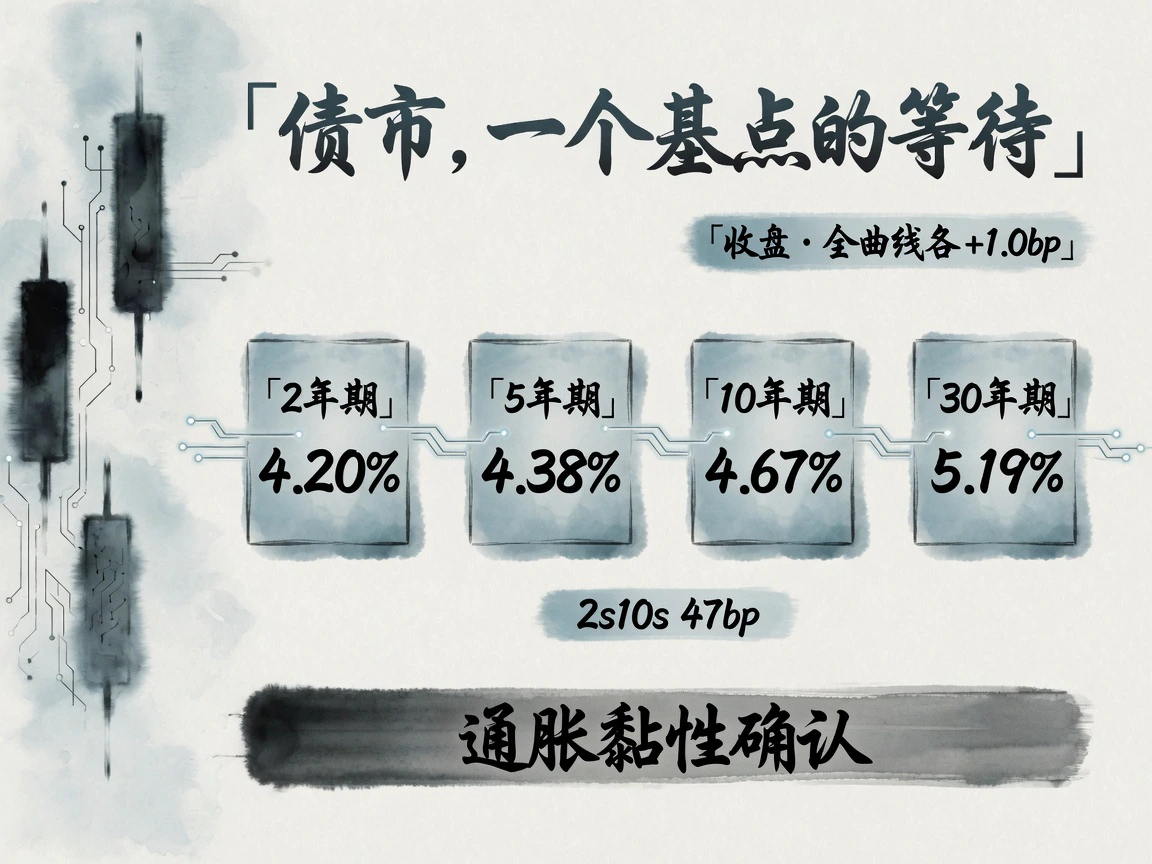
Daily Market Review · August 28, 2026
On August 27, the opening day of Jackson Hole, four regional Fed presidents delivered unusually concentrated hawkish comments. Treasury yields rose just one basis point across maturities, while September-hike pricing declined. Separate drivers were Washington's rejection of a return to the June memorandum framework and Nvidia-led technology strength.
Read article ↗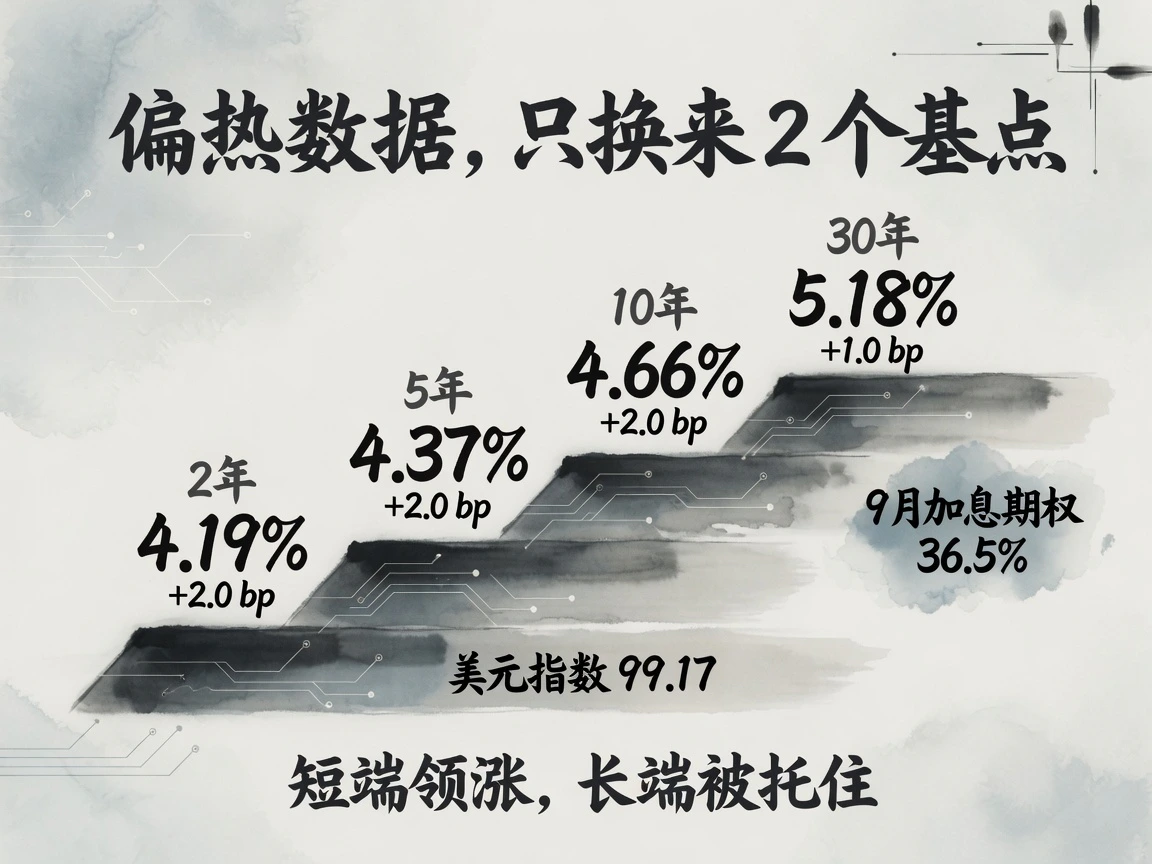
Daily Market Review · August 27, 2026
On August 26, 2026, data, earnings and geopolitics each delivered only a partial market narrative. July headline PCE was warmer at +0.2% month on month versus +0.1% expected, but core matched expectations. Markets treated it as noise: 2-year and 10-year Treasury yields each rose 2 basis points.
Read article ↗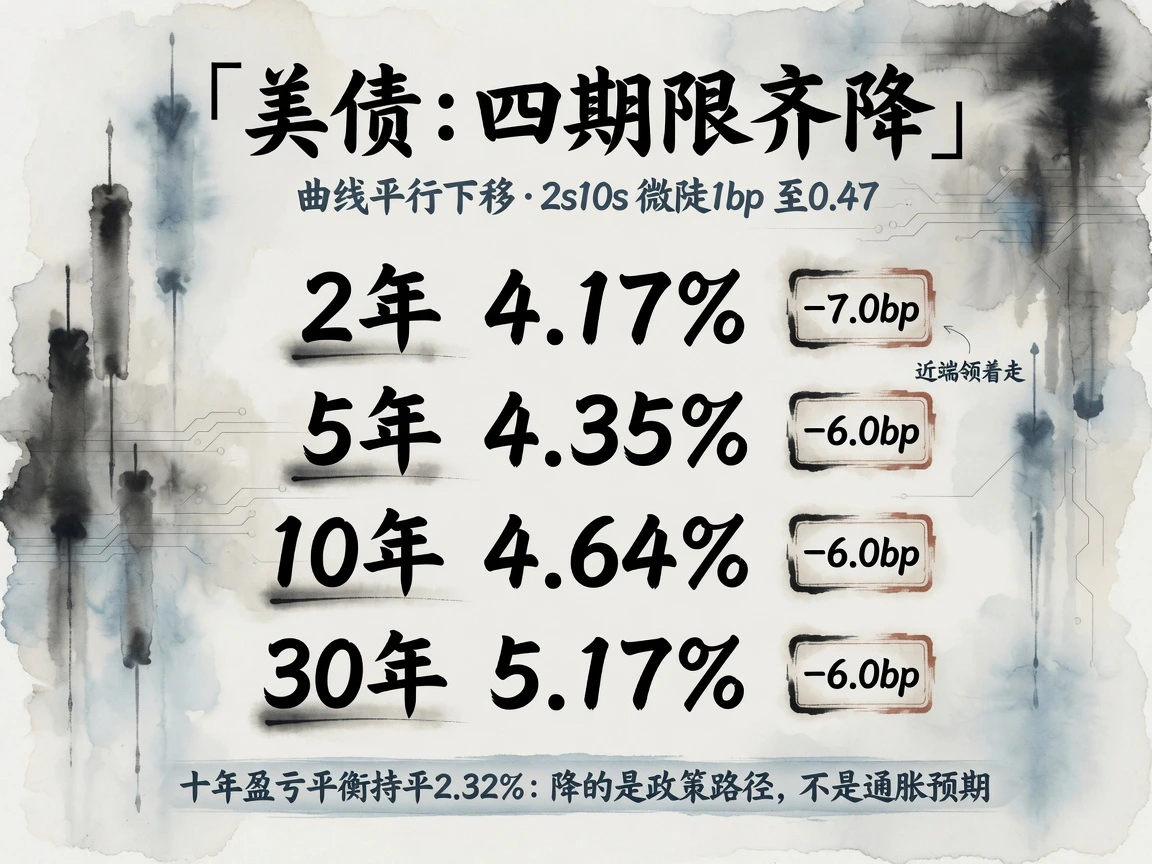
Daily Market Review · August 26, 2026
On August 25, 2026, falling oil, weaker consumer expectations and new-home sales, and Fed officials' conditional rate views drew markets toward a cooling-growth narrative. Treasury yields fell across maturities, but stable inflation compensation and continued hike pricing showed that further tightening risk had not disappeared.
Read article ↗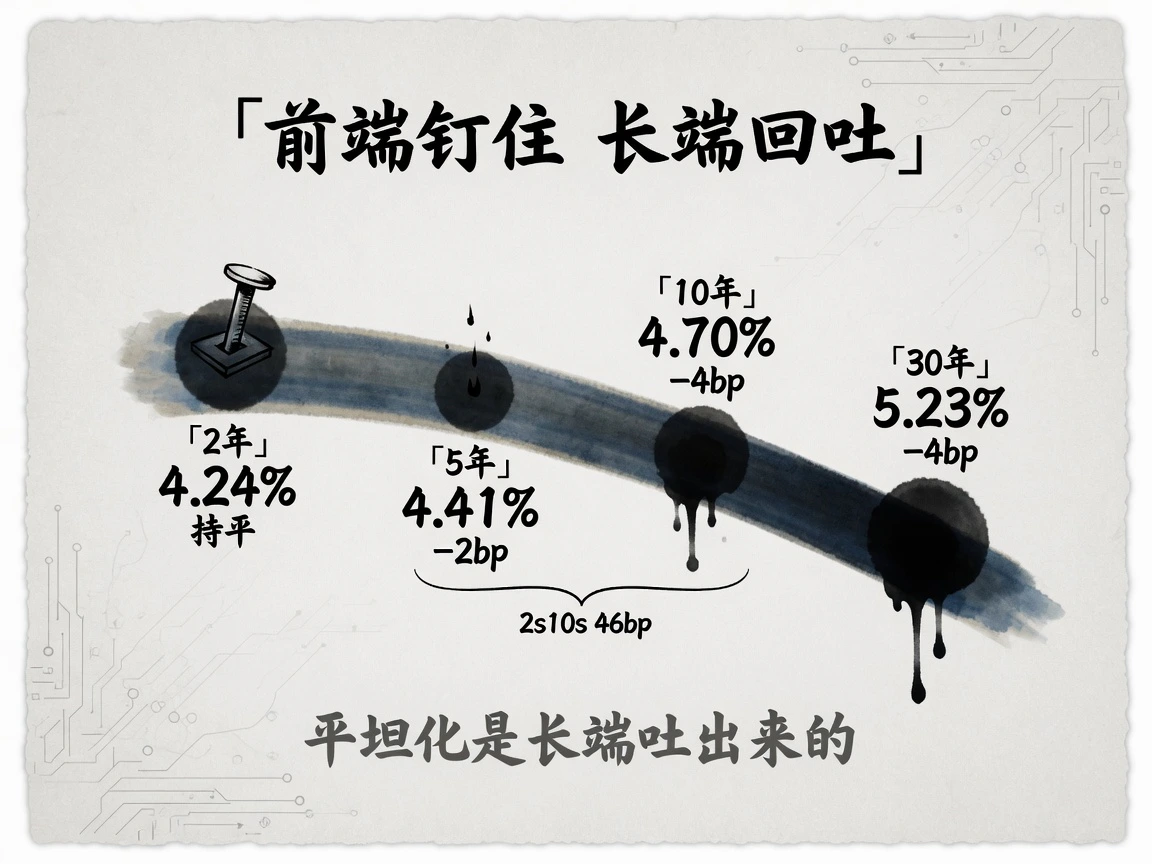
Daily Market Review · August 25, 2026
On August 24, 2026, the US yield curve's previous parallel rise broke apart: the short end held while long yields reversed Friday's increase. Markets repriced whether Treasury cash could actually restrain the long end, assigning option value to TGA-funded buybacks without treating them as implemented.
Read article ↗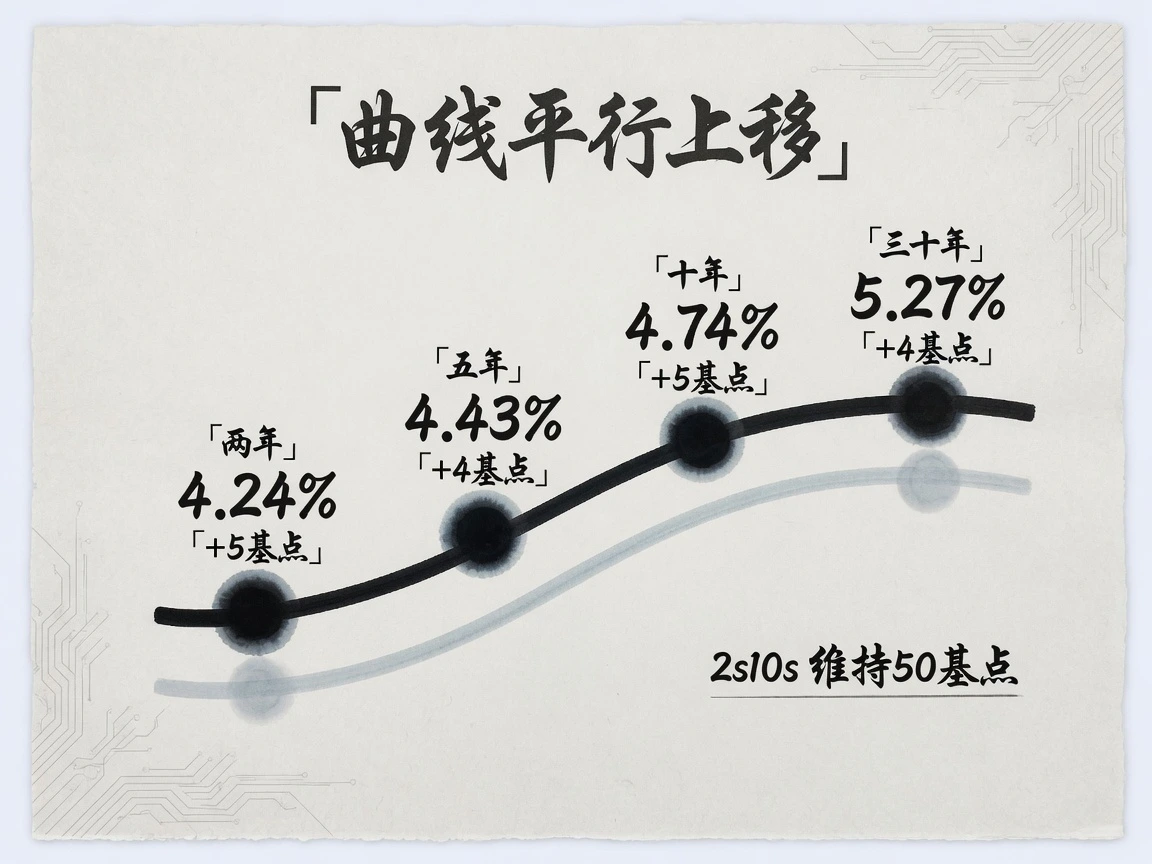
Daily Market Review · August 24, 2026
At the August 21 close, two- and ten-year Treasury yields rose five basis points to 4.24% and 4.74%, yet S&P 500 gained 0.43% and gold about 2.4% as the dollar index slipped only 0.10%. The combination defies a simple rate-hike explanation.
Read article ↗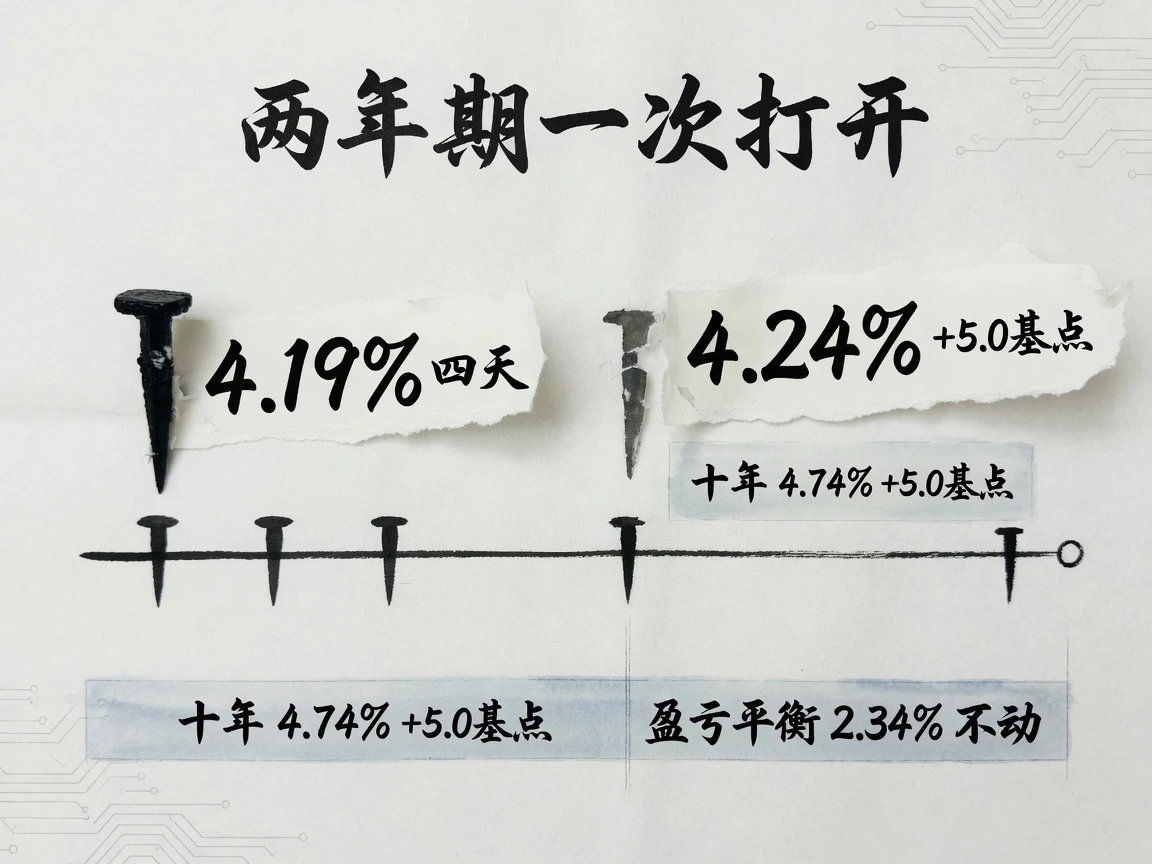
Daily Market Review · August 22, 2026
On August 21, 2026, US markets compress two opposing messages into one session: strong flash PMI suggests near-3% annualized third-quarter growth and lifts the two-year yield by 5 basis points, while Treasury's expanded long-bond buybacks deliver only short-lived yield relief…
Read article ↗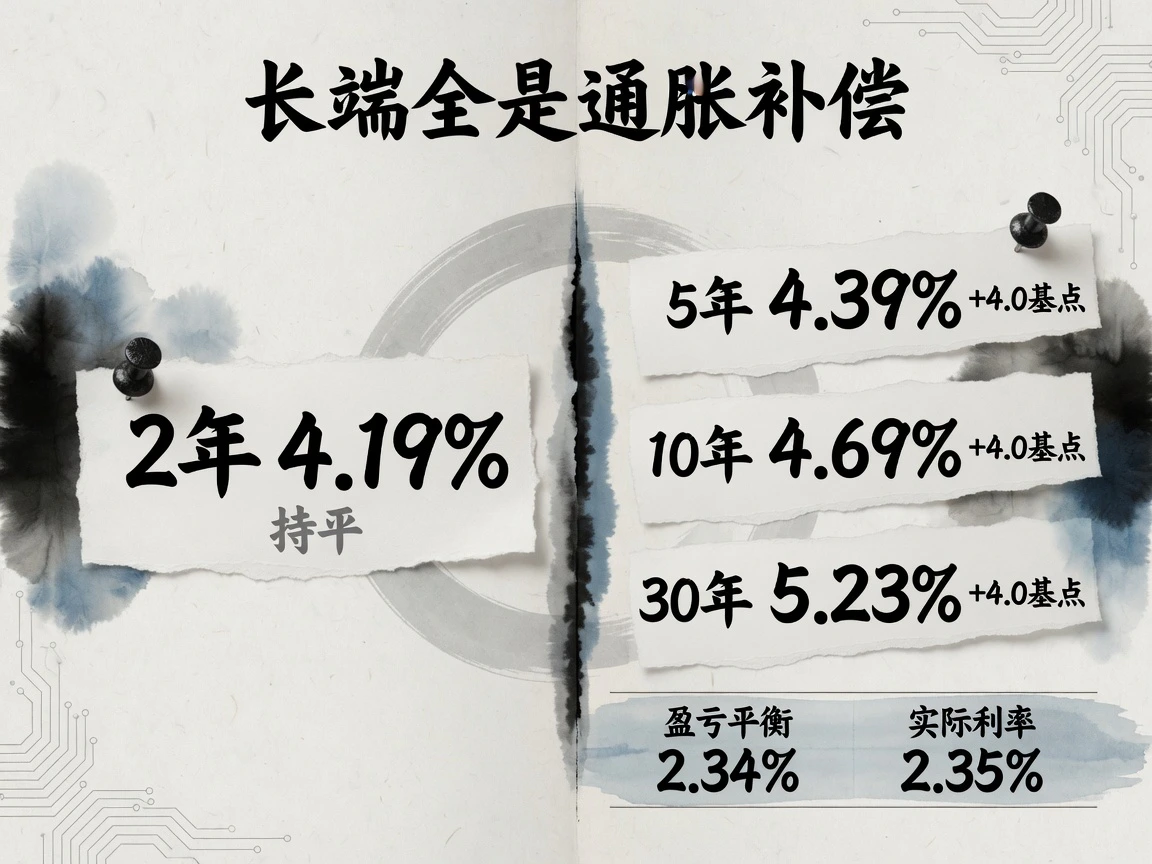
Daily Market Review · August 21, 2026
On August 20, Treasuries surrendered much of the rally from expanded buybacks. Five-, ten- and thirty-year yields rose four basis points to 4.39%, 4.69% and 5.23%, with inflation compensation driving the long end. Strong manufacturing contrasted with weak Walmart sales, while higher oil and pending sanctions added pressure.
Read article ↗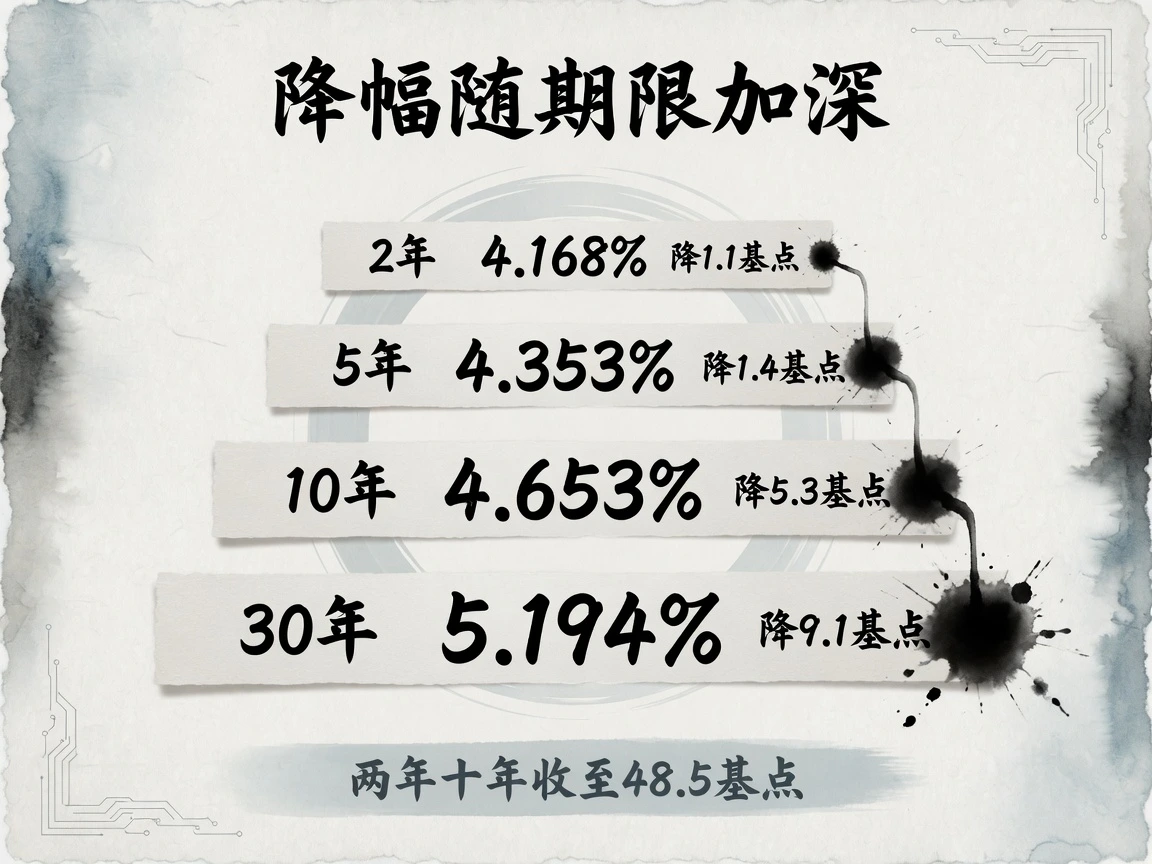
Daily Market Review · August 20, 2026
On August 19, Treasury announced that single-operation liquidity-buyback caps for 10-20-year and 20-30-year nominal bonds would rise from $2 billion to at least $4 billion, effective September 9. The 30-year yield, at its highest since 2007 the day before, fell 9.1 basis points to 5.194%.
Read article ↗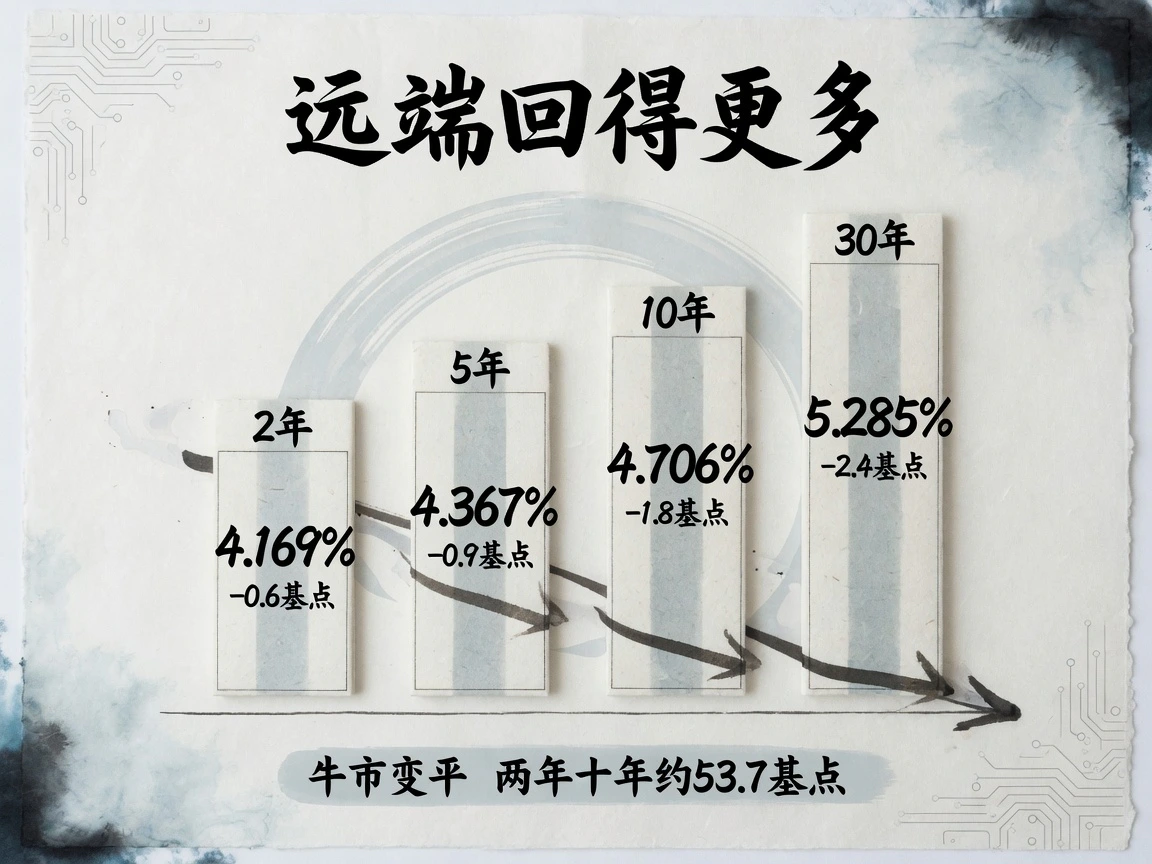
Daily Market Review · August 19, 2026
On August 18, 2026, weakening activity volumes coexisted with sticky prices. The 30-year yield reached 5.337%, highest since 2007, before ending 5.285%; yields fell more at the far end even as 10-year breakeven inflation widened…
Read article ↗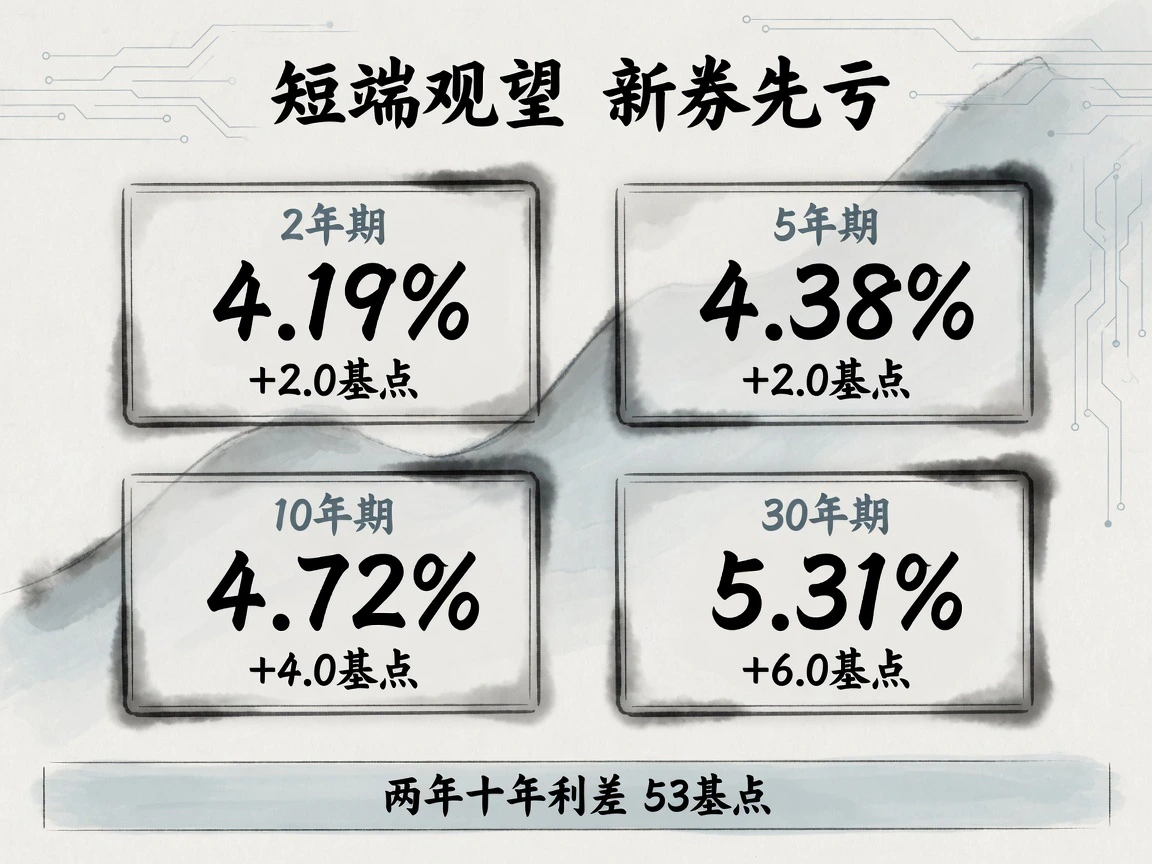
Daily Market Review · August 18, 2026
On August 17, newly auctioned 3-, 10- and 30-year Treasuries settled. The 2-year rose only 2 basis points to 4.19%, versus 4 basis points for the 10-year to 4.72% and 6 for the 30-year to 5.31%. Short rates continued to favor a September hold, while the long end repriced supply settlement, real yields and energy premiums.
Read article ↗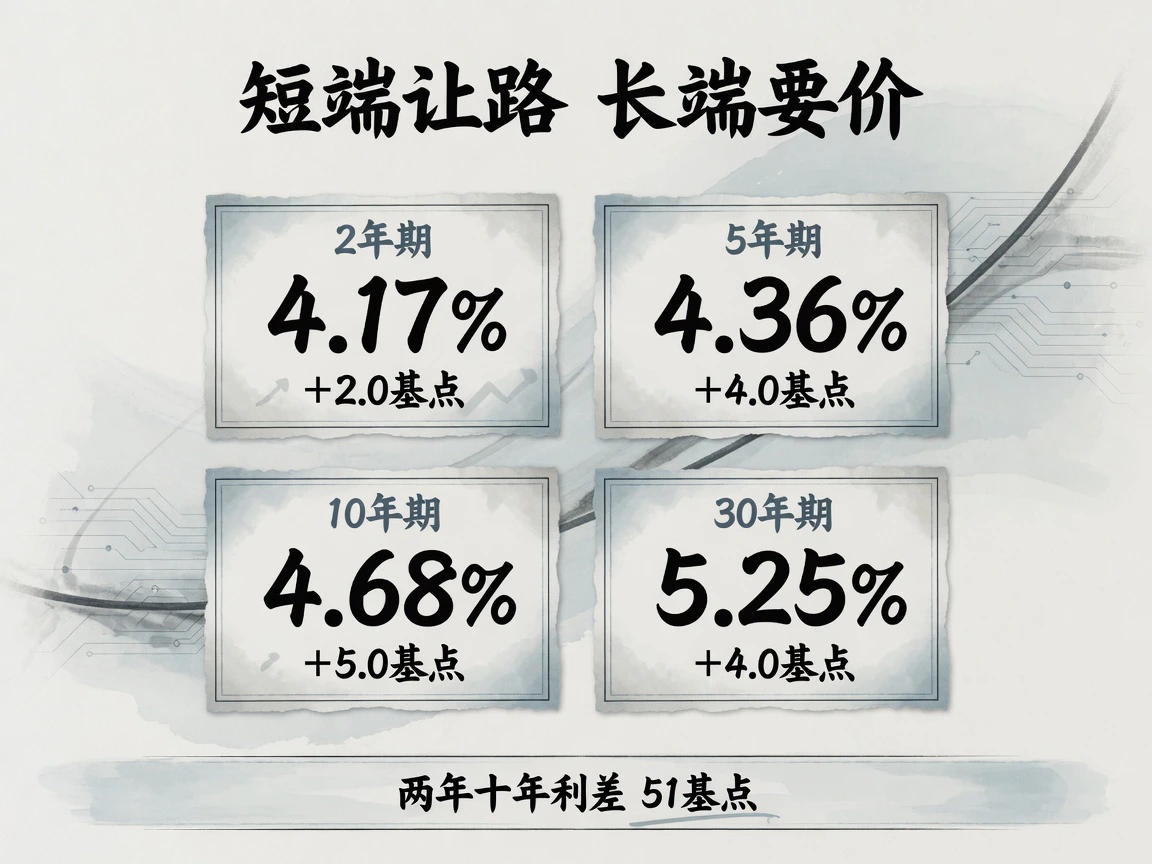
Daily Market Review · August 17, 2026
US July retail and food-service sales released August 14 fell 0.6% to $763.6 billion, the first drop since October and largest in 14 months, against a 0.1% rise expected. Michigan sentiment fell to 51.0. September hike odds dropped near 30%, while the 10-year Treasury yield rose to 4.68%.
Read article ↗
Daily Market Review · August 16, 2026
Retail falls but long yields rise, while oil and gold strengthen together. Weak data become a true tailwind for risk assets only if inflation compensation and long-term funding costs fall with them.
Read article ↗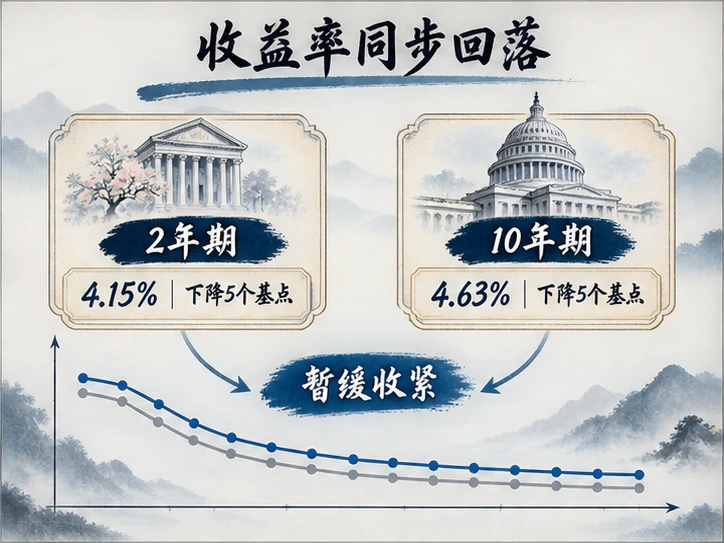
Daily Market Review · August 14, 2026
Milder July PPI lifted intermediate Treasuries and sent US stocks to records. Lower oil eased near-term inflation concerns, but long-end term premiums and energy-supply risks remained.
Read article ↗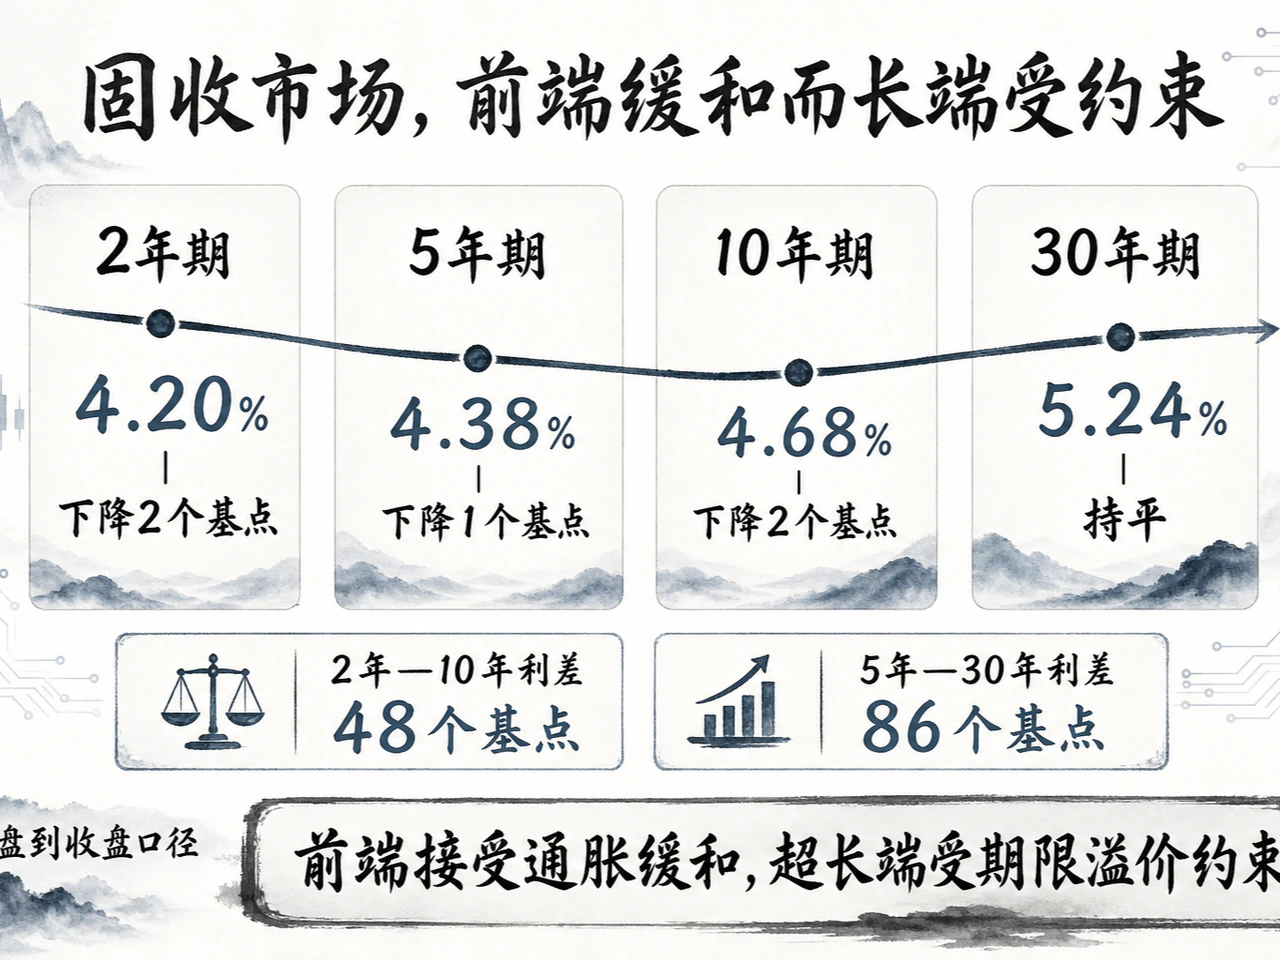
Daily Market Review · August 13, 2026
Cooler July inflation and verified AI earnings supported selective U.S. equity gains. Front Treasury yields fell while 30-year yields stayed flat; supply and term premiums still constrain the long end, while oil awaits inventory and Gulf-shipping evidence.
Read article ↗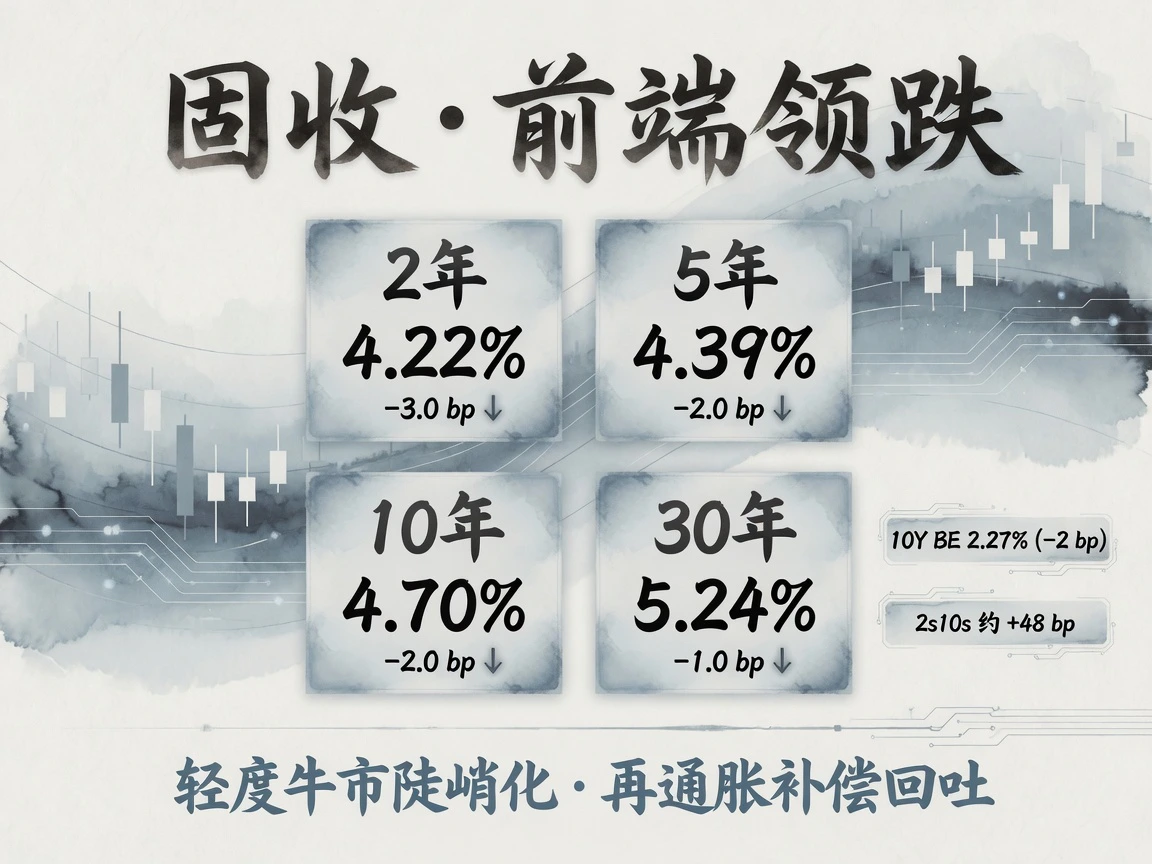
Daily Market Review · August 12, 2026
On August 11, markets partly reversed Monday's roughly 5% oil shock. Treasury yields fell, led by the front end, and ten-year breakeven inflation narrowed about two basis points, removing some energy premium without opening an easing trade.
Read article ↗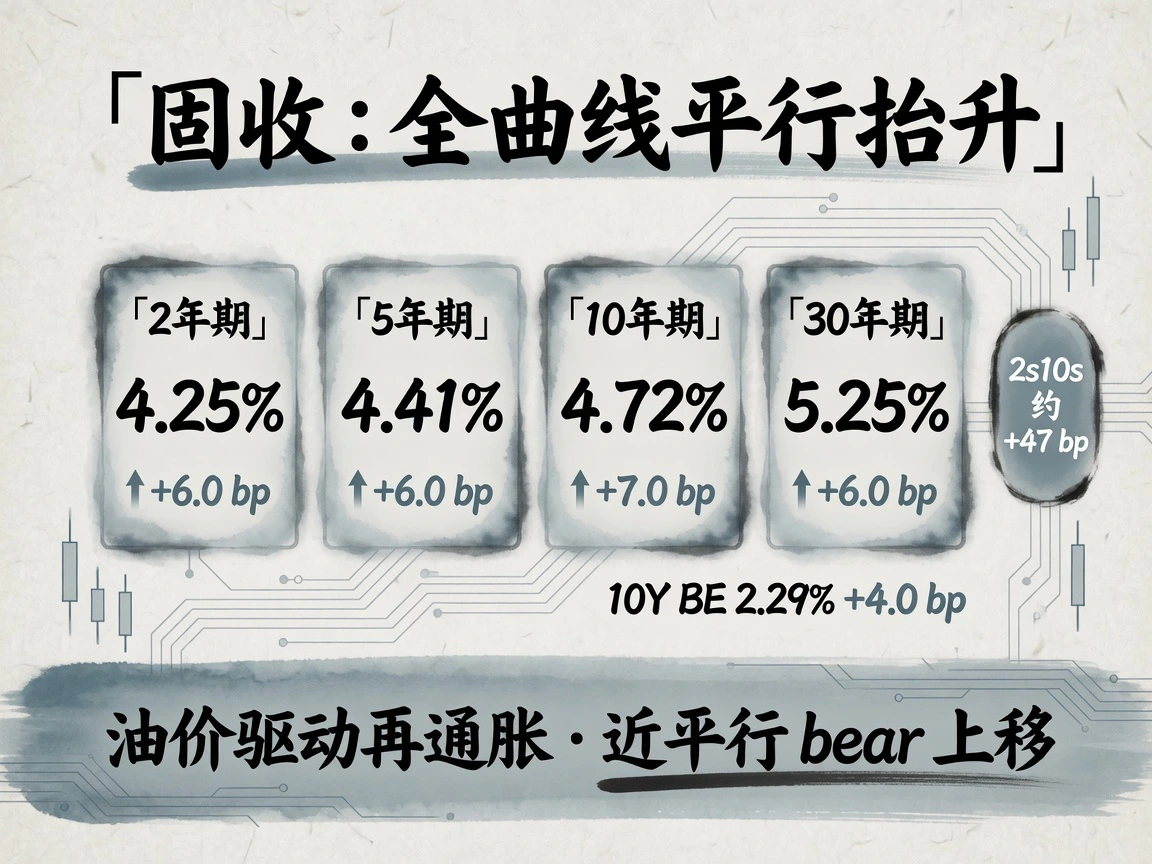
Daily Market Review · August 11, 2026
On August 10, 2026, fading weekend hopes for navigation and talks restored near-term reflation risk. WTI and Brent settlements rose about 5%, and Treasury yields shifted almost parallel upward: 2-year +6bp, 10-year +7bp to 4.72%, with 10-year breakevens about 4bp wider.
Read article ↗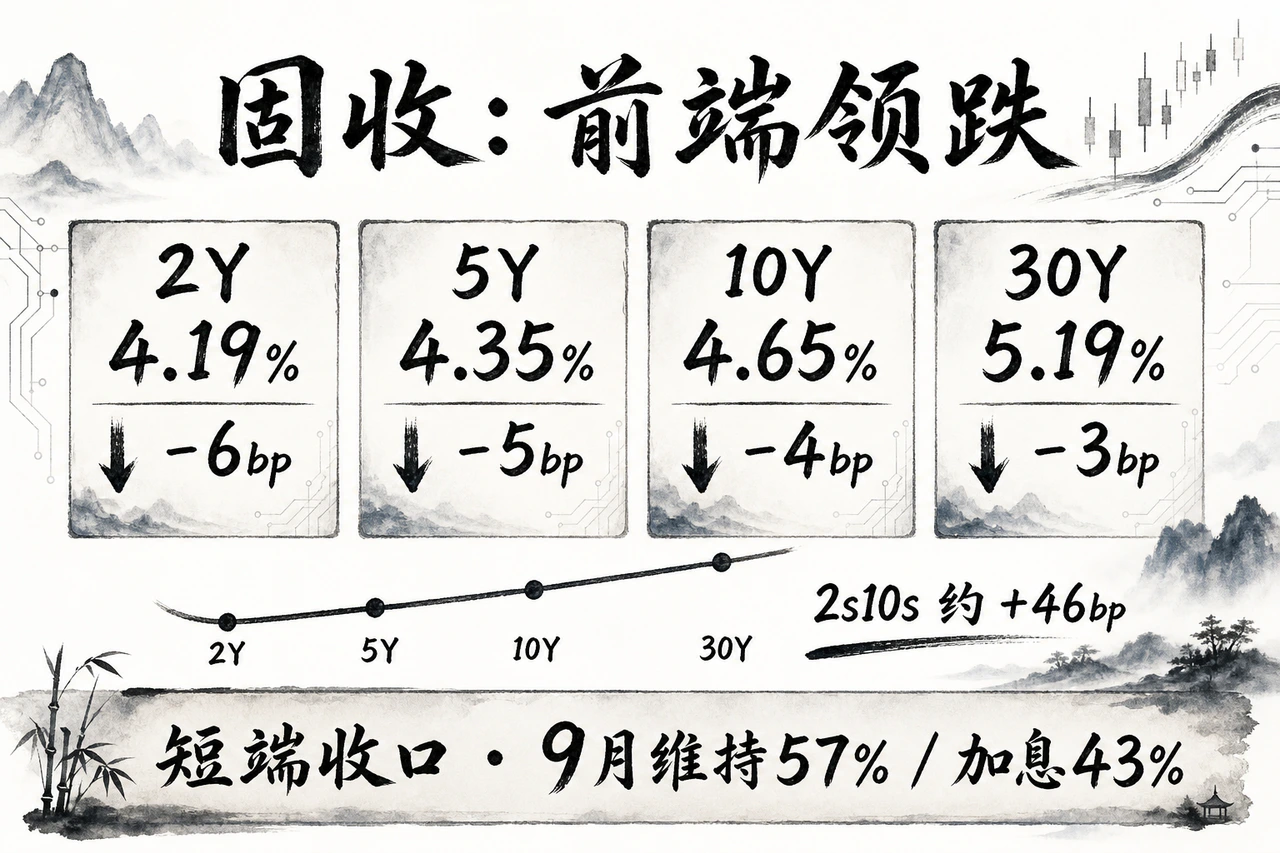
Daily Market Review · August 10, 2026
On August 7, 2026, a payroll shock shifted market pricing toward labor-market weakness. July nonfarm payrolls fell by 23,000 against a consensus gain of about 80,000, while May and June were revised down by a combined 103,000. Treasury yields fell across the curve, led by the front end, producing a bull steepener.
Read article ↗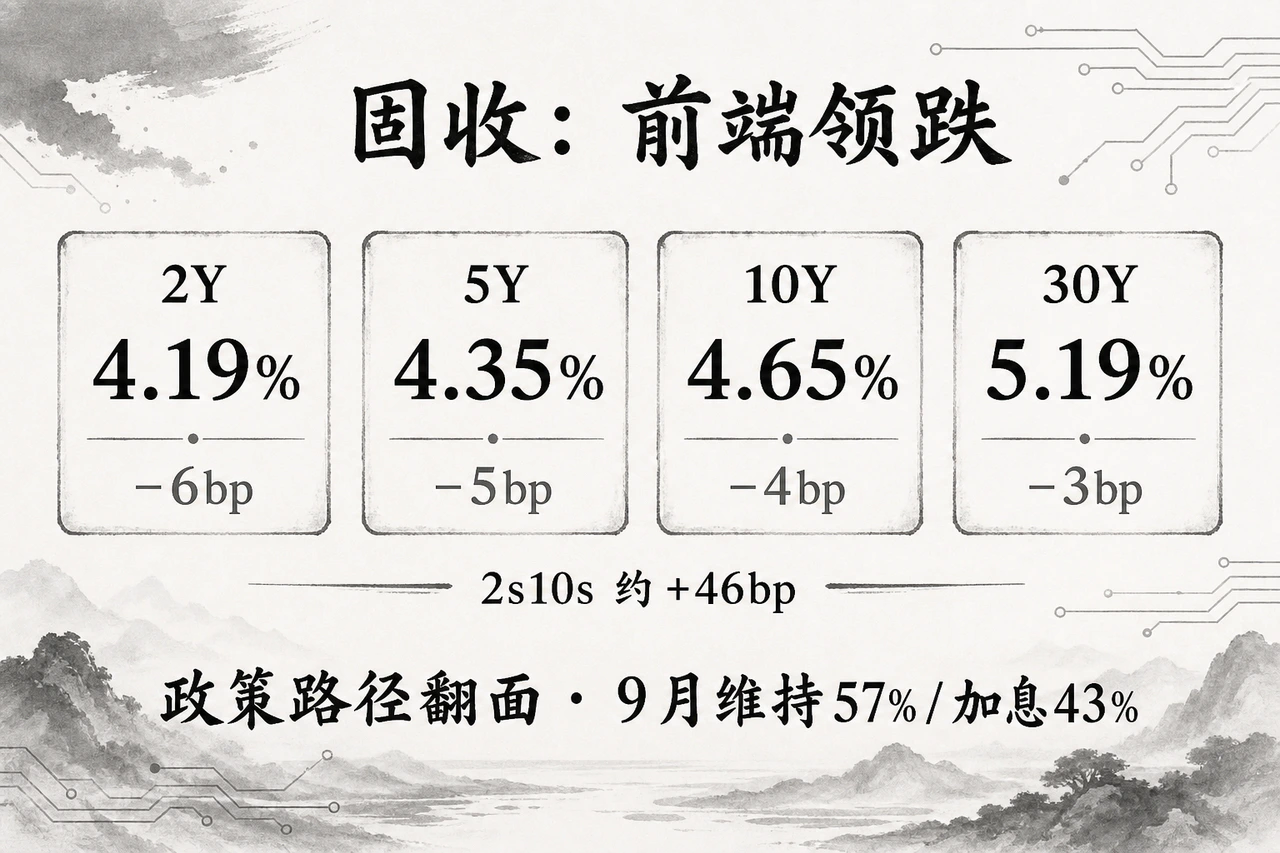
Daily Market Review · August 8, 2026
August 7 pricing shifted to a labor shock: July payrolls fell 23,000 versus about 80,000 expected and May–June revisions removed 103,000. Treasury yields fell most at the front, producing a bull steepener. CME FedWatch…
Read article ↗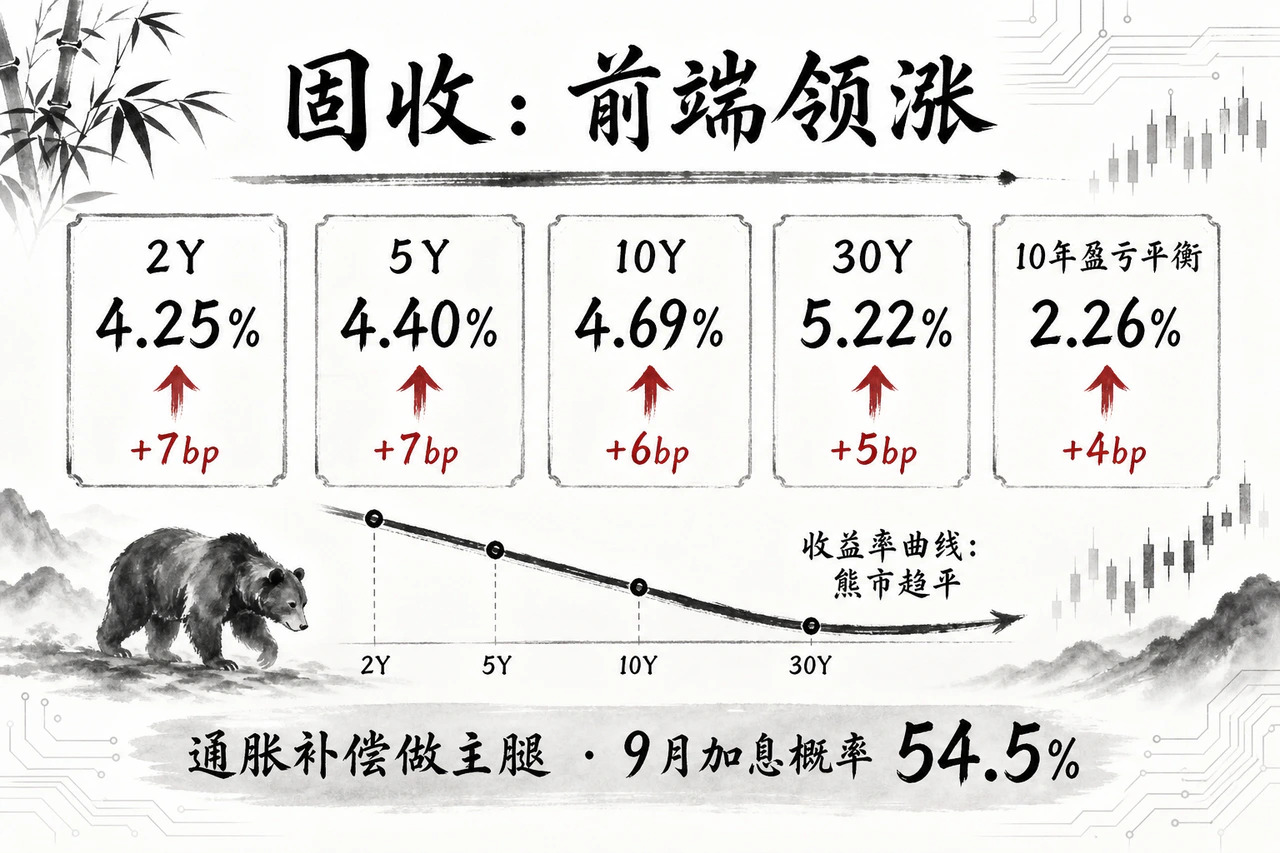
Daily Market Review · August 7, 2026
On August 6, 2026, geopolitical inflation premiums regained control. Early Hormuz reopening optimism reversed as Iran reviewed a draft barring U.S. and Israeli ships and imposing fines up to about 20% of cargo value, prompting a sharp oil rebound.
Read article ↗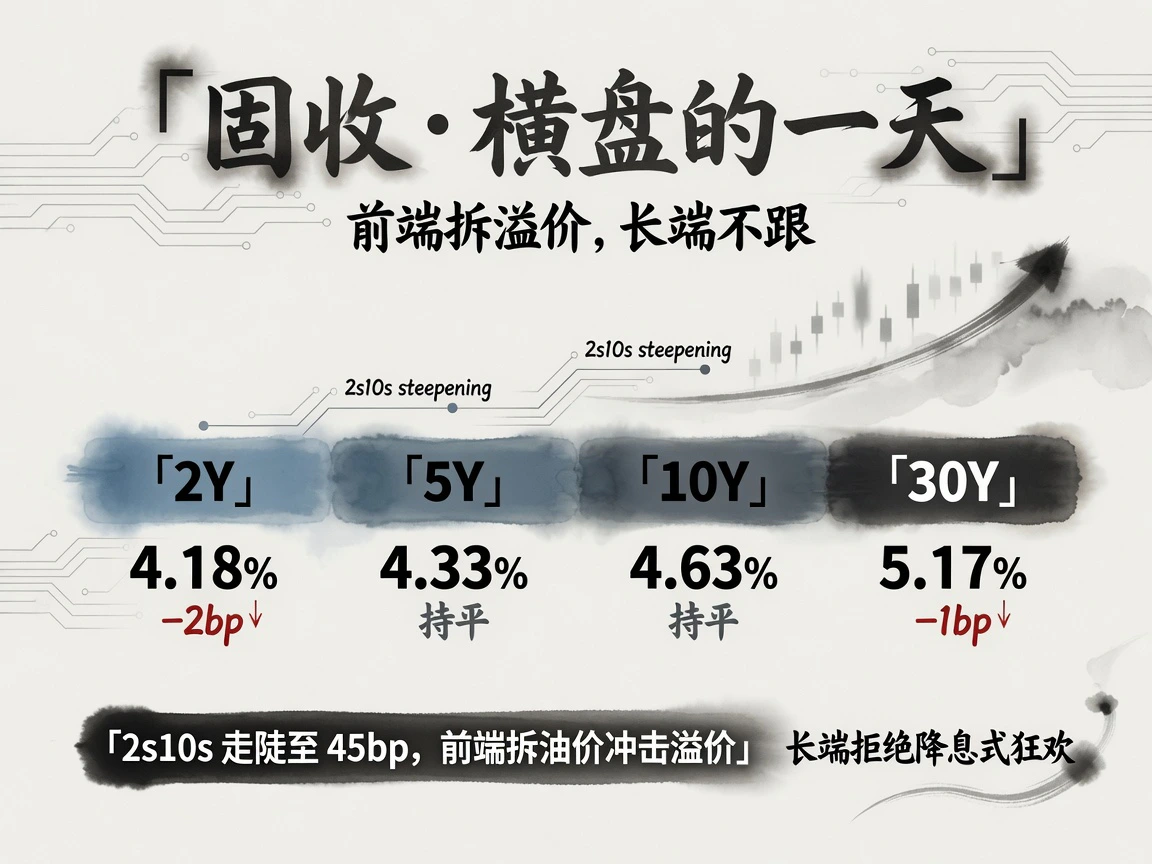
Daily Market Review · August 6, 2026
On August 5, markets consolidated after repricing a possible Hormuz agreement. Iran and Oman's draft and route coordinates awaited final approval. Oil stabilized near $75 WTI and $79 Brent, while a Dow record concealed divergent technology earnings.
Read article ↗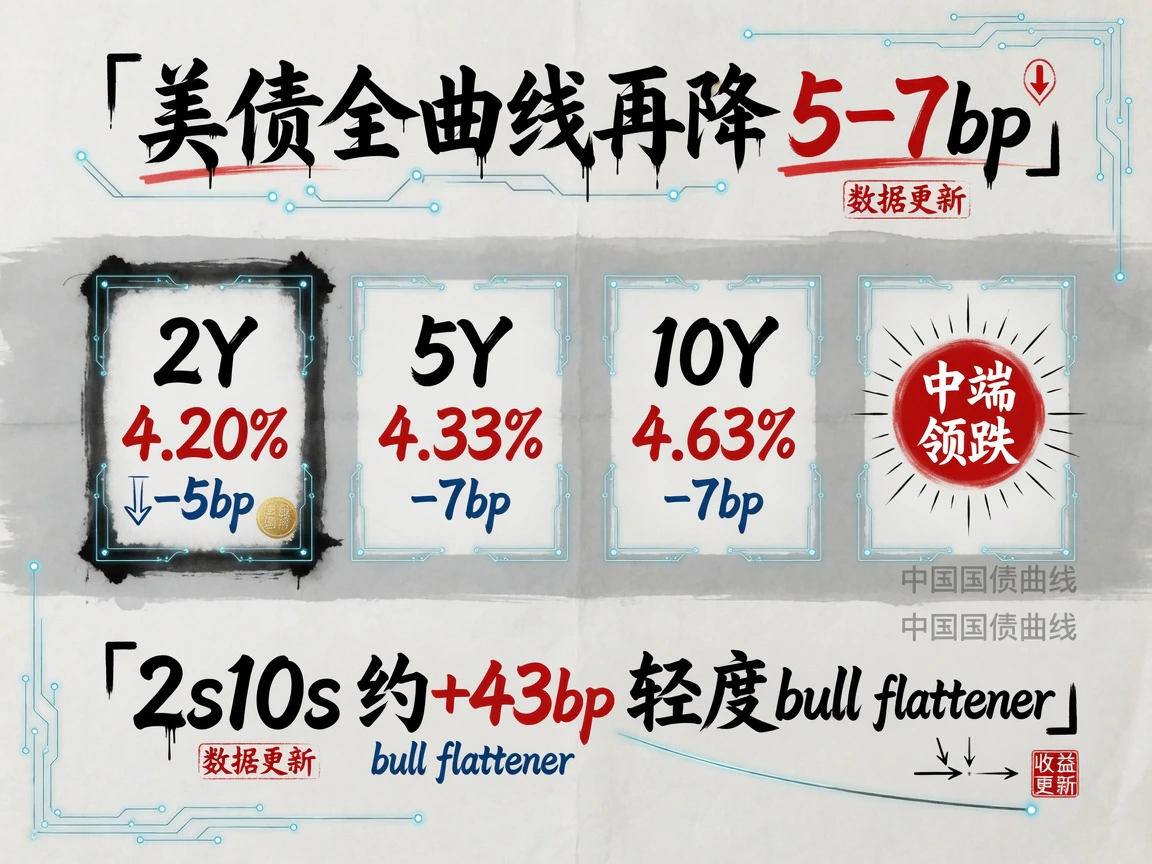
Daily Market Review · August 5, 2026
On August 4, 2026, global markets were driven by rising hopes of a reopening of the Strait of Hormuz. Treasury Secretary Bessent told CNBC that morning that the U.S. and Iran had a chance of reaching an agreement today or tomorrow; Qatar said a draft transition plan was circulating. Oil plunged for a second day, with WTI settling at $74.81.
Read article ↗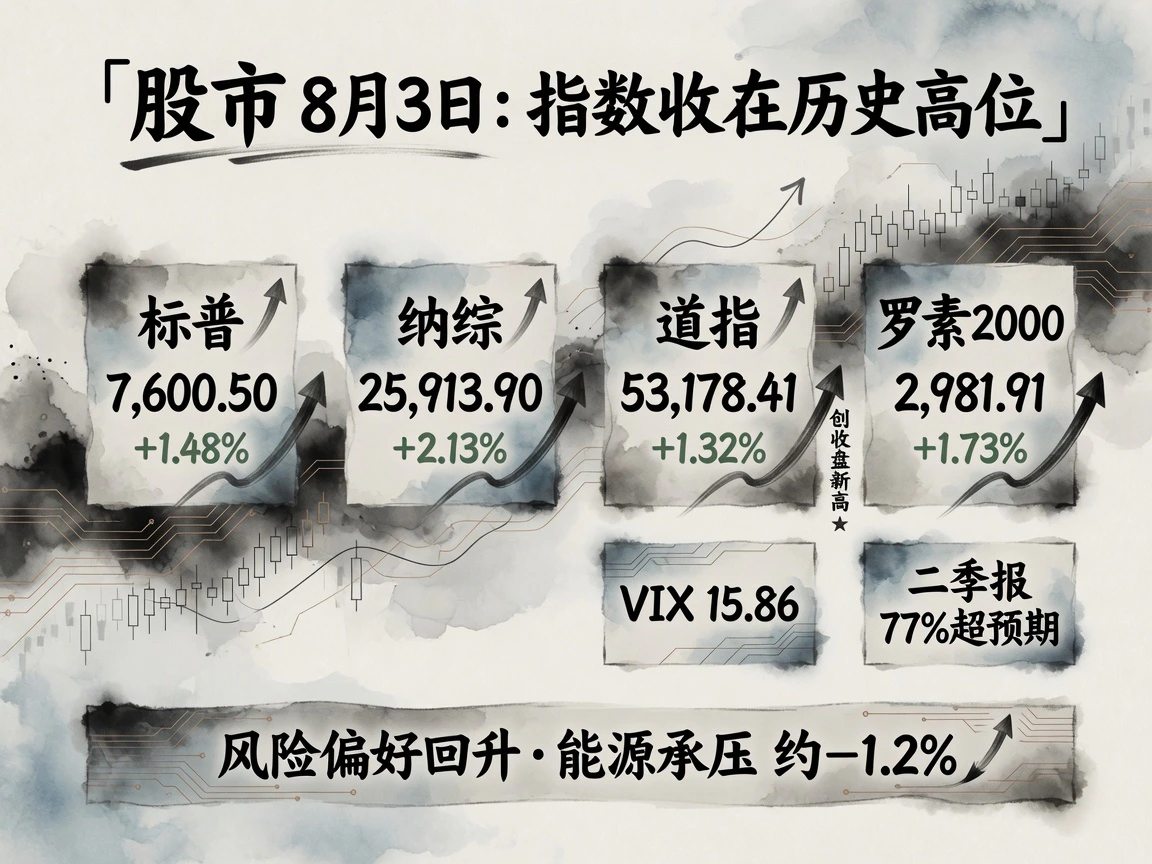
Daily Market Review · August 4, 2026
On August 3, markets read paused strikes and reopening rhetoric as lower escalation risk. Stocks and bonds rallied, WTI settled around $80.3, Treasury yields fell 3–5 basis points in mild bull flattening, and the Dow closed at a record 53,178.41.
Read article ↗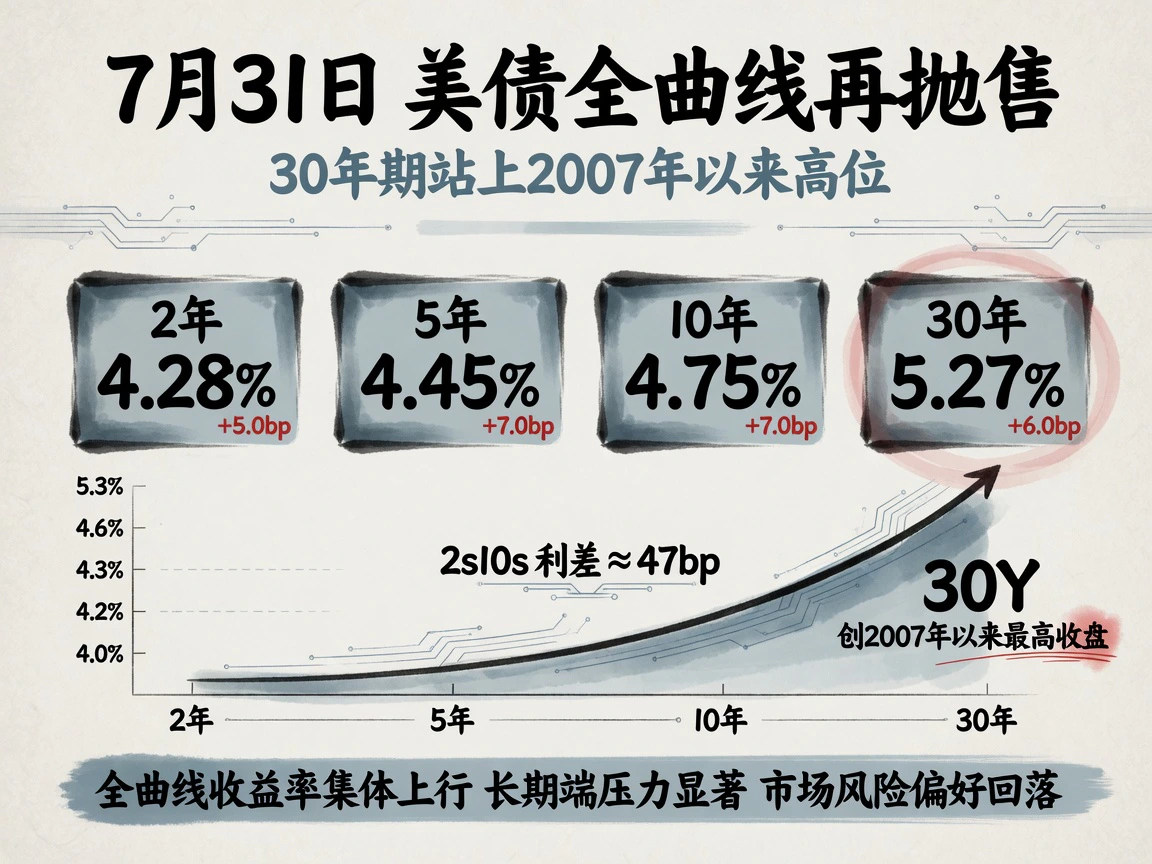
Daily Market Review · August 3, 2026
On July 31, Treasury selling lifted two- through 30-year yields 5–7 basis points, with the 30-year closing in its highest range since July 2007. The week moved from pre-meeting relief through a post-meeting twist to broad curve repricing.
Read article ↗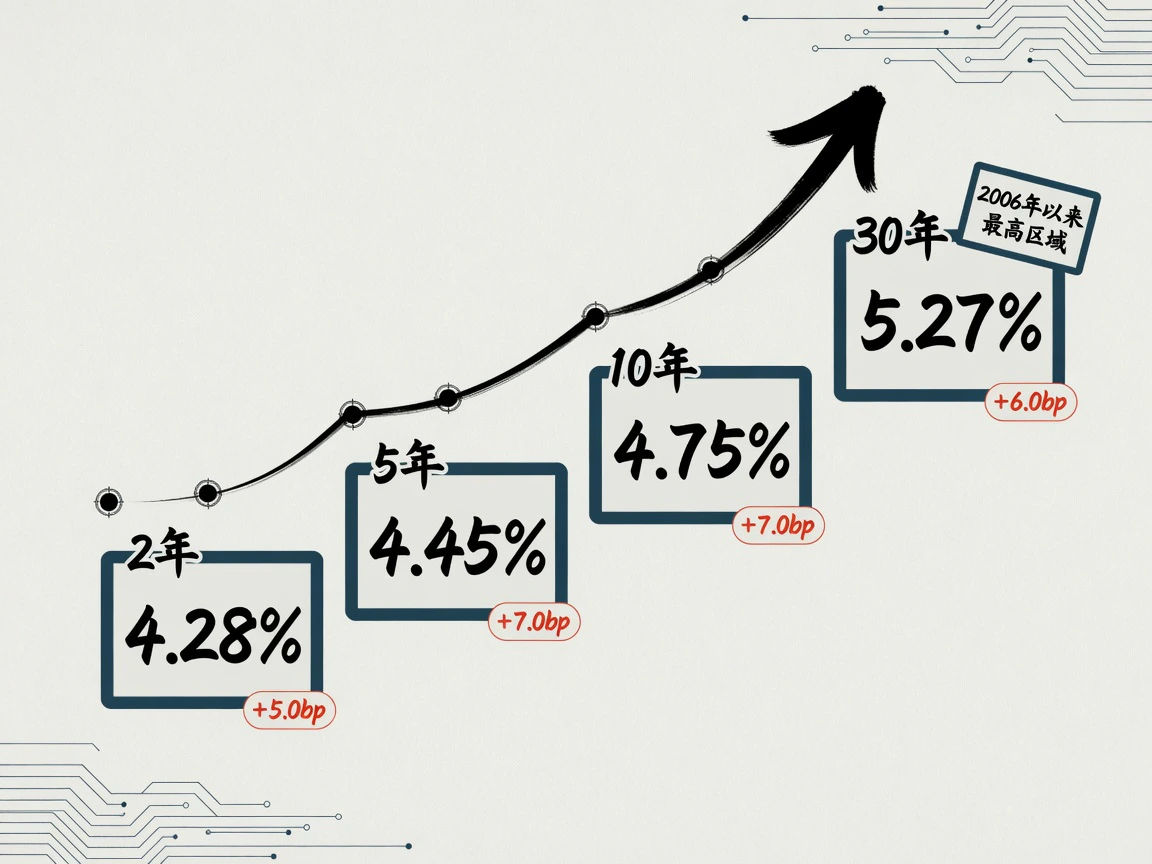
Daily Market Review · August 2, 2026
On July 31, 2026, Treasuries sold off for a third session after the Fed’s fifth consecutive hold. Yields from two to thirty years rose 5–7 basis points, with the thirty-year reaching 5.27%, its highest area since 2006–2007. Public comments from officials who dissented in favor of a hike helped lift September hike odds to about two-thirds.
Read article ↗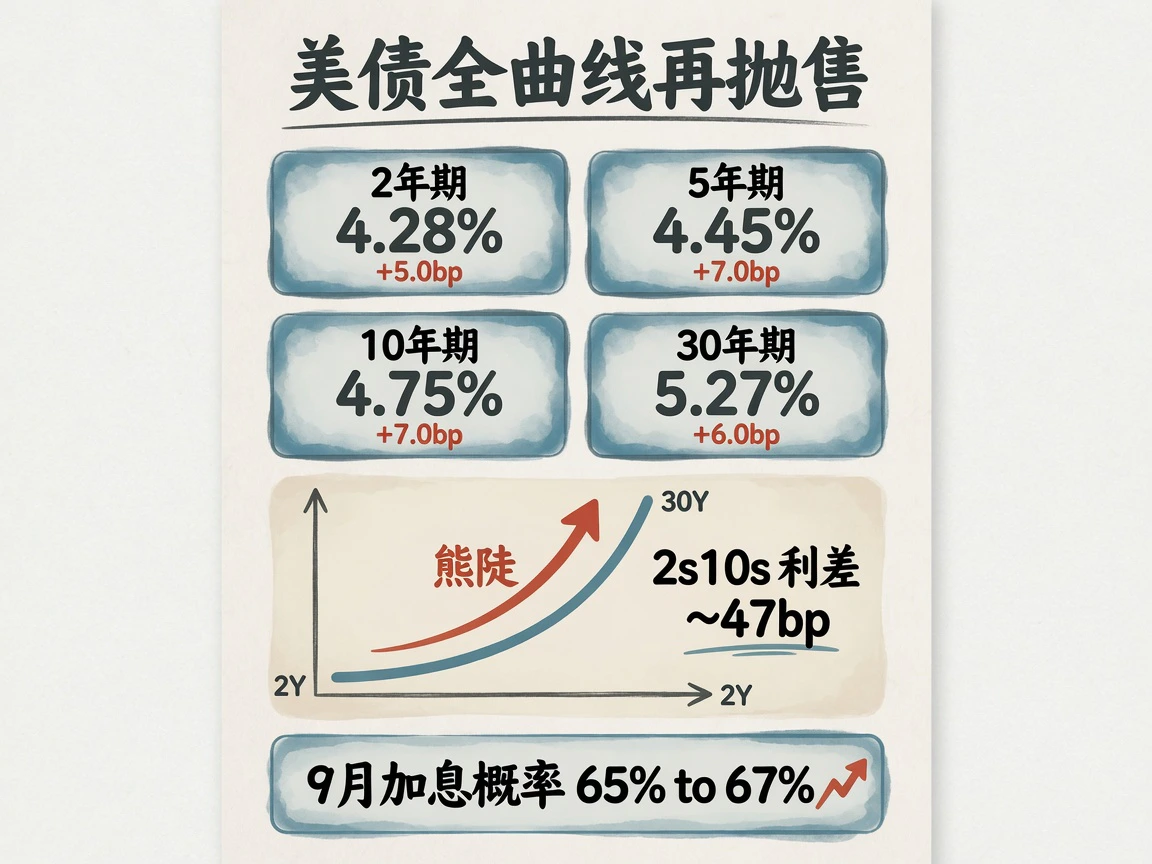
Daily Market Review · August 1, 2026
On July 31, 2026, global assets diverged along four lines. Treasuries sold off across the curve, with four key maturities rising 5–7 basis points, as successive comments by the three FOMC dissenters further strengthened hike expectations. U.S. indexes rose, but internal divisions were sharp: Amazon gained 15%, with AWS revenue vindicating AI capital spending, while Apple fell.
Read article ↗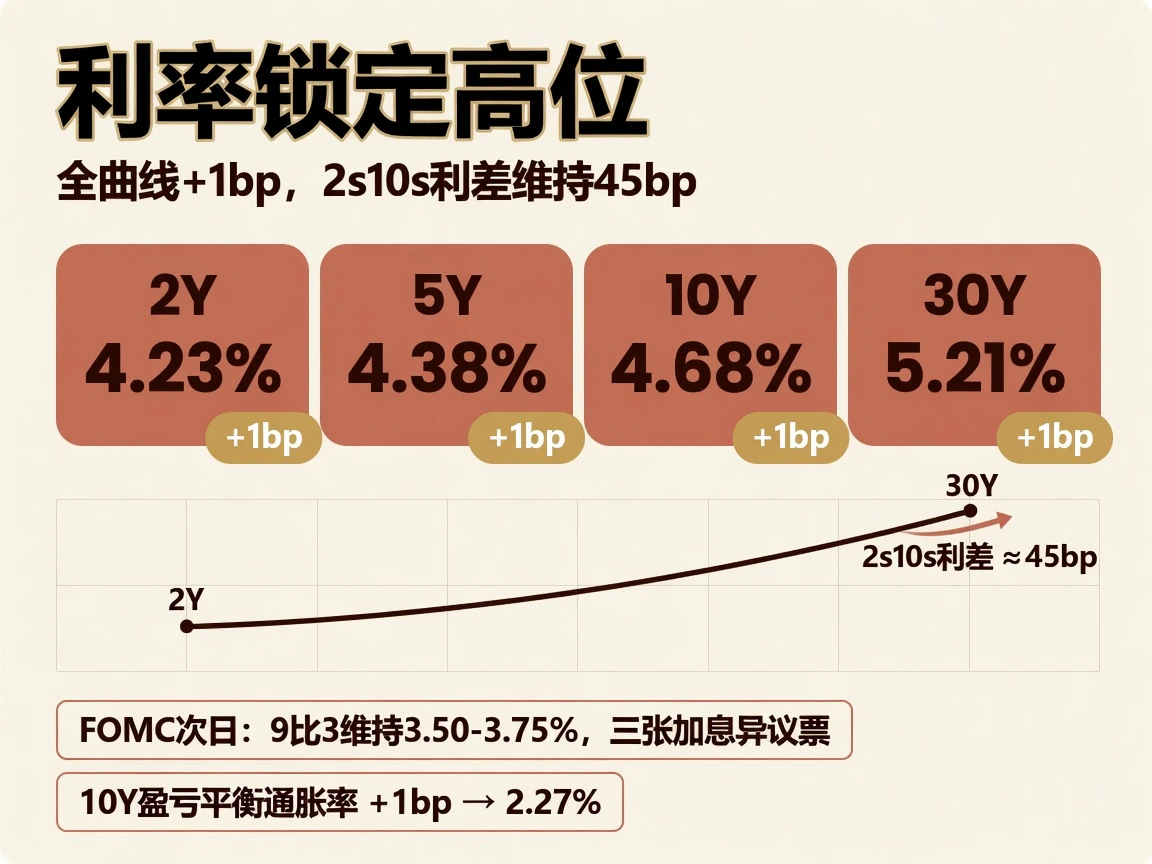
Daily Market Review · July 31, 2026
On July 30, 2026, markets digested the FOMC along three parallel tracks: rates stayed elevated, Microsoft and Meta split equities over returns on AI investment, and geopolitical fears eased into high-level volatility. VIX fell almost a fifth, but long Treasury yields refused to retreat. Across assets…
Read article ↗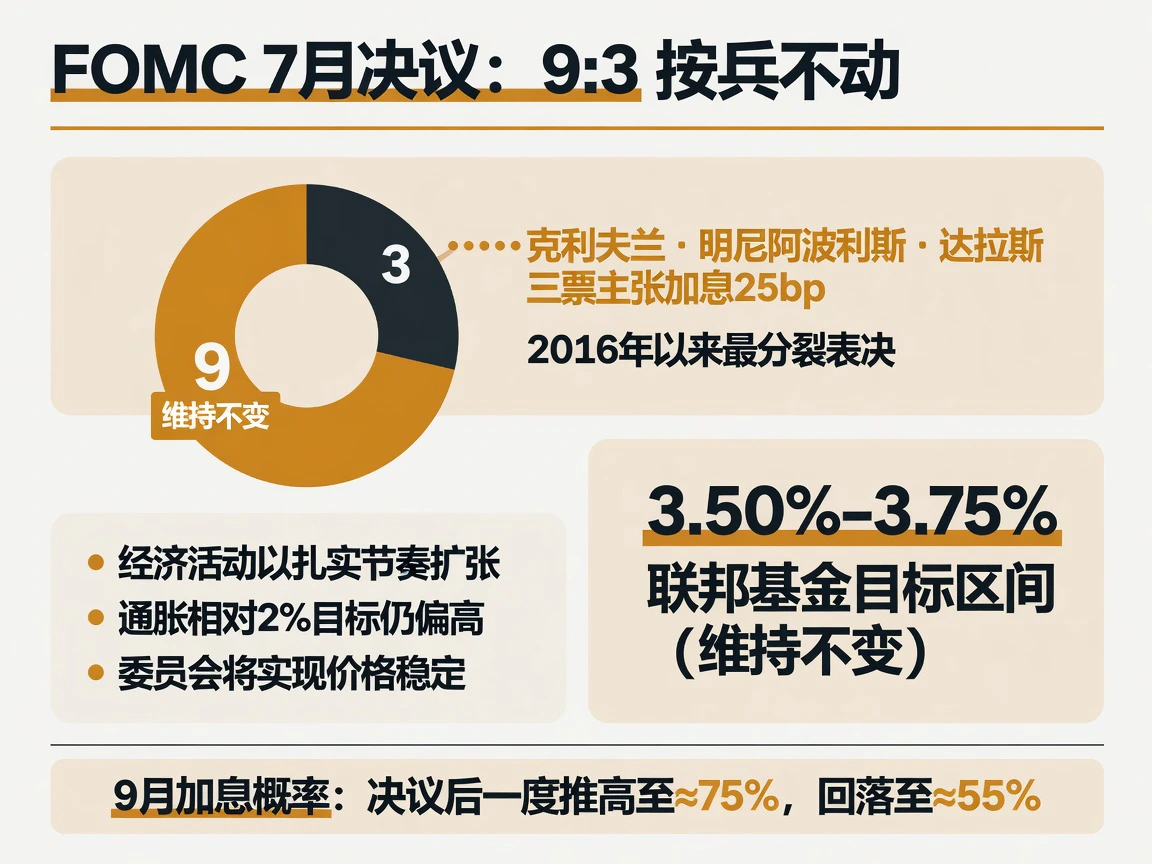
Daily Market Review · July 30, 2026
On July 29, 2026, an apparently unchanged FOMC decision triggered global repricing. The Fed held rates by 9 votes to 3, but three regional Fed presidents favored a 25-basis-point increase, the most divided vote since 2016. Renewed escalation in the Middle East sent oil more than 6% higher and drove a sharp bear-steepening at the long end of the Treasury curve.
Read article ↗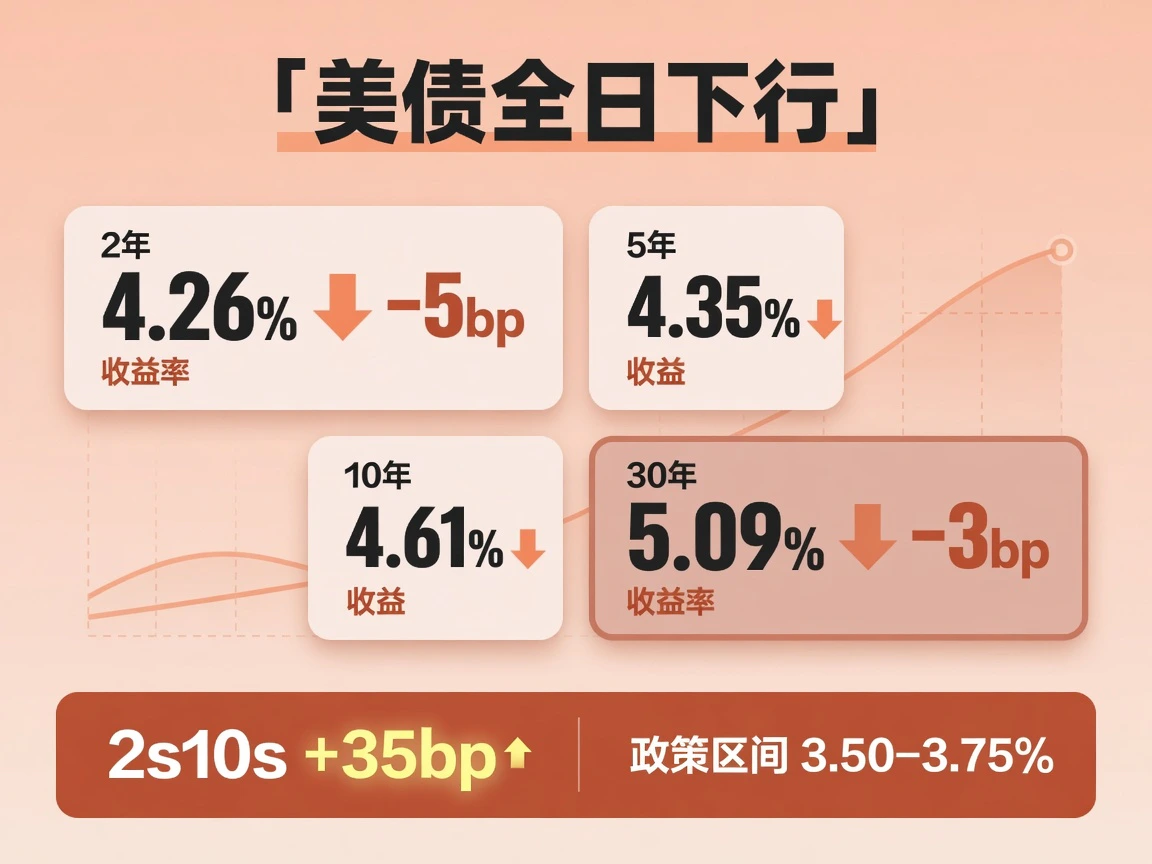
Daily Market Review · July 29, 2026
On July 28, 2026, markets priced a pause in U.S.-Iran exchanges: WTI settled down 4.1%, Brent 4.8%, Treasury yields fell and earnings lifted the Dow. Beneath cross-asset relief, portfolios rotated sharply as semiconductors fell more than 4% and memory stocks plunged. Renewed after-hours tensions rapidly restored much of oil's premium.
Read article ↗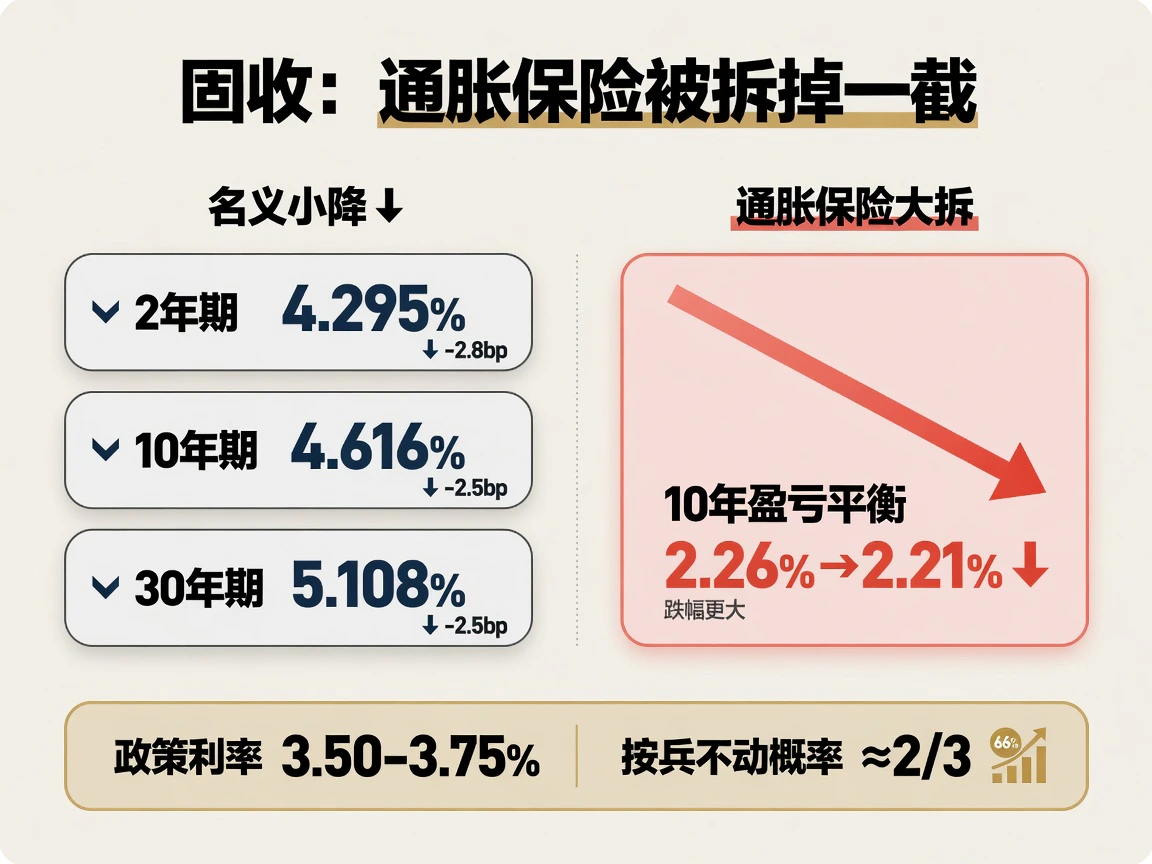
Daily Market Review · July 28, 2026
On the third day of the US–Iran pause, oil plunges almost 10% and ten-year inflation expectations fall five basis points, yet nominal Treasury yields ease only slightly. Markets turn from the Hormuz premium to this week's FOMC decision and megacap earnings.
Read article ↗