Scope: Using official May–July 2026 CPI and PPI data and their components, this article examines why a price recovery previously lacking breadth is now also lacking persistence, and the implications for monetary, fiscal and property-policy transmission.
Central Judgment: Recovery Momentum Weakens Again
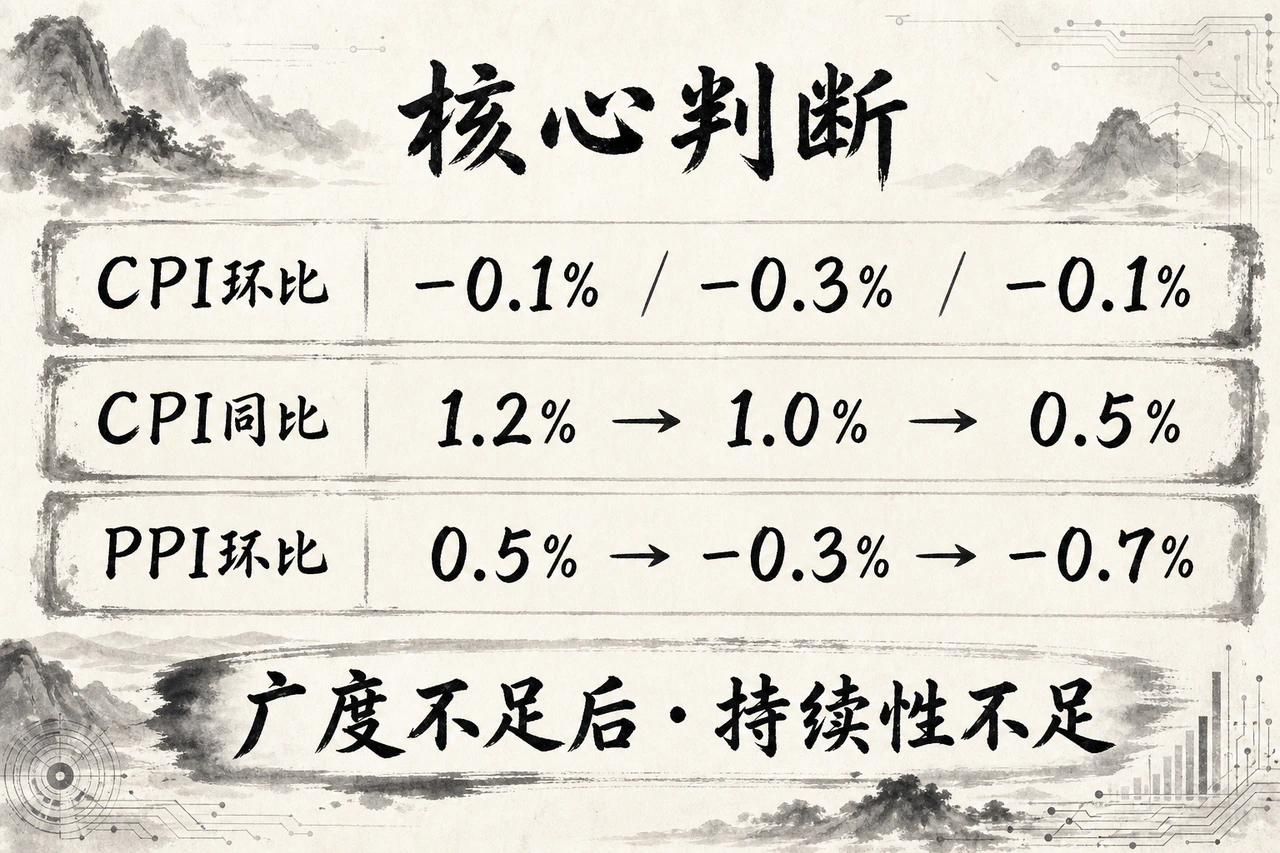
China's May–July 2026 prices showed a deceptive split between appearance and underlying conditions. Annual CPI seemed safely positive at +1.2%, +1.0% and +0.5%, while annual PPI remained relatively high at +3.9%, +4.1% and +3.5%. Removing base effects and examining current monthly changes exposed rapidly fading momentum. CPI recorded an unusual three consecutive declines of -0.1%, -0.3% and -0.1%. PPI reversed from May's +0.5% to -0.3% in June and -0.7% in July.
High annual readings alongside falling monthly prices are the central contradiction.
This cannot simply be labeled comprehensive index deflation, but neither a steady price recovery. July PPI's +3.5% annual rate can misleadingly suggest strong industrial-price expansion. In the breakdown, producer-goods ex-factory prices fell 0.9% monthly and raw-material industries 2.4%, showing renewed production-side price weakness and deflationary pressure.
The clearest description of May–July is: annual readings rely on base and carryover effects, while monthly momentum weakens materially. The recovery has progressed from insufficient breadth to insufficient persistence.
Policy therefore cannot continue relying one-way on supply-side investment and production expansion. The immediate priority is rebalancing disposable income, company profits, property balance sheets and economywide price expectations.
1. CPI Weakness: Inadequate Demand Meets the Food Cycle
Medical care, education and other public-service prices are often rigid. Vehicles, appliances, durable goods, housing and large discretionary purchases more sensitively reflect buying intentions and private competition. Three monthly declines and annual inflation of +0.5% reveal not an abrupt aggregate collapse but insufficient sustainable current purchases at the consumer end.
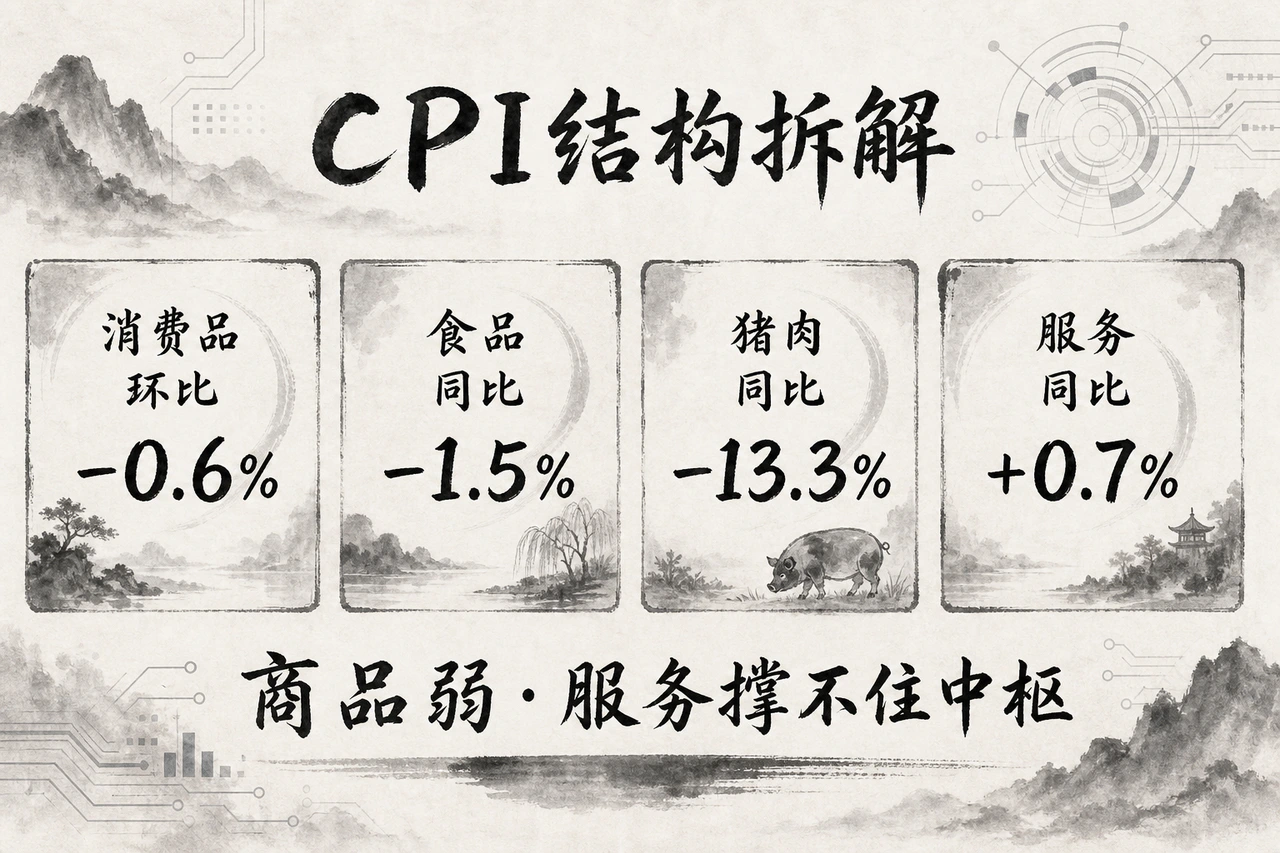
The split between goods and services was striking in May–July: July consumer-goods prices fell 0.6% monthly. Households had not stopped consuming, but activity was narrowing toward basic services and essential spending. Fragmented, low-ticket local services cannot absorb manufactured goods on a large scale or broadly lift durable prices. Falling annual vehicle prices and weak housing reflect extreme caution over large debts and long-horizon assets. Three preconditions underpin an endogenous rise in goods prices:
- Disposable-income growth must meaningfully and persistently outpace inflation;
- Property and financial assets must stabilize to stop negative wealth-balance-sheet contraction;
- Employment quality and long-run income expectations must improve enough to break defensive high saving.
All three pillars remain in fragile repair without effective joint reinforcement.
Food was a powerful drag. July food prices fell 1.5% annually and pork 13.3%; food, tobacco, alcohol and dining out fell 0.8%, directly subtracting about 0.22 percentage point from CPI. Monthly food prices stabilized and pork rebounded 4.1%, suggesting delayed hog marketing and partial cyclical repair. Yet weakness harms farmers' and rural households' operating cash flow, entrenches expectations of cheaper goods and intensifies competition in food processing and restaurants. Synchronized declines in food, cars, appliances and housing are microeconomic price wars and macroeconomic weakness in effective nominal demand.
Services retained some resilience: July +0.7% annually and +0.4% monthly, versus goods +0.2% annually and -0.6% monthly. Housing fell 0.3% annually, rents 0.6% and passenger cars 1.3%. Slight service inflation barely kept CPI from turning negative. Seasonal or public-service price rigidity alone cannot lift the general price level, because it has not become broad wage gains or restored corporate pricing power.
July core CPI excluding food and energy was +0.9% annually and +0.3% monthly, making the official description of generally moderate increases statistically valid. Yet weakness experienced in durables, vehicles, rents and major purchases was also real. Consecutive monthly momentum is more forward-looking for deflation risk than one annual reading flattered by carryover effects.
The official July explanation first emphasized imported factors. Gasoline's annual increase fell 16 percentage points from June, reducing its CPI contribution about 0.45 point; transport-fuel prices dropped 9.8% monthly. Ample fruit and egg supply and weaker-than-seasonal prices offset higher pork and vegetables. The annual slowdown from 1.0% to 0.5% was not entirely sudden domestic-demand collapse. But imported and seasonal effects cannot conceal persistent weakness in goods, durables and major durable assets. Detailed decomposition is needed to avoid mistaking one component's rebound for successful escape from deflation.
2. PPI Weakness: Upstream Retreat and Blocked Transmission
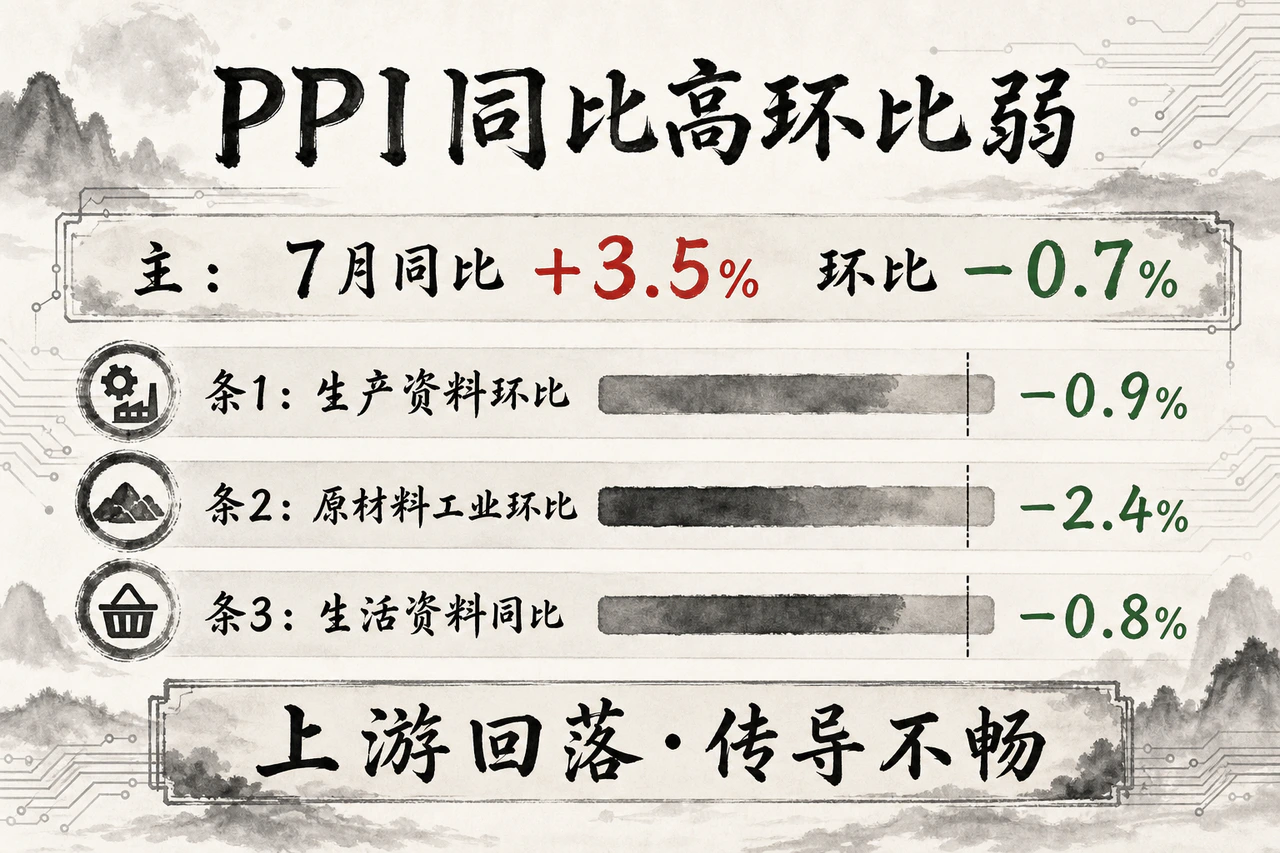
March–April's monthly PPI pulse chiefly reflected overseas commodities, energy and nonferrous metals driven by geopolitics and supply expectations. That force faded rapidly by late second quarter. May PPI was +3.9% annually and +0.5% monthly; June +4.1% but -0.3%; July +3.5% but -0.7%. High annual rates alongside sharply braking monthly prices showed apparent industrial strength becoming an illusion sustained by very low year-earlier bases.
July's breakdown was revealing: raw-material industries' ex-factory prices fell 2.4% monthly, chemical materials 2.6%, fuel and power 2.6%, and nonferrous materials and wire 1.4%. Producer goods overall fell 0.9%, subtracting about 0.70 point from PPI. Earlier upstream imported-cost support had largely faded; without domestic end demand taking over, upstream activity weakened again.
Production retained strong operating inertia. But large output and new capacity confronting weak orders, cautious consumption and stalled property investment leave firms competing through lower prices. Output expands while ex-factory prices and margins shrink, payment periods and receivables lengthen, and producer-to-consumer price transmission becomes blocked.
Producer-goods prices still rose 4.8% annually in July, while consumer-goods producer prices remained at -0.8%, exposing a severe upstream–downstream split. Improvement concentrated in a few resources and raw materials, while processors and durables faced pressure from both ends rather than benefiting.
The anti-involution campaign can curb destructive discounting through administration and industry discipline, but cannot instantly create end demand. Supply-side price restrictions without a fundamental turnaround in consumption, private investment and property cash flow will yield only brief rebounds. Sustainable price clearing requires utilization, full order books, disposable income, operating profits and nominal wages rising together.
Analysis should stop following headline annual PPI strength and track monthly PPI, the producer–consumer goods gap, divergences between major industrial firms' profits and inventory cycles, and support from new-order and export-order indices. Once monthly declines are established, positive annual carryover can coexist with deeply deflationary business conditions.
3. What Simultaneous Weakness Means
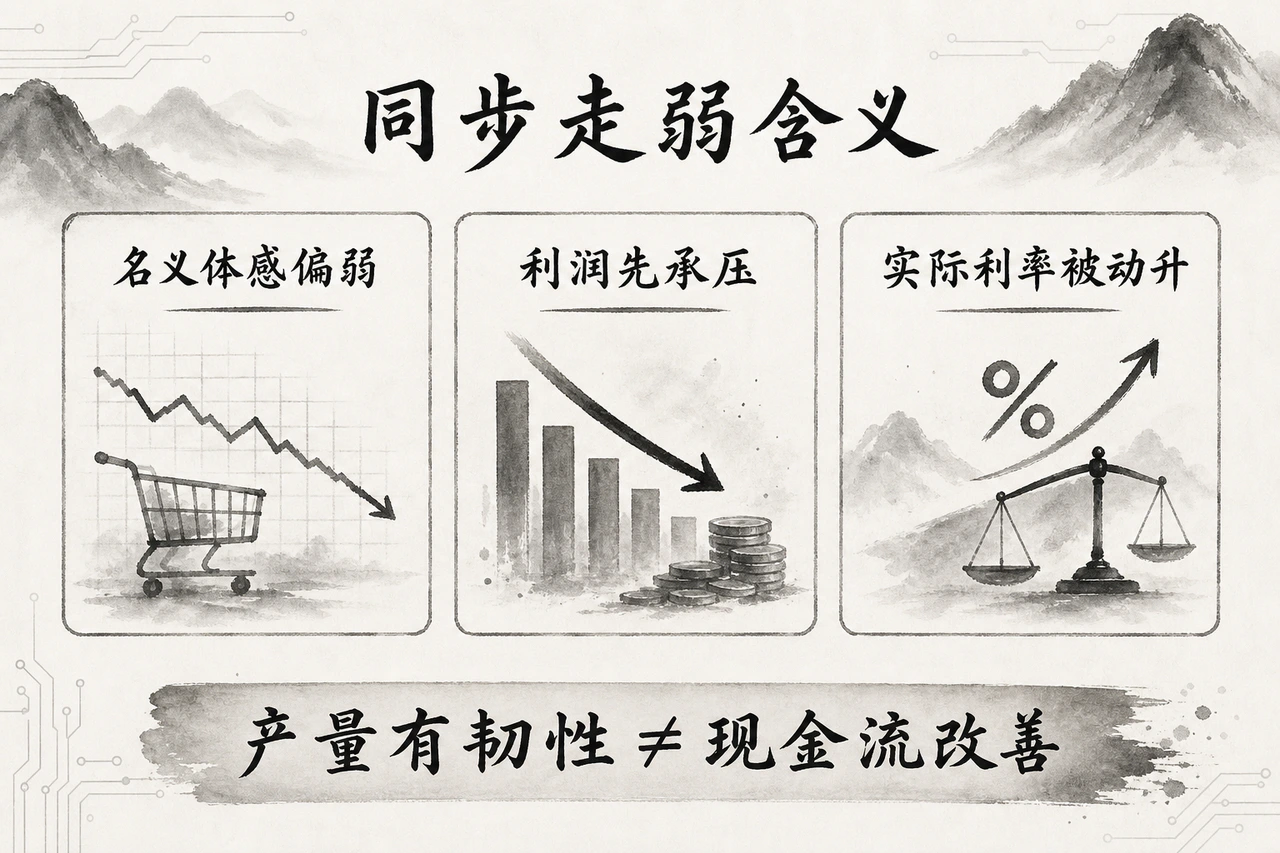
Real GDP measures physical output, while CPI and PPI measure nominal exchange values of goods and services. When prices weaken together, supply resilience may still deliver acceptable real growth, yet nominal GDP, corporate revenue and tax receipts will inevitably decline.
This is the familiar paradox: reported real growth remains resilient while individuals' nominal experience feels bitterly cold. Survival and balance-sheet expansion depend on nominal cash flow covering interest, fixed spending and pay, rather than physical output alone.
Persistently weak PPI lowers factory prices while materials, sticky pay, interest and depreciation cannot fall proportionately, eroding net margins. Downstream firms face output growing faster than revenue, revenue faster than profit, inventories piling up and receivables worsening. Profit concentrates in a few upstream resource monopolies or technology leaders, freezing investment intentions across most manufacturing and private firms and accelerating the loss of endogenous growth.
A deeper spillover is passive real-rate tightening. Stable nominal loan rates or delayed cuts, combined with falling prices and expectations, cause real interest rates to rise rather than fall. Contracts look unchanged, but shrinking product prices and profits, weaker local land-sale and tax revenue, and lower household asset and property values increase the real cost of servicing principal and interest. Highly leveraged developers, local-government financing vehicles and capital-intensive manufacturers face a self-reinforcing balance-sheet contraction.
4. Different Implications for Bonds and Equities
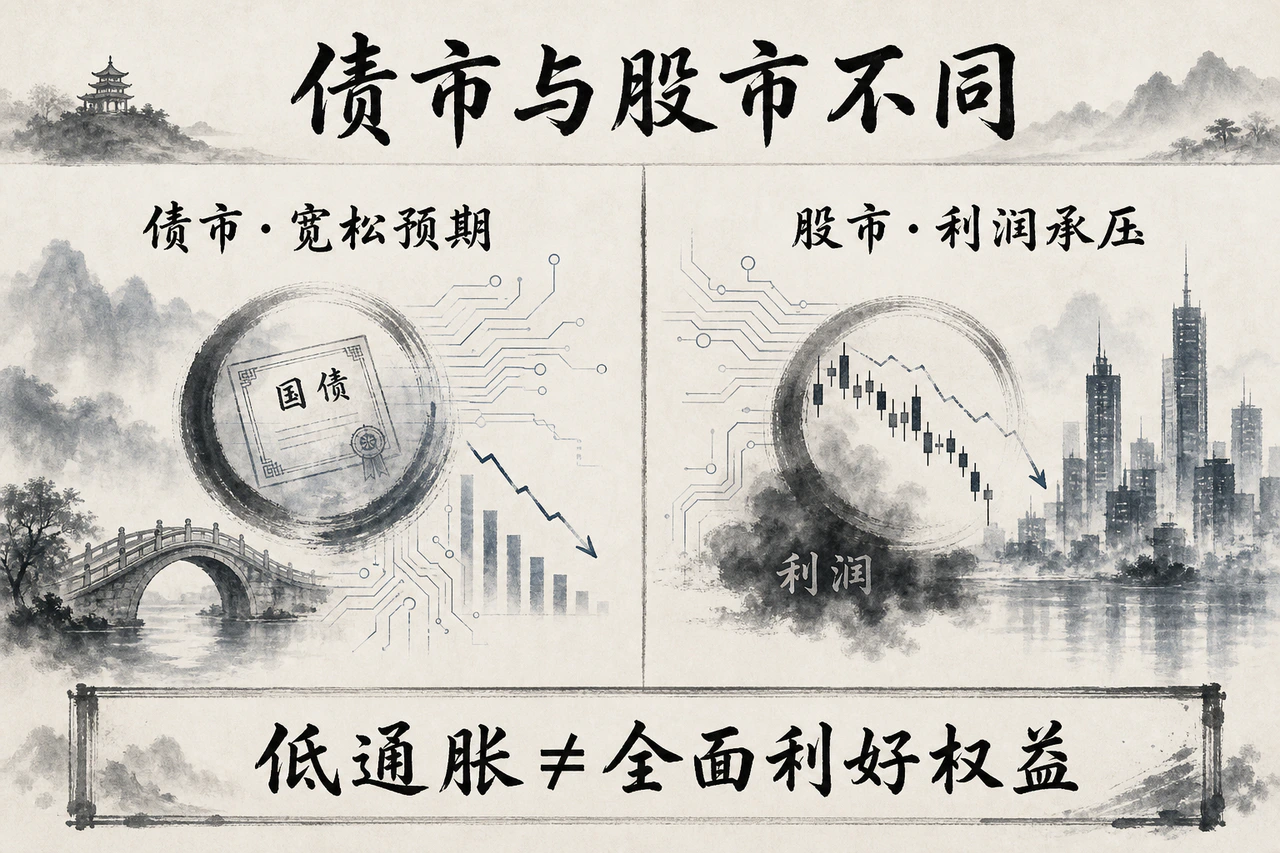
The same price signals generate opposing pricing mechanisms across the two asset markets.
For bonds:
Simultaneously weak monthly CPI and PPI appear to provide the strongest backdrop for scarce investable assets and falling rates. Weak fundamentals encourage bets on policy-rate and reserve-requirement cuts and enthusiasm for long and ultralong sovereigns. Long yields cannot fall without limit, however. Once desks interpret lower prices as systematic slowing in nominal growth, business earnings and fiscal receipts, credit compensation must reprice. Lower benchmarks may coexist with nonlinear curve changes and sharply diverging spreads for local financing vehicles, private firms and weaker borrowers.
For equities:
Low prices can theoretically reduce risk-free discount rates, but in weak nominal-growth cycles small denominator support is often overwhelmed by collapsing numerator earnings. Falling prices directly damage most listed firms' revenue growth and gross margins. Market divergence can become extreme: money avoids overcapacity, price wars and traditional processors and durables where output fails to generate revenue or profit, concentrating instead in three categories:
- Dividend assets backed by absolute supply constraints and nonreplicable resources;
- Essential consumption and basic services with independent pricing power and strong cyclical resilience;
- Selected beneficiaries of subsidies, equipment upgrades and trade-ins, plus advanced manufacturers whose substantial technical lead and productivity offset price pressure.
5. Policy Must Repair the Feedback Loop, Rather Than Merely Prevent Negative Annual Readings
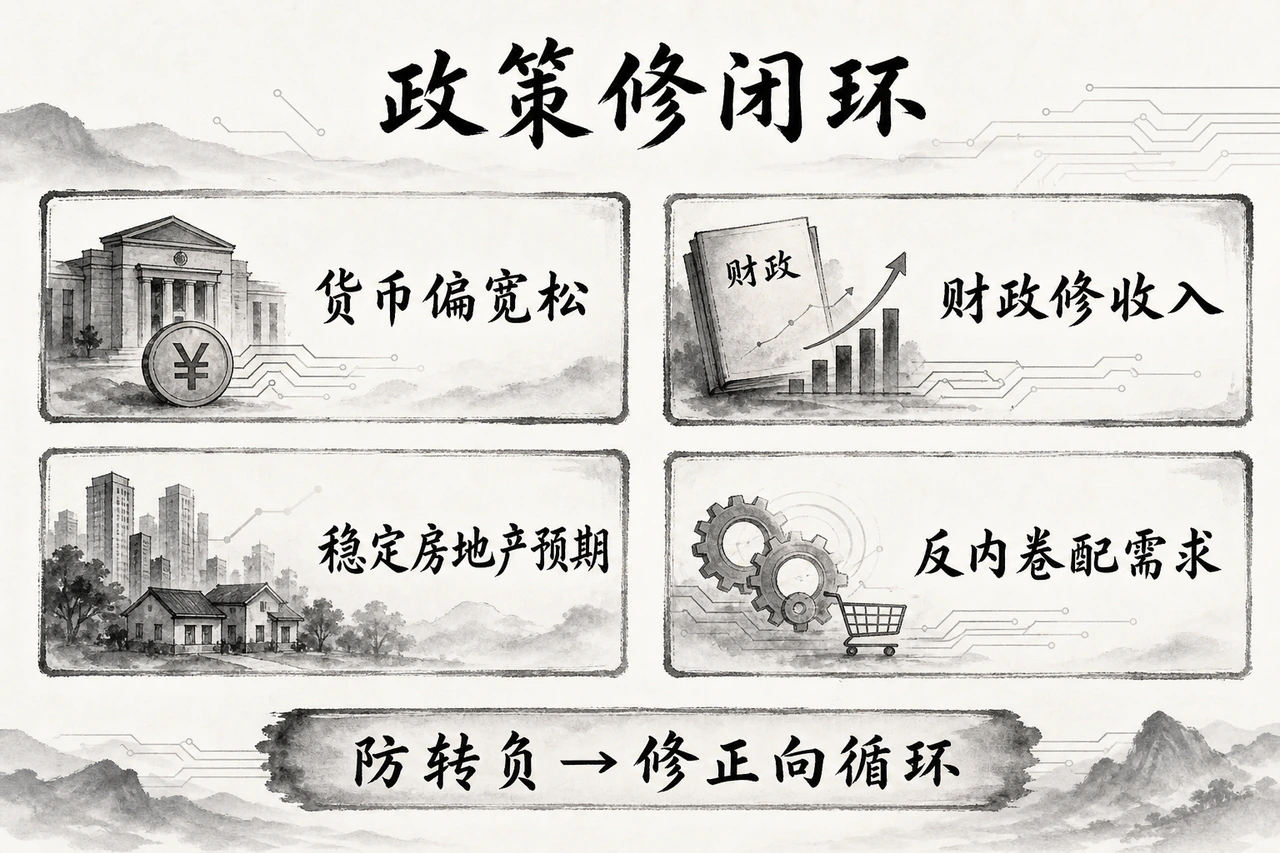
July weakness cannot be dismissed as overseas oil, hog and fruit volatility, nor can positive annual readings justify overlooking the deeper demand shortage reflected in rents, vehicles and collapsing downstream prices.
Policy's anchor must fundamentally change: from defending the numerical red line of one month's negative annual CPI or PPI to actively restoring positive feedback among disposable income, company profits and effective final demand.
Monetary scope and limits:
Persistent monthly declines indicate no demand-pull inflation threat, but hidden restraint from high real rates. Allowing for currency expectations and bank margins, there is substantial room to lower MLF and reverse-repo rates and guide symmetric reductions in LPR and deposit rates. Yet easing alone cannot create buying power without income expectations and profitable orders; excessive dependence on cuts risks a liquidity trap of funds circulating within intermediaries.
Fiscal policy must shift from production investment toward incomes and demand.
Resources should move from supply-side projects and factories toward household income, social protection and final consumption: targeted central transfers for lower- and middle-income disposable income; higher basic pensions and medical assistance to reduce precautionary saving; support for broadly accessible service consumption; settlement of government and state-enterprise arrears to private businesses; and lower hidden institutional costs. Only fuller household budgets and greater security can turn isolated rigid-service inflation into broad domestic-demand support.
Repairing property balance sheets is decisive for expectations.
Weak housing and rents show continued contraction in wealth expectations and credit. Stabilization must go beyond monthly resale transactions in a few cities, combining stable land and home-price expectations, faster local state-enterprise acquisition of unsold homes, resolution of strong leading developers' default risks and prevention of expected household wealth losses. This should move property smoothly from financial speculation toward modern housing needs and high-quality services.
Supply-side anti-involution must coincide with stronger demand.
Banning cheap sales without stronger consumption or orders leaves firms unable to sell either volume cheaply or products at higher prices, harming utilization and jobs. The solution combines real consumption and stable infrastructure and advanced-manufacturing orders with market-based exit and bankruptcy reorganization for ineffective zombie capacity, while curbing repetitive local subsidies and unproductive investment in business-attraction campaigns.
Conclusion: The Test Is the Nominal-Growth Feedback Loop
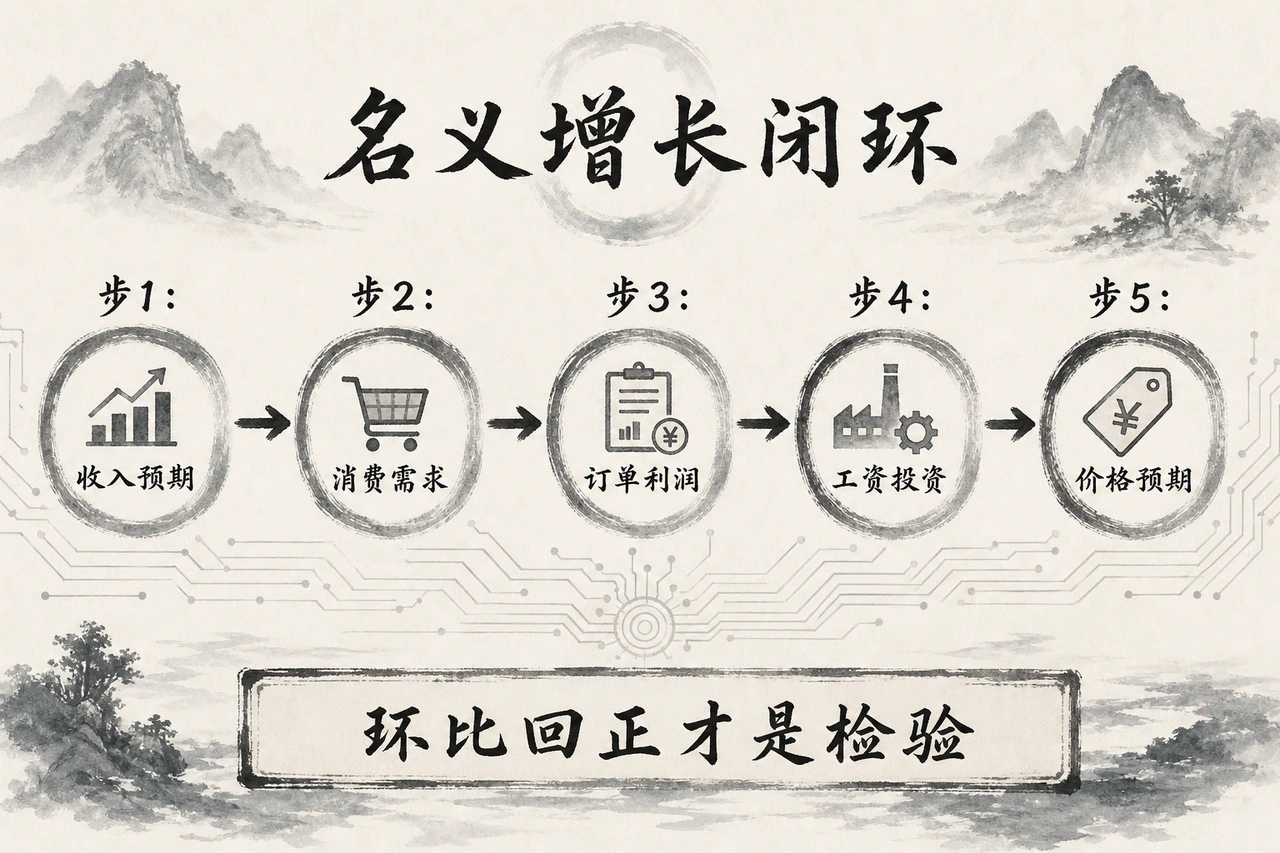
The crucial May–July 2026 signal was not whether aggregates crossed zero, but widening divergence between annual base-effect appearances and current momentum. CPI fell monthly three times; PPI turned negative in June and reached -0.7% in July, despite retaining +3.5% annually.
The question has deepened beyond simply escaping deflation: can a slight price recovery actually produce sustained disposable-income growth, systematic industrial-margin repair and healthy balance-sheet expansion across the real economy?
Prices express income distribution, returns on capital and debt-service capacity rather than passively annotate growth. Persistent weakness in goods, rents and assets means nominal revenue lags output, wage expectations lag apparent employment stability and taxes lag real activity. Lower prices increase real debt burdens, making depreciation and bank interest harder to cover with margins. Resilient real growth therefore cannot imply an automatically improving lived experience.
The danger is a prolonged hidden tightening trap of growing real output, persistently weak nominal prices and passively rising real debt burdens. Unlike a sudden severe deflationary depression, it acts as a chronic illness through slowly bleeding profits, stagnant pay, forced deleveraging and self-reinforcing expectations—a deeper long-run constraint that a few rate cuts cannot resolve.
Whether monthly CPI and PPI turn sustainably positive in coming quarters is a stress test for China's economy: can passive repair sustained by policy floors and low bases give way to endogenous growth driven by income, effective demand and real profits?
A self-reinforcing chain must operate clearly:
Better job quality and income expectations → stronger final consumption → more orders and recovering margins → higher pay and effective capex → stabilized price expectations and nominal growth.
If large productive capacity and fiscal resources are directed precisely toward household purchasing power, May–July weakness will be a temporary setback. If new capacity remains the answer to old excess capacity while incomes and demand lag, positive annual readings may persist briefly, but lived conditions, margins and long-term debt sustainability will bear increasingly heavy pressure.
(Main sources: official May–July 2026 monthly CPI/PPI releases and explanations; verifiable public material through August 10, 2026. Working draft: reports/cpi-ppi-weakening-may-july-20260810.md.)


