On October 23, spot gold fell below $4,000 an ounce during trading. Using a consistent spot closing-price series, gold had declined from $4,657.12 on August 25 to $4,024.33 on October 22, a cumulative drawdown of about 13.6% over two months. Most of the correction occurred between late August and the end of September, when prices fell a combined 10.7%. Gold largely consolidated in a narrow range near its lows during the first 21 days of October, before falling another roughly 2.8% on October 22 alone.
A review of the move reveals clear differences between the forces behind each phase of the decline: The main selloff from late August through September was driven primarily by mounting expectations of Federal Reserve tightening. Rising real Treasury yields and a stronger dollar increased the cost of holding gold. Meanwhile, although China's central bank continued adding to its reserves and global gold ETFs continued attracting net inflows, managed money in futures steadily reduced its net long positions, while physical buyers waited for lower prices. Gold had to fall to find a new balance between different types of holders and prospective buyers.
The sharp decline on October 22 was more complicated. Real Treasury yields and the dollar both ultimately fell that day, yet gold dropped heavily. Holdings at the world's largest gold ETF, SPDR Gold Trust (GLD), also contracted sharply in a single day. This establishes that the fund's gold holdings were shrinking, but the available daily data cannot identify the specific event that triggered that day's selling.
1. How August's Nearly 15% Rally Reversed: Hawkish Signals Revived Rate-Hike Expectations, and September Tightening Lifted Real Yields

During August's rally, gold benefited from a relatively favorable macroeconomic backdrop. From August 3 to 25, the 10-year real Treasury yield fell from 2.43% to 2.32%, the dollar index declined about 1.0%, and spot gold surged approximately 14.9%. GLD's gold holdings increased by a substantial 42.48 tonnes over the same period. A lower opportunity cost of holding gold and an influx of investment buying jointly propelled the rebound.
The turning point came on August 28. At the Jackson Hole central banking symposium, Fed Chair Warsh said the US labor market remained solid and overall financial conditions could hardly be described as restrictive. Although some inflation readings over the summer had been better than expected, he did not believe the underlying inflation trend had improved materially. The policy message was clear: a brief run of moderate inflation data was not enough for the Fed to declare its inflation fight over.
Interest-rate markets responded quickly to the hawkish signal. According to Reuters' reporting that day, the probability of a September rate increase implied by interest-rate futures jumped from roughly 40% before the speech to around 60%. On August 28, the 10-year real Treasury yield rose 8 basis points, the dollar index gained about 0.56%, and spot gold closed approximately 2.95% lower. The shift in expectations following the policy communication was consistent with the direction of the day's moves in Treasuries, the dollar and gold.
On September 16, the Fed raised rates by 25 basis points as expected, lifting its policy target range to 3.75%–4.00% and delivering the tightening that markets had increasingly anticipated since late August. The decision was not wholly unexpected: gold had already been reassessing the future policy path.
Toward the end of September, rebounding energy prices and persistently high expectations of further rate increases delivered another combined shock. On September 28, disagreements over a resolution to the Middle East conflict drove international oil prices higher. Reuters reported during European trading that markets were assigning a probability of around 70% to another Fed rate increase in October, while spot gold was down more than 3% intraday. Gold ultimately closed about 3.94% below the previous session, the 10-year real Treasury yield rose 7 basis points, and the dollar strengthened. GLD's gold holdings, however, rose by 4.28 tonnes against that backdrop, showing that the day's sharp selloff was not accompanied by a net reduction in that fund's holdings.
Warsh's August 28 speech directly increased the expected probability of a rate hike, while the September 28 rebound in oil and rise in real yields occurred against already elevated tightening expectations. Together, this evidence favors monetary-policy and interest-rate repricing as the leading explanation for gold's late-August-to-September drawdown, rather than simply profit-taking by long investors. Closing profitable positions may amplify volatility, but it cannot explain a systematic upward shift in Treasury rate pricing. Macroeconomic rate repricing explains the trend over a period; it does not mechanically dictate every daily move. Gold, for example, rebounded on September 29 even as real yields and the dollar continued edging higher.
| Period | Change in US-dollar spot gold | Change in dollar index | Change in US 10-year real yield | Change in GLD gold holdings |
|---|---|---|---|---|
| August 25–31 | -4.72% | +0.49% | +12 basis points | -5.99 tonnes |
| August 31–September 30 | -6.31% | +2.06% | +49 basis points | +13.34 tonnes |
| September 30–October 21 | -0.43% | +0.23% | -17 basis points | +1.92 tonnes |
| October 21–22 | -2.78% | -0.07% | -12 basis points | -11.98 tonnes |
Note: Gold and the dollar index use their respective daily closing-price series. Yields are from the US Treasury's constant-maturity curve, and GLD figures are from its official daily gold-holdings records.
The role of macroeconomic repricing can be understood through the following relationships. Inflation and policy signals shape expectations of the future interest-rate path; rising real yields and a stronger dollar reduce gold's relative appeal as a portfolio asset. Position changes by different types of investors may respond to macroeconomic information, but may also reflect feedback from falling prices. Policy expectations, interest and exchange rates, and investor positions are not three independent shocks that can simply be added together. The available information also does not establish the complete transmission sequence for the same set of accounts.
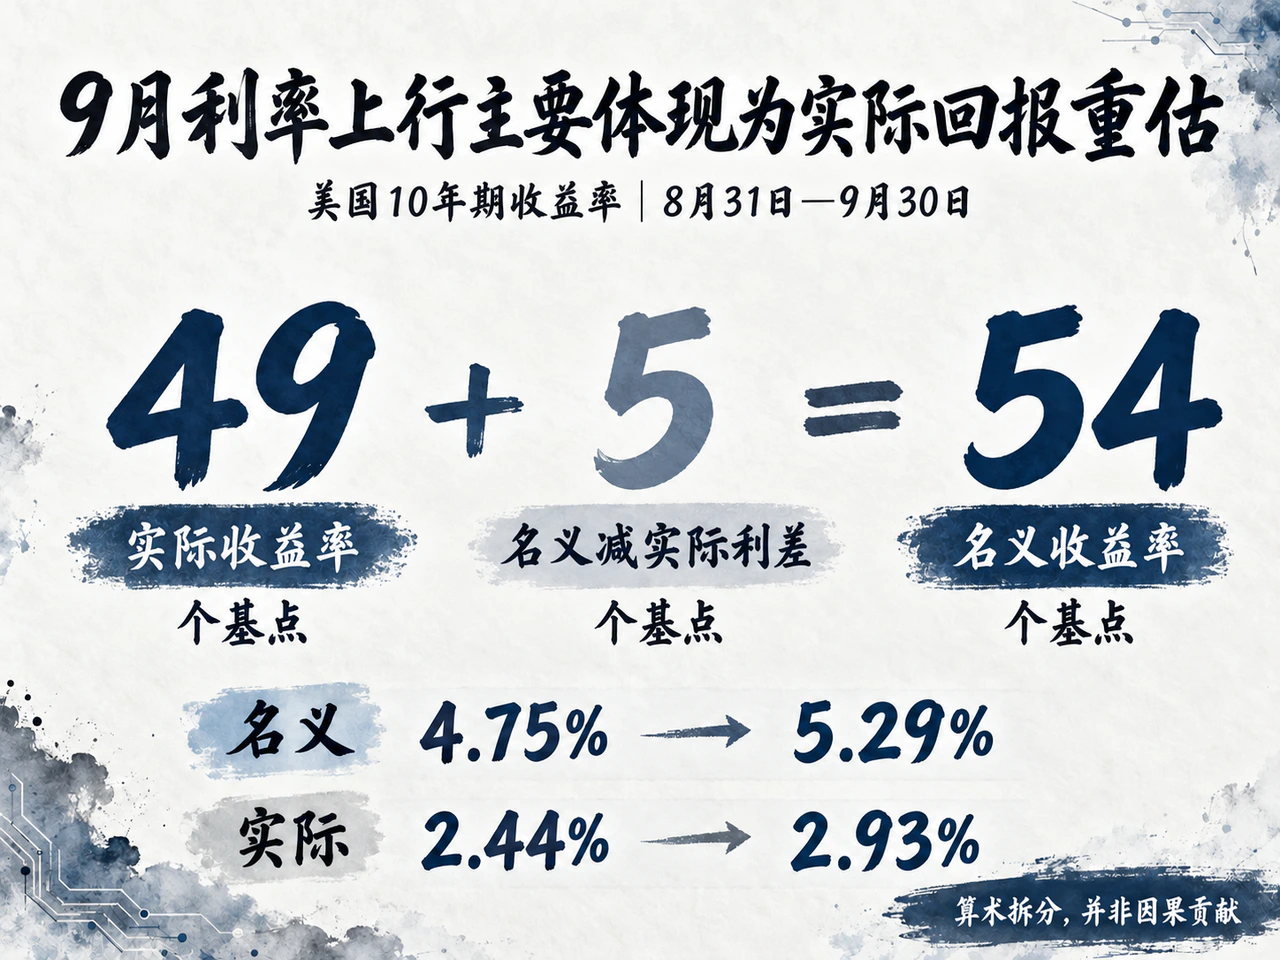
2. Real Treasury Yields Jumped 49 Basis Points in September, Raising Holding Costs and Pressuring Valuations
Understanding why gold fell in September despite inflation concerns requires returning to three basic dimensions of gold pricing. The first is the return on alternative assets: the income from bonds and other interest-bearing assets forgone by holding non-interest-bearing gold, or its opportunity cost. The second is gold's own value to its holders, including inflation protection, diversification of foreign-exchange reserves, and the availability of the asset in an extreme crisis. The third is compensation for bearing gold-price risk. When risk appetite or investors' capacity to absorb risk declines, even long-term investors who still value gold in a portfolio will often demand a lower purchase price.
These three forces do not always point in the same direction. Persistent inflation or rising fiscal risk can enhance gold's appeal as a store of value and safe haven. But if the same shock forces central banks to tighten more aggressively, real returns on interest-bearing assets may also jump, while greater market volatility may reduce some investors' willingness to hold positions. Gold prices therefore are not a simple reflection of the Consumer Price Index (CPI), and heightened demand for safety does not automatically imply rising gold prices.
The composition of September's Treasury-yield increase makes the scale of real-return repricing clear. The nominal 10-year Treasury yield rose from 4.75% to 5.29%, an increase of 54 basis points. Over the same period, the 10-year real Treasury yield climbed from 2.44% to 2.93%, up 49 basis points, while the gap between nominal and real yields widened by only 5 basis points. Both that gap and Treasury Inflation-Protected Securities (TIPS) yields themselves incorporate factors such as term premiums and liquidity compensation. Even so, this decomposition clearly shows that most of September's jump in nominal Treasury yields came from higher real yields, rather than increased inflation compensation.
The repricing extended across maturities. The nominal 2-year Treasury yield also rose 54 basis points in September, while the 5-year real yield jumped 55 basis points. Fiscal-deficit concerns and demand for physical capital can also push up long-term rates. Yet the simultaneous large increases at the short and intermediate parts of the curve, combined with late August's hawkish communication and September's rate increase, confirm a broad reassessment of tighter monetary policy and higher real returns on capital.
For gold, a sharp increase in real Treasury yields means that unless its own safe-haven or store-of-value premium rises in parallel, buyers must obtain higher prospective returns by paying a lower entry price. With the dollar index also rising about 2.1% in September, dollar-denominated interest-bearing assets became materially more attractive. The simultaneous rise in real rates and the dollar increased gold's opportunity cost and supplied the central macroeconomic explanation for this phase of its decline. The mechanism was not simply that rising inflation was bad for gold.
Long-term strategic reserve demand can cushion pressure from real rates to some extent, but that cushion is uneven across trading periods. European Central Bank research notes that central-bank purchases have accounted for a significantly larger share of total gold demand in recent years. Official reserve managers place greater weight on foreign-exchange diversification and asset availability under extreme geopolitical conditions; their allocation objectives differ from the yield comparisons made by private financial investors. Because the buyer mix changes, gold's sensitivity to real yields is not fixed. There is no constant duration that mechanically converts a 49-basis-point rise in real yields into a particular percentage decline in gold.
Assessing the next stage also requires distinguishing the absolute level of interest rates from changes at the margin. Other things equal, higher real yields imply a lower equilibrium gold price. But a price adjustment accompanying the rise in yields had already occurred from late August through September. The fact that current real yields remain above their August lows does not, by itself, imply that gold will automatically keep falling. Its next move depends on whether future rate expectations are revised higher again and whether the composition of demand for gold changes further at the margin.
3. Central-Bank Purchases and ETF Inflows Fail to Halt the Decline: Futures Net Longs Fall 26%, and Diverging Buyers Demand Lower Entry Prices
Gold is an asset with a very large outstanding stock. Its pricing depends not only on who absorbs current flows of newly mined and recycled gold, but also, more fundamentally, on whether existing holders are willing to retain their positions. When some investors decide to reduce gold exposure, the market must find buyers to take the other side. The eventual clearing price depends on the price at which those buyers are willing to enter.
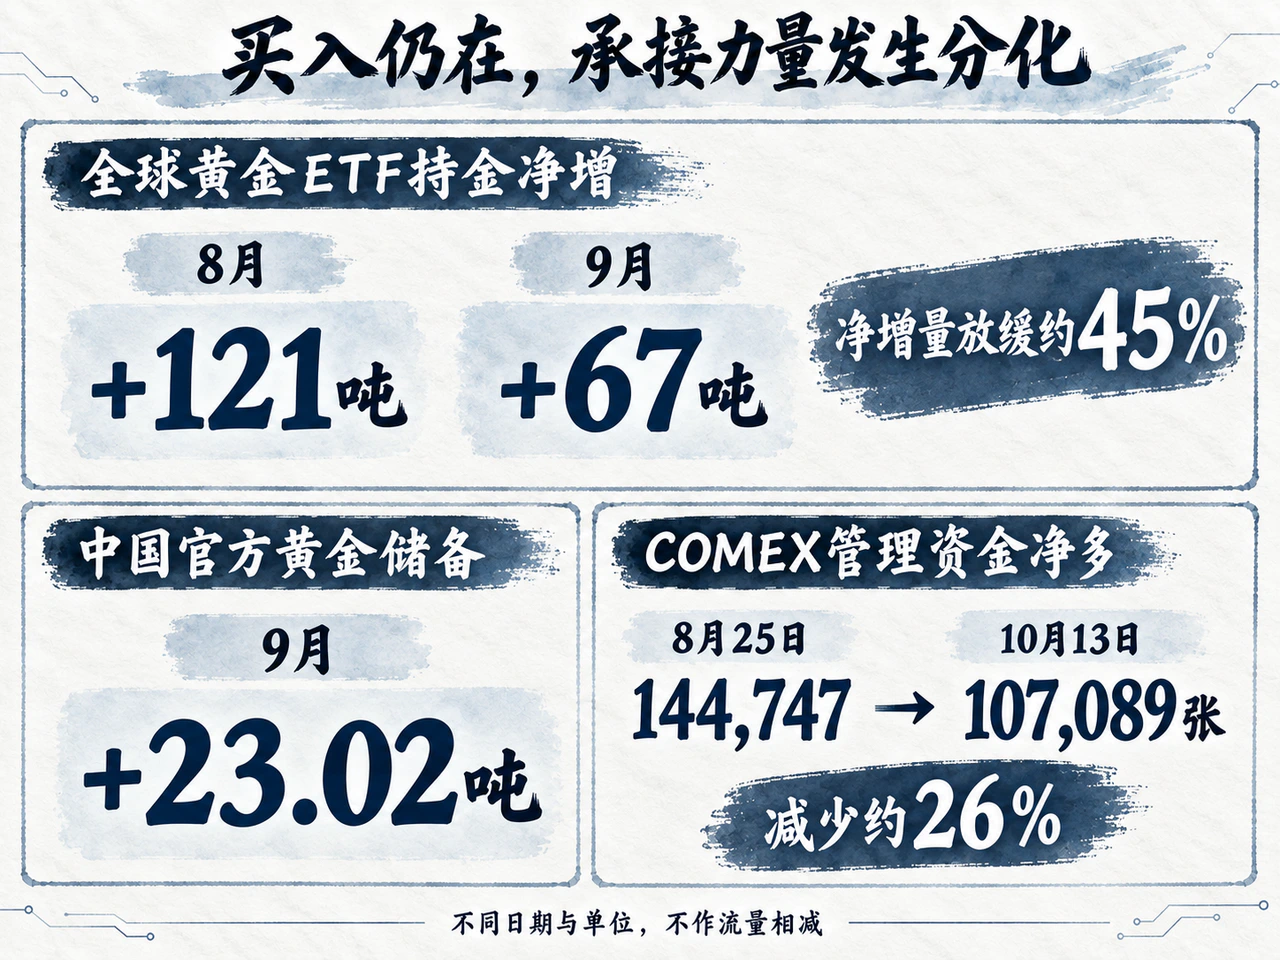
The buyer base has diverged markedly during this correction. Official reserves and ETF channels have continued adding holdings. China's official gold reserves reached 77.47 million ounces at the end of September, up 740,000 ounces, or approximately 23.02 tonnes, from the previous month; third-quarter additions totaled about 63.14 tonnes. After increasing by 121 tonnes in August, global gold ETF holdings added another net 67 tonnes in September, bringing total holdings to 4,256 tonnes. Continued central-bank purchases and ETF net inflows distinguish this correction from a broad retreat from gold allocations.
Continued net buying, however, does not mean stronger buying support. Global gold ETFs' net additions in September were about 45% smaller than in August, showing a clear slowdown in the amount being absorbed through ETFs. At the same time, managed money's net bullish futures exposure continued shrinking. US Commodity Futures Trading Commission (CFTC) data show that managed-money net long positions in COMEX gold futures declined for seven consecutive reporting weeks, from 144,747 contracts on August 25 to 107,089 on October 13, a reduction of about 26%.
A closer breakdown of futures positioning, using gross positions that include both legs of paired spread trades, reveals different behavior across individual weeks. From September 29 to October 6, the contraction in managed-money net longs mainly reflected a reduction in gross long positions. In the following week, October 6–13, it mainly reflected an increase in gross shorts. Because these statistics include directionally neutral spread trades, and new short positions may also hedge cross-asset portfolios, falling futures net longs cannot simply be equated with earlier bulls taking profits or forced liquidation. Changes in ETF gold holdings record allocations to physical gold, whereas futures positions reflect derivatives investors' choices of risk exposure. These are different market dimensions and cannot simply be subtracted to calculate a supposed physical supply-demand shortfall. Their divergence nevertheless shows that different investor groups are making different risk choices.
Physical consumption and wholesale demand are more sensitive to price levels and purchasing power. Shanghai Gold Exchange withdrawals totaled 92 tonnes in September. Although lower prices and pre-holiday restocking drove a 48% month-on-month rebound, withdrawals were still 22% lower than a year earlier. Third-quarter withdrawals totaled 234 tonnes, approximately 44% below the average for the same period over the past decade. This wholesale indicator suggests that physical demand, previously depressed by high prices, recovered somewhat as prices fell, but overall buying support remained weak. Official reserve purchases, ETF allocations and physical consumption operate under different budget constraints and performance objectives, so uneven strength across the three is entirely consistent.
This also explains why gold can fall substantially even while central banks and ETFs remain net buyers. Investors continuing to add gold may be unwilling to absorb all the exposure being offered at the previous price. A lower price can attract price-sensitive buyers and facilitate another transfer of holdings. Some of the buying recorded through particular channels in September may, in other words, have been demand elicited by the price decline itself.
Historical comparisons help characterize the current market. In September 2023, with real Treasury yields and the dollar both rising, global gold ETFs reduced holdings by a net 59 tonnes. Under similar macroeconomic headwinds in September 2026, global ETFs still recorded net inflows of 67 tonnes. The direction of ETF buying was distinctly different in the two episodes. Looking further back to 2013, global gold ETFs experienced sustained heavy withdrawals, releasing approximately 881 tonnes of gold over the year. Although lower prices spurred a sharp increase in global demand for jewelry, bars and coins, the dollar gold price still slumped 27% that year. History suggests that once financial investors who hold the existing stock turn to persistent selling, physical consumers may require much larger discounts before becoming the ultimate buyers.
September 2026 did not see an aggregate ETF retreat like that of 2013. Whether this correction remains a temporary valuation adjustment or develops into a deeper trend reversal depends substantially on whether allocation investors such as ETFs switch from net inflows to broad and persistent net outflows. A single large ETF's one-day reduction on October 22 is insufficient to establish a reversal in that long-term structure.
4. Gold Falls 2.8% Against the Direction of Real Yields on October 22: GLD Loses Nearly 12 Tonnes in a Day, but the Selling Trigger Remains Unconfirmed
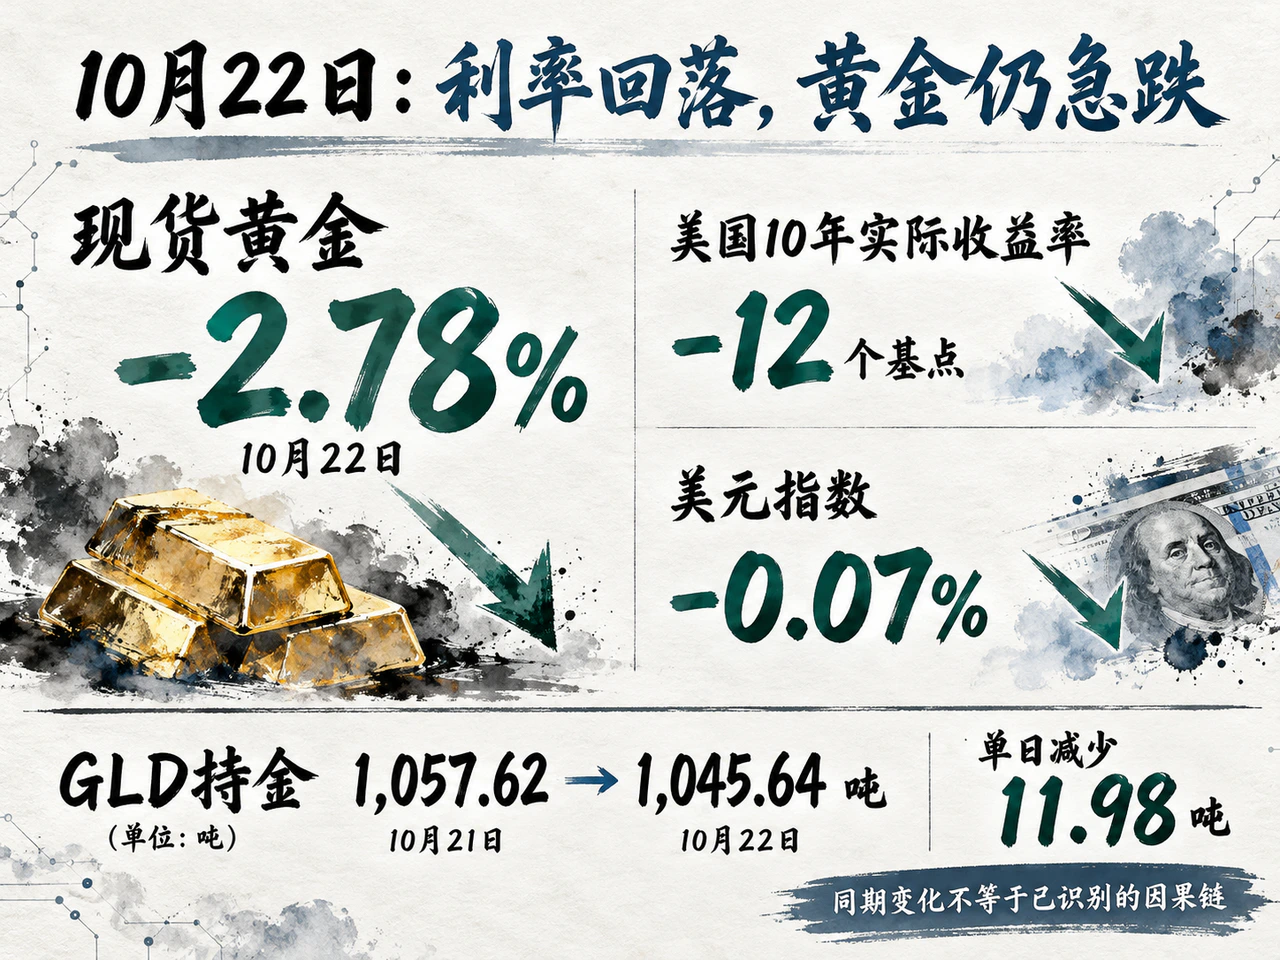
Unlike the late-August-to-September decline dominated by rising real rates and a stronger dollar, the October 22 selloff unfolded amid a more complex cross-market shock. Gold had already weakened during Asian trading, when rising oil prices and the risk of further Fed rate increases were in focus. Reuters' 03:33 GMT market snapshot showed spot gold down about 1.1%. During US equity trading, concerns over the returns on artificial-intelligence (AI) capital spending intensified and battered technology shares. The Nasdaq Composite closed 2.6% lower and the semiconductor index plunged 6.7%, while the Dow Jones Industrial Average edged up 0.02%. Treasuries strengthened at the same time. By the close, the 10-year real Treasury yield was down 12 basis points and the dollar index had slipped about 0.07%, but spot gold's full-day loss had widened to approximately 2.78%.
Early pressure from tightening expectations was followed by a repricing of equities and bonds during the US session. The full-day declines in real Treasury yields and the dollar failed to provide their usual valuation support for gold. Meanwhile, GLD's official records show its gold holdings falling abruptly from 1,057.62 tonnes to 1,045.64 tonnes on October 22, a one-day reduction of 11.98 tonnes, or about 1.13%. Trading volume rose to approximately 17.54 million shares, 2.39 times the median of the preceding 20 trading days. This major gold-investment vehicle thus experienced both a substantial contraction in gold holdings and active turnover.
The available daily trading data do not establish GLD's high-volume reduction as the initial trigger for the October 22 gold selloff. ETF redemptions could represent active selling that pushes gold lower, a passive response to a price breakdown, or exposure to the same cross-asset shock affecting gold. The hypothesis that collapsing technology shares triggered margin calls and forced institutions to sell liquid gold holdings for cash likewise lacks independent evidence from account flows, cash flows or financing constraints. Routine adjustments to multi-asset risk budgets, liquidation to meet margin calls, and deliberate cuts to strategic gold allocations have very different implications for how persistent the subsequent price move may be. Gold's liquidity alone cannot reveal the true motive behind that day's selling.
What is established for October 22 is that gold fell sharply despite declining real yields, alongside a high-volume reduction in GLD holdings. The primary trigger and internal feedback mechanisms behind the selling still require more granular evidence. This calls for care in judging the near-term outlook. September's macroeconomic explanation of tightening repricing cannot be mechanically applied to this particular day, and there is not enough evidence to label the move a temporary technical deviation that will quickly reverse once a liquidity squeeze ends.
5. $4,000 Offers No Established Margin of Safety: The Outlook Depends on Real-Rate Direction and the Breadth of ETF Selling
Overall, the main gold drawdown from late August through September is best understood as a repricing of the Fed's tightening path and real returns on capital. The jump in rate-hike expectations after the August 28 Jackson Hole speech began the reversal. September's rate increase, the late-month oil rebound, and persistently elevated pricing of further hikes sustained the macroeconomic pressure. China's central bank and global gold ETFs continued absorbing holdings, but managed money kept reducing net futures longs and physical wholesale buying support remained weak. Lower prices allowed holders with different risk preferences to exchange positions at reduced valuations. This was a valuation reassessment accompanied by a deeply divided buyer base; the evidence does not yet support a wholesale reversal in the long-term case for allocating to gold.
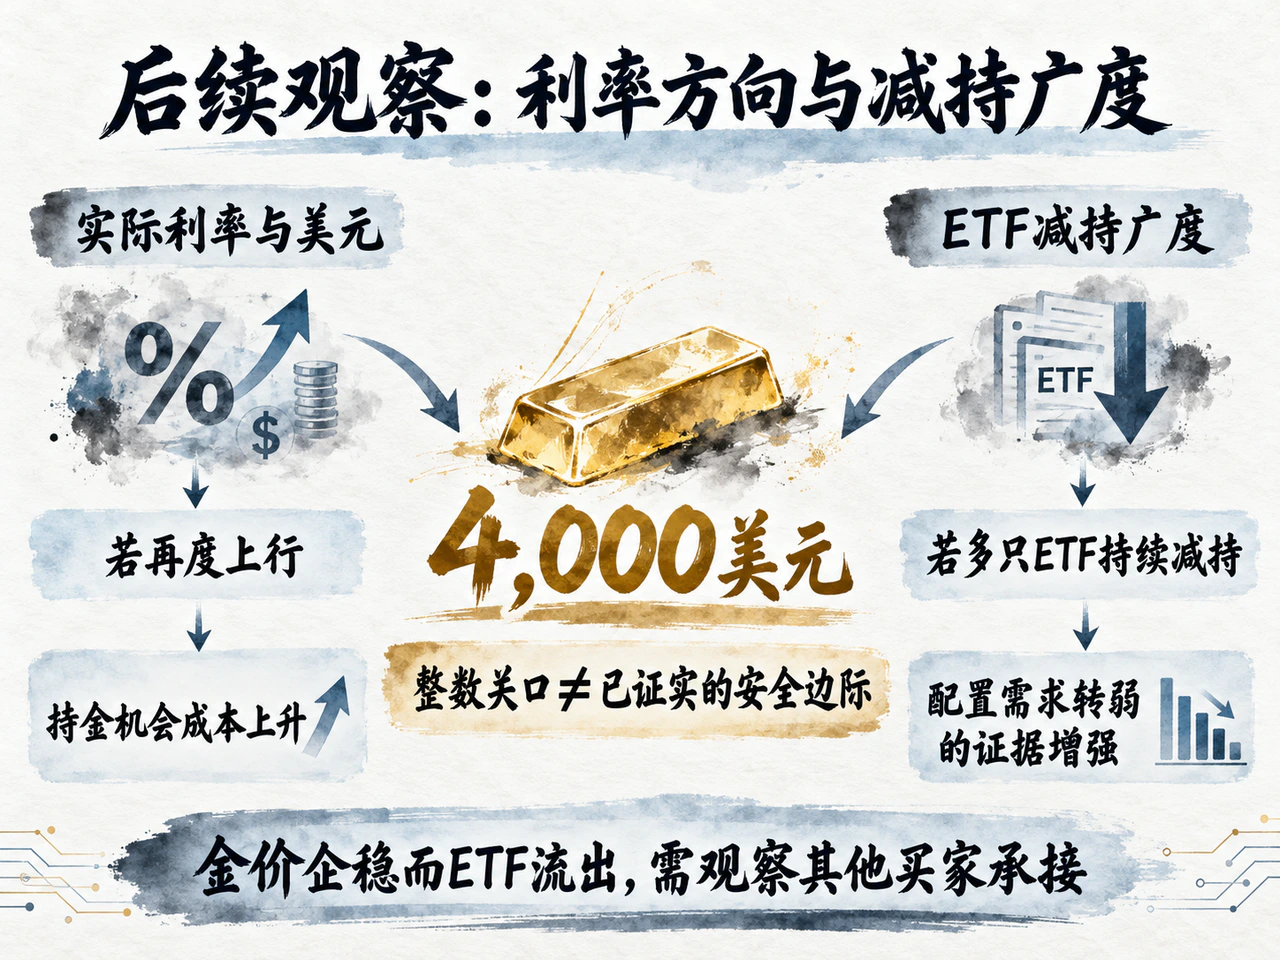
Looking ahead from the current position, whether gold's correction deepens depends on two developments: macroeconomic interest-rate expectations and the breadth of investor selling.
First is the marginal direction of macroeconomic opportunity costs. By October 22, the 10-year real Treasury yield had fallen a cumulative 29 basis points from the end of September, easing some of the pressure from its earlier rapid rise. If US employment or inflation data, or Fed communications, push real yields and the dollar higher again, gold will face renewed headwinds from rising holding costs. Conversely, if real rates and the dollar continue declining but gold remains weak despite that favorable backdrop, an explanation based solely on macroeconomic rates will become less persuasive. Changes in demand or trading constraints will then warrant greater attention.
Second is the breadth and persistence of institutional selling. If GLD's one-day reduction on October 22 spreads into sustained net outflows from several major gold ETFs, accompanied by a further contraction in managed-money net longs in COMEX futures, it would strengthen the case for broadly weakening allocation demand. The futures breakdown would also need to distinguish between declining gross longs and rising gross shorts. Conversely, if gold gradually stabilizes while ETF outflows continue with a lag, other buyers may be absorbing the supply, or fund flows may be following prices. ETF outflows would then be a poor basis for simply extrapolating further declines.
For portfolio allocation, central-bank purchases and gold's role as a strategic reserve asset can support long-term demand, but cannot guarantee protection against short-term price fluctuations. The closely watched $4,000-an-ounce threshold is primarily a psychological trading anchor. There is currently insufficient valuation evidence to regard it as an unbreakable margin of safety. Whether Fed tightening expectations rise again, whether ETF selling becomes more widespread, and whether lower prices attract substantive physical and allocation buying will together determine whether this correction gradually develops into a volatile bottoming process or becomes a more persistent contraction in allocations.
Click Read Original for the full details.


