As of October 21, 2026
1 Core views
The repricing of French sovereign spreads has moved beyond short-term political shocks to the fiscal trajectory and medium- to long-term debt-servicing capacity. On October 21, the French-German 10-year spread rose to 157.5bp and France's 10-year yield briefly exceeded 5%. France's relative risk pricing against Italy and Belgium also deteriorated, reshaping the euro area's traditional core/semi-core/periphery hierarchy. The most informative change is the uneven distribution of France's risk premium across maturities: the front end already provides substantial carry compensation, while the long end still bears uncertainty over the budget, ratings and the 2027 presidential election.
Our central view remains a preference for the French front end, caution toward maturities of 10 years and longer, and attention to structural differences along the spread curve. Front-end relative value comes from lower maturity sensitivity, higher carry and roll-down. A long-end recovery depends on a credible fiscal-consolidation path. A historically high percentile alone does not justify mean reversion across the curve; narrowing French spreads require actual improvement in fundamentals and political constraints.
France's central problem is its persistent primary deficit and capacity for fiscal adjustment. The government revised its 2026 deficit forecast to 5.4% of GDP, while the 2027 budget target remains 5.0%. PLF 2027 projects a debt ratio of 121.7% and state-budget debt interest of €72.9 billion. The long average debt maturity slows the transmission of refinancing costs, and recent funding still attracts demand, but that cushion cannot replace medium-term fiscal repair.
The channels through which ECB support and rating changes operate must be distinguished. TPI availability depends on fiscal conditions, debt sustainability and a finding of market disorder; it is unlikely to eliminate fundamentally driven repricing. A possible Moody's downgrade of France would not necessarily change its rating bucket in major sovereign indices. Specific investment mandates, non-EU insurance capital constraints and the effect of rising volatility on leveraged investors deserve greater attention.
Table 1. Strategy assessments and principal research grounds
| Research direction | Strategy assessment | Main grounds and key conditions |
|---|---|---|
| French front-end allocation | Relative preference | 2-year risk compensation is relatively substantial and maturity sensitivity lower; the yield advantage depends on front-end risk not becoming an immediate credit shock. |
| 5-year France-Germany spread | Offers relative value | Carry and tail risk are better balanced than at the long end; budget and rating outcomes determine the pace of recovery. |
| French bonds of 10 years and longer | Remain cautious | Long maturities concentrate fiscal-path and election risk, with relatively little yield compensation per unit of volatility. |
| France-Germany spread curve | Favor steepening | Fiscal premiums are more likely to concentrate in medium and long maturities; if risk shifts toward near-term funding or default, front-end widening could change this assessment. |
| France versus Belgium | Conditional scope for recovery | Deficit levels are similar, but France's additional premium contains more political risk; easing political risk is an important precondition. |
| France versus Italy | Insufficient evidence for mean reversion | French spreads are wider, but Italy has a better primary balance and rating momentum; historical ranking alone cannot justify recovery. |
| Benchmark-relative allocation | Adjust maturity structure | France has a large benchmark weight; a front-end preference and long-end caution better match the sources of this repricing than simple country avoidance. |
Quantitatively, under this report's curve, funding and volatility assumptions, the ratio of yield cushion to estimated volatility is about 1.2 for the 2-year France-Germany spread, 0.68 for the 5-year and 0.31 for the 10-year. The front-end ratio is about four times the long-end ratio, forming the key basis for maturity selection. The portfolio implication is to reduce concentrated French medium- and long-term spread risk and improve allocation using the fiscal and risk characteristics of countries such as Spain and the Netherlands.
2 Market conditions and historical context
2.1 Yield curves and the term structure of spreads
French yields and spreads over Germany are high among the major euro-area economies. The October 20 fitted curves show French spreads of 60bp, 106bp, 146bp and 165bp at 2, 5, 10 and 30 years, respectively—16–38bp wider than Italy and 33–45bp wider than Belgium. The Netherlands remains much closer to Germany, indicating that country differentiation is the primary expression of this repricing.
Table 2. Major sovereign fitted yields and spreads over Germany
| Country | 2-year yield | 5-year yield | 10-year yield | 30-year yield | 2-year spread | 5-year spread | 10-year spread | 30-year spread |
|---|---|---|---|---|---|---|---|---|
| Germany | 3.05% | 3.17% | 3.42% | 3.77% | — | — | — | — |
| France | 3.65% | 4.23% | 4.88% | 5.42% | 60 | 106 | 146 | 165 |
| Italy | 3.49% | 3.98% | 4.50% | 5.05% | 44 | 81 | 108 | 128 |
| Belgium | 3.32% | 3.83% | 4.43% | 4.98% | 27 | 66 | 101 | 121 |
| Spain | 3.25% | 3.54% | 4.04% | 4.52% | 20 | 37 | 62 | 75 |
| Portugal | 3.19% | 3.48% | 3.92% | 4.37% | About 14 | About 31 | About 50 | About 60 |
| The Netherlands | 3.01% | 3.26% | 3.55% | 3.80% | −4 | 9 | 13 | 3 |
Note: Yields mainly use bondScovery's fitted spot curves at the October 20, 2026 close. Spreads are in bp, calculated from rounded yields. Portugal uses Bloomberg bid yields cited by Jornal Económico; its spreads against Germany's fitted curve are approximate. Fitted curves and individual benchmark bonds are different measures.

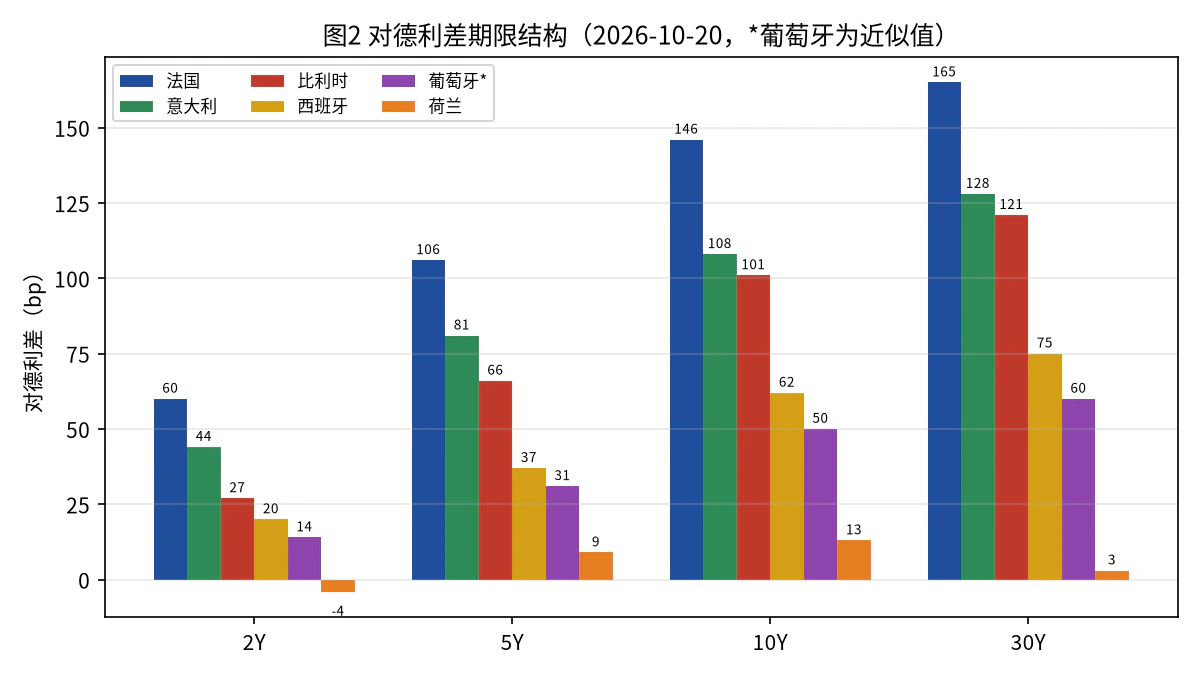
On October 21, France's 10-year yield rose to about 4.99%, briefly exceeding 5% intraday. The France-Germany spread reached 157.5bp, versus 150.8bp a day earlier, widening about 20bp over the week. Italy's 10-year spread was around 115–117bp and Spain's around 64–65bp. Reuters, citing LSEG, reported that France's 10-year yield rose more than 16bp that week, far above the roughly 5.4bp average increase in major economies. France-specific risk was an important source of the adjustment.
The maturity profile reveals the nature of the risk better than a single spread level. France's 2-to-10-year spread-curve slope was 86bp, versus Italy's 64bp and Spain's 42bp. The steeper curve indicates that markets price more risk into medium- and long-term fiscal and debt-service paths. The 2011–2012 peripheral sovereign crisis featured much sharper front-end widening, flattening and even inversion. The current front-end relative-value assessment rests precisely on these two risk profiles remaining distinct.
France's changing ranking against Italy and Belgium also has structural significance. Comparable 5-year bonds show France yielding about 27bp more than Italy and 42bp more than Belgium; at 10 years, France yielded about 38bp more than Italy. The Netherlands' 10-year spread over Germany was just 13bp, widening its distance from France further. France's traditional semi-core status no longer adequately describes current pricing.
2.2 Pricing relative to the swap curve
Measured against the €STR overnight-indexed swap curve, France still provides relatively high compensation among major economies. On October 20, 2-, 5- and 10-year €STR OIS rates were about 3.04%, 3.13% and 3.25%. After maturity interpolation, French yields exceeded OIS by about 56bp at 2 years, 99bp at 5 years and 164bp at 10 years.
Table 3. Bond yields above maturity-matched €STR OIS
| Country | About 2 years | About 5 years | About 10 years |
|---|---|---|---|
| Germany | 8bp | 3bp | 14bp |
| The Netherlands | — | 14bp | 25bp |
| Spain | — | 40bp | 78bp |
| Belgium | — | 67bp | 104bp |
| Italy | — | 82bp | 127bp |
| France | 56bp | 99bp | 164bp |
Note: The table approximates comparable bond yields minus maturity-interpolated OIS at the October 20 close. This helps compare risk compensation but is not a strict asset-swap spread or Z-spread.
German government yields have also turned positive relative to OIS, by about 3bp at 5 years and 14bp at 10 years, reflecting German fiscal expansion and reduced sovereign-bond scarcity. France-Germany spreads therefore include both French credit and political premiums and changes in German asset supply and demand. For institutions whose liabilities are priced at floating rates or against swaps, France's compensation over swaps more directly matches their allocation comparison. French spread and swap-spread risk remain even after benchmark interest-rate duration is reduced.
2.3 Historical percentiles and volatility
Table 4. Important historical phases of the 10-year France-Germany spread
| Period | Main event | Representative level |
|---|---|---|
| 2005–2007 | Euro-area spread convergence | Period average 3.8bp; peak 14bp |
| 2008–2009 | Global financial crisis | March 2009 peak 67bp |
| 2011–2012 | European sovereign debt crisis | November 15, 2011 close: 182bp |
| Second half of 2012 | OMT and expectations of policy support | 127bp in June, falling to 54bp in October |
| 2017 | French presidential election | Peak about 80bp before the first round |
| 2020 | COVID-19 pandemic | March peak 71bp |
| June–July 2024 | Dissolution of the French parliament | Rose from 49bp to about 80bp |
| November–December 2024 | Government no-confidence motion | November peak 87bp |
| 2025 | Government crisis | Period high about 85–87bp |
| January–February 2026 | Before and after passage of the 2026 budget | Period low 59bp |
| September–October 2026 | 2027 budget and fiscal-risk repricing | 157.5bp on October 21; one-year average 78.9bp |
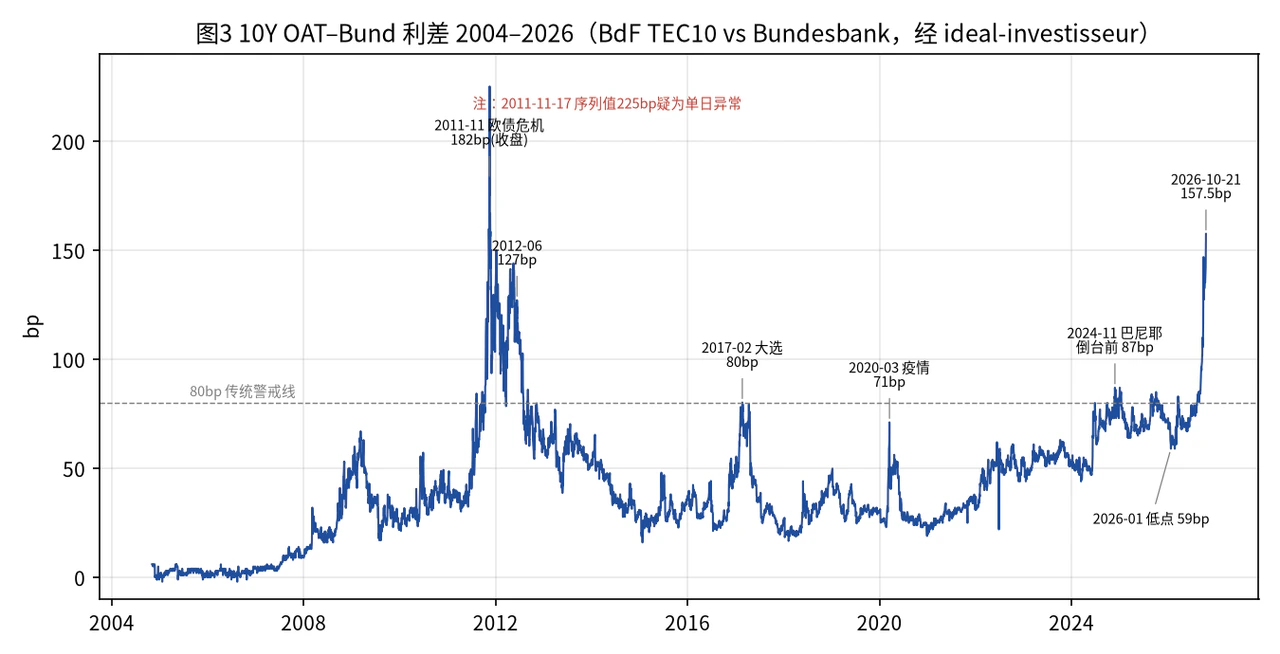
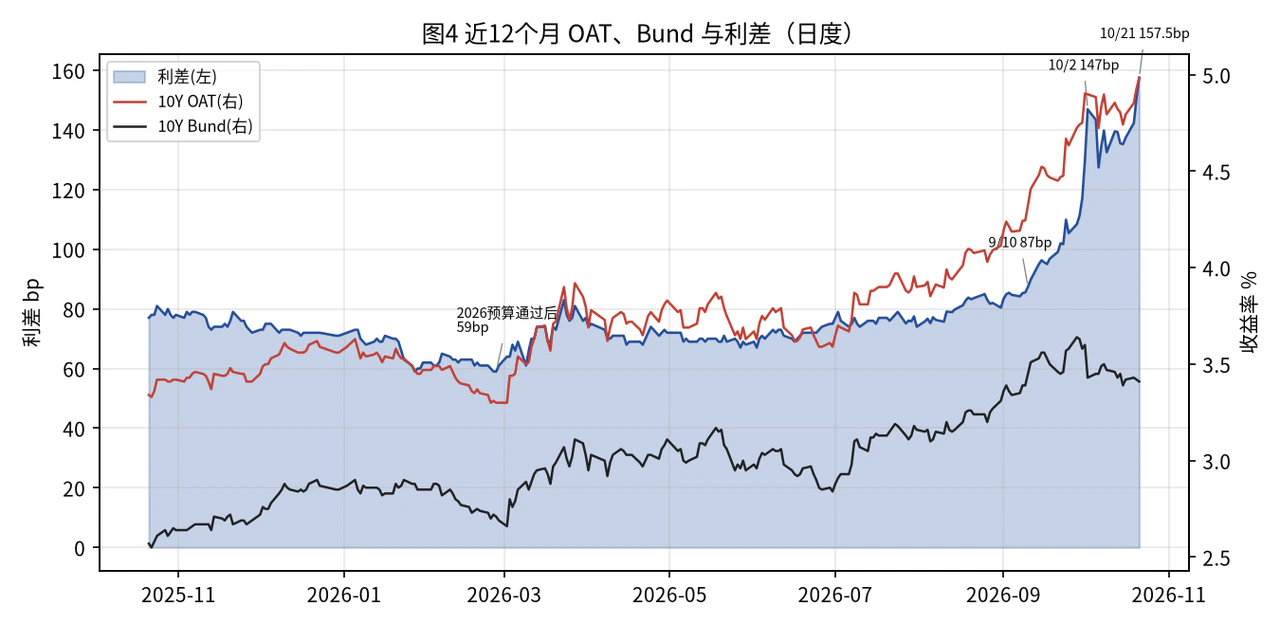
In the daily series from November 2004 to October 2026, 157.5bp is around the 99.9th percentile, well above levels during the 2017 election and 2024 parliamentary dissolution. The series has an isolated 225.1bp reading on November 17, 2011, versus roughly 175bp and 162bp on the neighboring days. Historical peaks and percentiles must be interpreted in light of that anomaly. Current pricing is far outside the normal range of the past decade-plus, but crisis highs are not a stable valuation anchor.
The adjustment's speed deserves greater attention. The spread rose from 87bp on September 10 to 157.5bp on October 21, widening roughly 70bp in six weeks. Realized volatility over 20 days, 60 days and one year was about 7.2, 4.5 and 2.9bp per day, respectively, equivalent to approximately 115, 71 and 45bp annualized. Recent 20-day volatility approached the scale seen during the sovereign crisis in the original series. Historical average volatility consequently explains current risk less well, and carry compensation must be assessed against a higher-volatility environment.
Italy peaked at about 574bp in 2011 and Spain at about 632–640bp in 2012. France remains some distance from a full-scale peripheral funding crisis, but the low-volatility assumption attached to semi-core assets has been seriously challenged. Further research should focus on whether long-end risk remains dominant and whether pressure begins spreading to the front end and other countries.
2.4 France's repricing against Italy and Belgium
French 5-year CDS first exceeded Italy's in September 2025 and has stayed above it since early July 2026. The gap was about 16bp in mid-October. Reordering in both bonds and CDS indicates that France's spread widening extends beyond supply and demand for an individual security.
Fiscal trajectories are the key difference. Italy's debt ratio is still higher than France's, but its 2025 primary balance was already a surplus of 0.8% of GDP, and its 2026 deficit forecast was 2.9%. France continues to run a primary deficit of about 2%–3%, with its debt ratio rising annually. Markets' focus on fiscal adjustment capacity and future debt paths now outweighs a simple ranking of current debt stocks.
Political stability and rating momentum reinforce the divergence. Italy has a relatively stable majority government, while French budgets have repeatedly depended on exceptional procedures. French ratings were under pressure in 2024–2026, while Italy received upgrades or improved outlooks from several agencies. France's 2027 presidential election extends uncertainty over fiscal commitments, making medium- and long-term premiums harder to dissipate quickly.
Belgium has a deficit close to France's and a 2026 debt ratio of about 110.5%, but lacks the same degree of presidential-election risk and issues less debt. France's 5-year yield premium of about 42bp over Belgium contains substantial France-specific political compensation. This creates scope to examine relative pricing, but any recovery must be justified by changes in French risk, rather than similar fiscal numbers alone.
3 Drivers and fundamentals
3.1 Comparing national fiscal trajectories
Table 5. Fiscal and debt indicators for major countries
| Indicator | France | Italy | Spain | Belgium | Germany | The Netherlands | Portugal |
|---|---|---|---|---|---|---|---|
| 2025 fiscal balance | −5.1 | −3.1 | −2.4 | −5.2 | −2.7 | −1.6 | +0.7 |
| 2026 fiscal balance forecast | −5.1 | −2.9 | −2.4 | −5.2 | −3.7 | −2.5 | −0.1 |
| 2027 fiscal balance forecast | −5.7 | −2.9 | −2.0 | −5.4 | −4.1 | −1.9 | −0.4 |
| 2025 government debt ratio | 115.6 | 137.1 | 100.7 | 107.9 | 63.5 | 44.4 | 89.7 |
| 2026 government debt ratio forecast | 118.1 | 138.5 | 99.6 | 110.5 | 65.8 | 46.9 | 87.6 |
| 2027 government debt ratio forecast | 120.2 | 139.2 | 98.9 | 112.8 | 68.0 | 47.0 | 86.0 |
| 2026 real GDP growth forecast | 0.8 | 0.5 | 2.4 | 0.7 | 0.6 | 1.0 | 1.7 |
Note: All figures are percentages of GDP except real GDP growth. Data mainly use the European Commission's spring 2026 forecast; 2027 assumes unchanged policy. In October, France revised its 2026 deficit forecast to 5.4% and real growth to 0.5%. PLF 2027 gives debt ratios of 119.3% and 121.7% for 2026 and 2027 and a 2027 deficit target of 5.0%. Portugal's 2026 debt ratio was 86.7% in the original source's text and 87.6% in its table; this table uses the latter.
France's relative weakness combines low growth, a high deficit and a rising debt ratio. Spain is projected to grow 2.4%, with a deficit near 2.4% and falling debt ratio. Portugal's debt ratio is also declining. Germany has markedly lower debt, but fiscal expansion and greater sovereign supply are changing its pricing against swaps. Euro-area sovereign allocation requires comparison of debt levels, primary balances and growth capacity within one framework.
France and Italy both remain in the excessive deficit procedure. In June 2026, the European Commission determined that effective action had been taken and held the procedures in abeyance. This reduces immediate institutional pressure, but execution of fiscal targets still determines debt trajectories and the credibility of policy support. The IMF's April 2026 Fiscal Monitor forecast France's 2026 deficit at 4.9%, below the government's October revision, showing how fiscal assessments have changed with growth and budget developments.
3.2 Interest burdens and debt dynamics
French state-budget debt interest rose from an executed €51.6 billion in 2025 to a revised €62.6–€63.4 billion in 2026; PLF 2027 puts it at €72.9 billion, close to the €73.2 billion defense budget. Under the national-accounts measure for all government sectors, interest expense rose from €29.7 billion in 2020 to €65.7 billion in 2025. These are different statistical scopes, but both show interest costs squeezing fiscal space.
Rate shocks transmit gradually through refinancing. RESF 2027 estimates that a one-percentage-point rise across maturities adds about €3.4 billion in interest in the first year and €8.1 billion in the second. Tradable debt's average maturity of about 8.5 years slows adjustment of existing debt costs and buys time for consolidation. If high rates persist, that cushion weakens year by year.
The 2027 medium- and long-term issuance plan is €340 billion net of buybacks, up from €310 billion in 2026. Funding requirements are about €339.7 billion, including €179.5 billion of redemptions. The weighted average rate on medium- and long-term issuance in 2026 to date is about 3.55%, versus 3.14% in 2025. Bid-to-cover ratios of around 2.5 for medium- and long-term debt and 3.5 for short-term BTFs show that funding still attracts demand, with markets demanding higher compensation.
Debt-ratio dynamics can be explained jointly by the effective interest rate, growth and primary balance. Nominal estimates put France's 2026 effective rate at about 2.2%–2.4% and nominal growth at about 2.5%–3%, relatively close. The main source of the rising debt ratio remains a primary deficit of around 2%–3%. The central problem is thus a persistent primary deficit and inadequate political adjustment capacity. As new debt costs transmit, rates may further complicate future consolidation.
This mechanism also identifies a route to spread recovery. A credible improvement in the primary balance through the budget would leave substantial scope for repricing. Repeatedly postponed targets and growth below budget assumptions would keep the long end pricing uncertain future adjustment. Smooth near-term funding can coexist with medium- and long-term fiscal pressure, explaining the fundamental distinction between front-end and long-end strategies.
3.3 Political constraints and the budget path
The 2027 budget was submitted on October 1 with a 5.0% deficit target, €43 billion in new measures and €54 billion in total fiscal effort. Progress was slow: by October 19, only 15 of 58 articles had been considered, with more than 2,600 amendments outstanding. The budget minister said adopted amendments had worsened the deficit by about €10 billion. The conflict between fiscal targets and parliamentary support was a direct catalyst for spread widening.
Votes on revenue provisions, the National Assembly's first-reading deadline and the 70-day parliamentary review limit are important milestones over the next two months. If the government cannot pass the budget normally, the political costs of Article 49.3, ordinances and special legislation will rise. The 2026 budget was overwhelmingly rejected at first reading and finally passed in February 2026, while its deficit target slipped from 5.0% to 5.4%. This precedent heightens market attention to the actual enforceability of budget measures.
The parliamentary session is expected to end early on February 28, 2027, with the presidential election's first round scheduled for April 18. The political window for consolidation is therefore short. Willingness to cooperate between the minority government and opposition, street protests and changing electoral commitments may all affect the budget's final size and durability.
Table 6. Budget-political scenarios and medium-term pricing implications
| Scenario | Subjective probability | Budget and political path | Estimated 2027 deficit ratio | 12-month central range for the 10-year spread |
|---|---|---|---|---|
| Limited compromise | 35% | Limited compromise; passage under Article 49.3; government survives | 5.2%—5.4% | 125—145bp |
| Transitional arrangement | 35% | Maintained by ordinance or special law through the election | 5.4%—5.8% | 145—175bp |
| Government falls | 22% | No-confidence motion passes; budget fails; transitional arrangements maintain operations | Above 5.8% | 170—210bp |
| Institutional crisis | 8% | Political crisis compounded by social conflict, rating pressure and expanding fiscal commitments | Above 6% | 220—300bp |
Probabilities and ranges are analyst scenario assumptions. Compared with 2017, the fiscal starting point is weaker, election risk is more about uncertain spending and deficit paths, and sustained net bond purchases are absent. Election premiums are more likely to concentrate in maturities of 10 years and longer in early 2027. The front end is less exposed to accumulated long-term fiscal promises because of its shorter maturity, but remains vulnerable to sudden political shocks.
4 Policy support and ECB constraints
4.1 TPI eligibility and actual activation conditions
TPI is an important institutional tool affecting euro-area sovereign tail risk, but its support for current French spreads depends on specific conditions. The four eligibility criteria published by the ECB in 2022 are inputs to Governing Council decisions and may be adjusted dynamically. France's presence in the excessive deficit procedure does not automatically exclude it.
Table 7. TPI conditions and applicability to France
| Assessment dimension | France's position | Research assessment |
|---|---|---|
| Compliance with the EU fiscal framework | Still in EDP; effective action recognized in June 2026 and procedure held in abeyance | Under the original wording, there remains scope to meet the first criterion; procedural status does not confer automatic support. |
| Absence of severe macroeconomic imbalances | Not subject to an excessive imbalance procedure | This is not currently the principal obstacle. |
| Fiscal sustainability | Rising debt ratio and persistent primary deficit | A key constraint on policy judgment. |
| Sound macroeconomic policies | Implementation of RRF commitments and country-specific recommendations | Policy implementation and the fiscal path affect the overall assessment. |
Market conditions matter more than eligibility. TPI addresses unwarranted, disorderly market dynamics. French spreads have gradually widened with budget and political news and contain clear fundamental drivers; high levels alone are unlikely to establish disorder. Cross-country contagion, abrupt tightening in financing conditions and impaired monetary transmission would be more likely to materially increase the need for ECB intervention.
TPI is therefore closer to a policy option for severe tail risk, with opaque activation conditions. It helps explain the response to extreme cross-country disorder but is unlikely to drive current spread mean reversion. The assessment of relatively lower front-end risk should also rest on fiscal term structure and financing conditions. Policy support remains uncertain in timing, eligibility and execution.
4.2 Political barriers to OMT and ESM
OMT requires the recipient to enter a conditional ESM macroeconomic adjustment or precautionary program. France faces a high political barrier to accepting such arrangements before the presidential election. OMT therefore has limited direct influence on French spreads in the 12-month baseline. Actual rescue discussions would themselves indicate a substantial departure from ordinary fiscal repricing.
4.3 Balance-sheet reduction and private-sector supply absorption
APP reinvestment stopped in July 2023 and PEPP reinvestment at the end of 2024. In early October 2026, Eurosystem APP holdings were about €2,056.5 billion and PEPP holdings about €1,275.4 billion; PEPP fell further to €1,268.8 billion by October 16. The stock remains large, but net maturities mean the private sector must continually absorb more bonds.
The Banque de France's share of OAT holdings fell from 30.2% in the third quarter of 2022 to 18.2% in the second quarter of 2026. On that basis, an estimated 3–4 percentage points of the OAT stock must be reabsorbed by private investors annually, affecting supply and demand alongside new issuance. French spreads thus also include compensation demanded as marginal buyers shift from the central bank to price-sensitive capital.
4.4 Tightening's effect on risk compensation
At the report date, the ECB deposit facility rate was 2.50%, after 25bp increases in June and September. The main market expectation was a pause in October and another 25bp increase in December. Danske expected the cycle to end at 2.75% in December, while markets implied more tightening. Euro-area September HICP inflation of 3.8% and core inflation of 2.5% constrained a rapid ECB pivot.
Tightening and balance-sheet reduction affect French risk compensation in three ways: higher funding costs reduce leveraged net carry; safe-asset demand can change German bond pricing; and simultaneous monetary and fiscal pressure delays premium normalization. Relative-value positions with reduced benchmark-rate duration have less direct policy-rate exposure, but financing differences and market liquidity still affect returns.
For dollar-based investors, ECB hikes also narrow the dollar-euro short-rate differential and reduce the yield uplift from FX hedging. Simultaneous Fed hikes could offset part of this effect. Cross-currency yield comparisons thus depend on the two central banks' relative paths, not simply changes in euro bond yields.
5 Investor structure and capital-flow constraints
5.1 Changes in ownership
Table 8. Changes in French government bond ownership
| Quarter | Non-residents | Banque de France OATs |
Resident credit institutions OATs |
Resident insurers and pension funds OATs |
OAT stock € billion |
|---|---|---|---|---|---|
| 2013Q4 | 63.5% | 3.0% | 10.1% | 25.3% | 1,203 |
| 2019Q4 | 53.6% | 19.2% | 6.5% | 20.1% | 2,046 |
| 2022Q3 | 49.6% | 30.2% | 6.6% | 13.8% | 2,033 |
| 2024Q4 | 54.6% | 24.9% | 10.4% | 11.7% | 2,241 |
| 2026Q2 | 59.7% | 18.2% | 10.7% | 10.8% | 2,441 |
Note: Uses BdF Webstat market-value shares and statistical scopes, released September 23, 2026. The non-resident and detailed OAT categories have different coverage and should be interpreted separately.
Domestic insurers' and pension funds' share of OATs fell from about 25% in 2013 to about 11% in the second quarter of 2026. Central-bank ownership also declined, while non-resident ownership rose back toward 60%. Marginal pricing consequently depends more on overseas investors' risk appetite, relative yields and balance-sheet conditions.
Non-resident capital includes both long-term real-money accounts and relative-value or basis investors, which respond differently to volatility. Long-term accounts focus on yield to maturity, ratings and liability matching; leveraged investors are more sensitive to margin and funding conditions. After political shocks, the latter's risk reduction can amplify fundamentally driven repricing, an important microeconomic channel behind spread volatility.
5.2 Pricing priorities of different investors
Table 9. Investor constraints and maturity preferences
| Investor | Main assessment dimensions | Implications for French allocation | Principal constraints |
|---|---|---|---|
| Long-term real-money accounts | Yield to maturity, rating-based capital requirements, asset-liability matching | High front-end compensation is attractive; duration needs still depend on liabilities | Ratings, credit impairment and solvency constraints |
| Benchmark-relative total-return funds | Excess return, tracking error and drawdown | Better expressed through French maturity structure and country diversification | France's large benchmark weight and concentrated spread risk |
| Leveraged relative-value investors | Net carry, volatility, financing and liquidity | Risk compensation from front-end and curve differentiation is more important | Margin, funding spreads and stress-driven risk reduction |
Amortized-cost accounting can reduce the immediate impact of market-value fluctuations on profit and loss, but economic risk, impairment and capital constraints remain. Total-return accounts face immediate relative-performance changes, while leveraged accounts may encounter funding and margin pressure from the same price shock. The same yield therefore has very different appeal to different investors; a single yield ranking cannot imply a universal allocation conclusion.
5.3 Actual transmission channels of rating changes
For indices, the Bloomberg Euro Treasury Index uses the middle rating from Moody's, S&P and Fitch. France currently has Aa3, A+ and A+, so the middle rating is already A+. A Moody's downgrade to A1 would leave it in the A bucket. SSGA index data as of September 30 show an A-bucket weight of 46.88%, consistent with that classification. A single Moody's downgrade would not mechanically remove France from a major index.
Mandate effects depend on specific rating rules. Mandates requiring AA-category ratings from at least two agencies were already affected by earlier S&P and Fitch downgrades. Those requiring an AA-category rating from any one agency, while recognizing only the big three, are more sensitive to Moody's. Recognition of DBRS or other agencies, transition arrangements for existing holdings and prior adjustments determine actual flows.
Collateral channels must be distinguished from index rules. The Eurosystem uses its recognized rating framework, and DBRS still rates France AA, limiting the direct impact of a single Moody's downgrade on existing collateral buckets. The EU Solvency II standard formula treats sovereign risk differently from non-EU regimes in Hong Kong, Japan and the US, so rating changes may matter more for capital requirements of Asian long-term investors.
Clearing houses and repo markets also adjust collateral requirements according to volatility and risk. Even without an index event, rising volatility may first affect leveraged investors' funding capacity. Rating announcements should be assessed separately through risk information, mandate adjustments and financing conditions.
5.4 Benchmark weights and scope for active allocation
Table 10. Main country weights in the Bloomberg Euro Treasury Index
| Country | Weight | Country | Weight | Country | Weight |
|---|---|---|---|---|---|
| France | 23.81% | Italy | 21.39% | Germany | 19.43% |
| Spain | 14.20% | Belgium | 4.94% | The Netherlands | 4.05% |
| Austria | 3.50% | Portugal | 1.95% | Finland | 1.75% |
| Ireland | 1.40% | — | — | — | — |
Note: LEATTREU basis; SSGA data as of September 30, 2026.
France represents about a quarter of the index and is the largest source of country risk. Large avoidance introduces high tracking error for benchmark-relative managers. The strategy therefore focuses on changing the maturity distribution of French exposure, drawing more compensation from front-end carry and depending less on long-term fiscal and election outcomes. Total country weight and contribution to spread duration should be assessed together.
6 Comparing relative-value strategies' returns and risks
6.0 Framework and estimation basis
The maturity and strategy comparisons focus on carry, roll-down, spread sensitivity and stress performance. They use October 20 curves and comparable bond prices over a one-year research horizon. Carry is net of a reference funding cost; roll-down assumes unchanged national curve shapes. Their sum measures the return cushion. The reference funding rate is €STR at 2.44%, rather than an actual funding quote for every account type.
Relative-value comparisons reduce common benchmark-rate effects but retain differences in country spreads, curves and funding. The immediate-shock cushion means the adverse instantaneous yield or spread move that one year's estimated carry and roll-down could offset. It relates compensation to current risk sensitivity.
Maturity and cross-country transmission parameters are scenario assumptions. The sensitivities of 2- and 5-year France-Germany spreads to the 10-year spread are 0.41 and 0.73, based on current spread ratios and moderately increased under stress. These parameters compare risk distributions; they are not stable historical statistical relationships.
6.1 The relative advantage of front-end allocation
The attraction of 2-year French government bonds first lies in combining higher yield with a shorter risk horizon. A representative bond yields about 3.58%, roughly 50bp over comparable German assets. Under the funding and roll-down assumptions, one-year excess carry plus roll-down totals about 1.42% of reference notional, equivalent to an immediate yield-shock cushion of about 79bp. Another comparable short bond gives about 1.51% and 80bp, pointing in the same direction.
For long-term real money, the front end allows compensation to be realized over a shorter period, reducing reliance on distant fiscal outcomes. Average debt maturity of about 8.5 years and continuing issuance demand cushion near-term funding. CDS premiums contain credit, liquidity and risk-appetite components; front-end relative value rests on combining that compensation with lower maturity sensitivity.
5-year French bonds offer greater carry and roll-down, estimated at about 2.05% of reference notional, with an immediate yield-shock cushion of about 54.5bp. They have more return responsiveness but depend more on budget and medium-term credit stability. The distinction between the front end and 5 years is a trade-off between incremental return and exposure to the fiscal path.
6.2 Maturity selection in France-Germany spreads
Table 11. France-Germany spread compensation and risk sensitivity
| Maturity | Comparable-bond spread | One-year carry and roll-down | Immediate spread-shock cushion | Estimated annualized volatility | Cushion/volatility ratio |
|---|---|---|---|---|---|
| 2-year | About 50bp | About 0.64% | About 35bp | About 29bp | About 1.20 |
| 5-year | About 96bp | About 1.34% | About 35.5bp | About 52bp | About 0.68 |
| 10-year | About 150bp | About 1.61% | About 22bp | About 71bp | About 0.31 |
Note: Returns are normalized to French reference notional and estimated from comparable bonds, not returns on own capital. Fitted maturity spreads differ from comparable-bond spreads. Volatility is estimated from the 60-day 10-year realized spread volatility of about 71bp annualized, combined with maturity sensitivities.
Longer maturities increase nominal spreads without proportionate compensation. The 2- and 5-year spreads each provide a one-year cushion of around 35bp, versus only 22bp at 10 years, where volatility is also higher. The front-end cushion-to-volatility ratio is about four times the 10-year ratio, an important quantitative basis for this report's preference.
5 years occupies the middle ground between return and fiscal risk. As budget and rating outcomes become clearer, the medium-term premium may normalize; stress losses are more manageable than at 10 years. The long end requires stronger evidence of fiscal improvement. Expecting recovery simply because spreads are high provides inadequate cover for volatility and political risk.
Cash bonds and futures may express the same country view differently because of financing, deliverable assets, maturity matching and liquidity. These affect net strategy returns; research should remain focused on maturity risk and country premiums themselves.
6.3 Spread curves and tail-risk structure
A France-Germany spread-curve steepener reflects the view that French fiscal pressure mainly operates through medium- and long-term debt-servicing paths, with short-term funding still cushioned. Relative front-end strength and long-end pressure can provide some offset when fiscal conditions worsen without front-end disorder. Under the assumed risk matching, carry and roll-down remain slightly positive.
This structure's effectiveness depends on the nature of the risk. If markets begin focusing on near-term default or interrupted funding, 2-year spreads may widen faster than 10-year spreads, flattening or inverting the curve and reversing the original offset. Relative front-end and long-end changes are thus an important test of the report's thesis.
France's domestic yield curve can also reflect the concentration of fiscal premiums in medium and long maturities. Compared with the France-Germany spread curve, it responds more directly to both ECB policy and French term premiums. If budget relief causes longer yields to fall faster, its performance may reverse that of a deterioration scenario. Different curve analyses must separate common rates, country credit and term risk.
6.4 Cross-country relative value
Table 12. France's pricing relative to other countries
| Comparison | Current relative pricing | Factors supporting recovery | Main opposing factors |
|---|---|---|---|
| 5-year France versus Italy | France about 27bp higher | France's additional premium is high; political relief could support recovery | Italy has a better primary balance and rating momentum; the changed historical ranking may persist |
| 5-year France versus Belgium | France about 42bp higher | Similar deficit levels; France includes more country-specific political premium | Different political risk and issuance size; liquidity differences affect pricing |
| 10-year France versus Italy | France about 38bp higher | Greater recovery potential if risk eases | French long maturities are more politically and fiscally sensitive, with a thinner return cushion |
| Spain versus France | Spain about 69bp lower at 5 years | Spain's growth and fiscal trajectory are relatively stronger | Relative strength already commands a substantial yield discount, making persistent risk mitigation expensive |
France's inverted ranking against Italy should not be assumed to be mispricing. Italy's fiscal and rating improvements are persistent, while French political risk has a longer horizon. This report estimates 5-year return cushions of about 8bp for France versus Italy and 10bp versus Belgium, below the equivalent France-Germany comparison. Cross-country recovery therefore depends more heavily on catalysts.
Replacing France with Spain reduces some country risk, but lower yield means a higher ongoing compensation cost. Strategy assessment must compare risk improvement with yield forgone. The strength of French contagion to Italy, Belgium and Spain determines how much protection country diversification offers under stress.
6.5 Risk compensation relative to swaps
France's 2- and 5-year yield premiums over €STR OIS are about 56bp and 99bp, offering a comparison for asset-liability management based on floating rates or swaps. After reducing fixed-rate duration, returns depend mainly on French spread changes and carry, making assessment most suitable for accounts with matching liability-pricing bases.
The difference between comparisons against swaps and against German bonds is Germany's own pricing relative to swaps. When German supply rises and scarcity weakens, France-Germany spread changes need not all originate in France. French spreads over OIS and Bunds should therefore be observed together to distinguish French premiums from German supply-demand effects.
6.6 CDS and the pricing of credit tails
French 5-year CDS was about 79–81bp in mid-October, well above Italy's roughly 64bp, consistent with the country ranking in cash bonds. France's 5-year yield compensation over OIS of about 99bp was roughly 19bp above CDS, indicating a bond-credit-protection basis.
The basis includes financing, liquidity, contract currency, maturity and exchange-rate interaction and cannot be treated as risk-free return. CDS more directly reflects default and credit-jump risk, while cash spreads also reflect supply, demand and risk appetite. Their joint movement helps determine whether this remains premium repricing or is developing into a more substantive credit tail.
6.7 Amplification through funding and liquidity
Funding conditions change the realized return from an identical view. Cash France-Germany spreads include German safe-asset demand and repo scarcity; futures also reflect deliverable assets and roll structure; returns versus swaps depend on swap spreads and collateral. Under stress, these differences may widen alongside country risk.
Safe-haven demand triggered by greater French risk may simultaneously raise German bond prices and securities-borrowing costs. Leveraged investors reducing exposure after higher margin requirements can intensify liquidity pressure. Feedback among yields, market depth and funding availability must be included in stress assessment.
6.8 Risk distribution under stress
Stress estimates assume a widening French 10-year spread and lower German yields from safe-haven demand, with higher French front-end sensitivities as shocks intensify. The table normalizes profit and loss to French reference notional to compare risk structures.
Table 13. Estimated profit and loss under immediate spread shocks
| Risk structure | 10-year spread +30bp |
10-year spread +60bp |
10-year spread +100bp |
10-year spread +143bp |
|---|---|---|---|---|
| 2-year French bonds | −0.13% | −0.31% | −0.63% | −1.04% |
| 5-year French bonds | −0.64% | −1.32% | −2.26% | −3.26% |
| 2-year France-Germany spread | −0.22% | −0.48% | −0.99% | −1.67% |
| 5-year France-Germany spread | −0.83% | −1.70% | −3.02% | −4.58% |
| 10-year France-Germany spread | −2.21% | −4.42% | −7.37% | −10.53% |
| France-Germany spread-curve steepener | +0.32% | +0.59% | +0.81% | +0.90% |
| 5-year France versus Italy | −0.52% | −1.07% | −1.90% | −2.89% |
| 5-year France versus Belgium | −0.43% | −0.89% | −1.58% | −2.40% |
Note: German yields change by −5, −10, −20 and −35bp in the four scenarios. The 2-year/5-year sensitivities are respectively 0.41/0.73, 0.45/0.75, 0.55/0.80 and 0.65/0.85. Immediate profit and loss excludes future carry and is not return on own capital.
Under these assumptions, 2-year French bond losses are much smaller than long-end losses, and their estimated one-year cushion exceeds immediate stress losses. A mere 30bp shock to the 10-year France-Germany spread already loses more than one year's carry and roll-down. Curve steepening benefits from greater long-end widening, but depends on front-end sensitivity staying below long-end sensitivity and does not cover a front-end-led financing crisis.
7 Cross-currency allocation for Hong Kong and US dollar investors
7.1 FX hedging and yield-comparison mechanics
Dollar-based investors assessing euro sovereign bonds must consider bond yield, the dollar-euro short-rate differential and cross-currency basis together. With a rolling FX hedge approximation, dollar yield equals the euro bond yield plus the dollar-euro short-rate differential and a basis adjustment. Country compensation and cross-currency yield uplift have different sources; the latter changes with relative monetary policy and financing demand.
SOFR is 3.89% and €STR 2.44%, a difference of about 1.45 percentage points. On this static approximation, a euro bond's dollar-converted yield exceeds its euro yield. The Hong Kong dollar comparison uses about 3.267% for 3-month HIBOR and 2.625% for 3-month Euribor, a difference of roughly 0.64 percentage points. The maturities and benchmarks differ; the table illustrates magnitudes.
7.2 Hedged relative yields
Table 14. Static cross-currency hedged yield comparison
| Asset | Euro yield | Estimated USD-hedged yield | Versus maturity-matched US Treasuries | Estimated HKD-hedged yield |
|---|---|---|---|---|
| 2-year French government bond | 3.575% | About 5.03% | About +25bp | About 4.22% |
| 5-year French government bond | 4.097% | About 5.55% | About +61bp | About 4.74% |
| 10-year French government bond | 4.887% | About 6.34% | About +122bp | About 5.53% |
| 2-year German government bond | 3.079% | About 4.53% | About −25bp | About 3.72% |
| 5-year Italian government bond | 3.952% | About 5.40% | About +47bp | About 4.59% |
Note: Uses reference bond and rate data, adding 1.45 percentage points to euro yields for USD and about 0.64 percentage points for HKD. Actual forward points, cross-currency basis and transaction costs are excluded; these yields are not locked-in long-horizon returns.
With consistent hedging into the same currency, France's country yield compensation over Germany is broadly preserved, so FX hedging does not automatically eliminate French relative value. Dollar-based accounts can compare French credit risk with same-maturity Treasury returns on a familiar yield scale. The larger hedged uplift at the long end also contains more French maturity and fiscal risk and should not be ranked by yield alone.
Hong Kong dollar short rates are lower than dollar rates, so direct HKD hedging adds less yield. The linked exchange-rate system does not eliminate USD/HKD funding and asset-liability matching differences. HKD accounts' actual comparisons still depend on liability currency, mandates and capital rules.
7.3 Main constraints on cross-currency allocation
Rolling short-dated FX contracts makes returns during the bond holding period reprice with policy-rate differentials and basis. If ECB tightening outpaces the Fed, the current hedge uplift may narrow; funding changes during euro-area stress also affect basis. Cross-currency advantages must therefore be assessed alongside liability maturity and return stability.
FX risk and sovereign spread risk have different magnitudes. By the report date, EUR/USD had already fluctuated substantially during the year, and potential currency moves could exceed front-end spread compensation. For accounts primarily targeting bond risk and return, FX exposure changes the original thesis's risk structure.
Hong Kong insurance and bank accounts also face accounting classification, credit impairment, solvency and tax considerations. These determine how identical economic returns enter profit and capital measures and explain why Asian real-money allocation can differ from euro-area behavior. Cross-currency yield advantages must ultimately become net returns compatible with liabilities and capital constraints.
8 Catalysts and research windows
Over the next two months, the key question is whether ratings, budgets and monetary policy alter the credibility of France's fiscal path. Individual announcements may produce temporary recovery, but sustained spread narrowing requires better budget execution, growth and funding absorption together. The table preserves the main research milestones using information available at the report date.
Table 15. Main events and pricing significance
| Observation window | Key event | Research focus |
|---|---|---|
| Evening in Europe, October 23 | Moody's review of France | Whether downgrade size and outlook exceed expectations; distinguish information shocks, mandate constraints and prior pricing. |
| Late October | Social security and fiscal budget deliberations | Opposition willingness to cooperate and amendments' cumulative effect on the deficit target. |
| Late October | Fed and ECB policy meetings | Relative tightening paths, inflation assessments and ECB language on sovereign spreads. |
| October 30 | France's preliminary third-quarter GDP | How growth below budget assumptions affects revenue and deficit targets. |
| Around November 3 | Vote on PLF 2027 revenue provisions | Whether normal passage is blocked and how the political cost of exceptional procedures changes. |
| Early November | French long-term sovereign auction | Whether demand and pricing indicate worsening funding pressure. |
| Evening in Europe, November 13 | S&P review of Italy | Further effects of rating improvement on France-Italy relative pricing. |
| Around November 17 | French National Assembly first-reading deadline | Budget progress, Article 49.3 use and no-confidence risk. |
| Evening in Europe, November 27 | S&P review of France | Whether the outlook and fiscal-sustainability assessment deteriorate. |
| Mid-December | Parliamentary review deadline and ECB meeting | Whether the budget's legal path and monetary tightening simultaneously increase fiscal pressure. |
| December | Details of the 2027 issuance plan | Long-end issuance share and private-sector absorption needs. |
| February–April 2027 | End of parliamentary session and presidential election | Interaction among fiscal commitments, polls and long-term risk premiums. |
Sources differ on budget-vote dates. November 3, from the cited parliamentary schedule, is the main window for the revenue vote. What matters more is the result's effect on government survival, budget measures and the deficit target.
9 Risk matrix and scenario analysis
9.1 Market scenarios over the next 12 months
Budget-political scenarios do not map one-to-one onto market scenarios. Building on Chapter 3's budget paths, the table adds oil, ECB, global-rate and election variables to construct four market scenarios with subjective probabilities. The baseline is elevated range trading; adverse scenarios have a relatively high combined weight, reflecting constraints between fiscal adjustment and policy support.
Table 16. Market scenarios for the next 12 months
| Scenario | Subjective probability | Main conditions | Terminal 10-year France-Germany spread | Change in German 10-year yield |
|---|---|---|---|---|
| Easing | 20% | Budget passes; deficit about 5.2%; mild rating outcome; oil falls; tightening ends; election expectations converge | About 110bp | +15bp |
| Baseline range | 40% | Transitional arrangements through the election; spread mainly 130–160bp, with a pre-election premium rise | About 145bp | 0bp |
| Deterioration | 28% | Government falls; deficit above 5.8%; rating pressure; some non-EU long-term investors reduce allocation | About 190bp | −10bp |
| Tail crisis | 12% | Institutional crisis, downgrade, front-end credit concerns and cross-country contagion; delayed policy response | About 260bp | −35bp |
Table 17. Estimated 12-month scenario returns by risk structure
| Risk structure | Easing | Baseline range | Deterioration | Tail crisis | Probability-weighted |
|---|---|---|---|---|---|
| 2-year French bonds | +1.48% | +1.48% | +1.35% | +1.06% | +1.40% |
| 5-year French bonds | +2.71% | +2.35% | +1.55% | +0.27% | +1.95% |
| 2-year France-Germany spread | +0.89% | +0.70% | +0.44% | −0.19% | +0.56% |
| 5-year France-Germany spread | +2.50% | +1.64% | +0.50% | −1.62% | +1.10% |
| 10-year France-Germany spread | +4.96% | +2.47% | −0.74% | −5.72% | +1.09% |
| Spread-curve steepener | −0.32% | +0.10% | +0.62% | +1.20% | +0.29% |
| 5-year France versus Italy | +0.95% | +0.52% | −0.22% | −1.43% | +0.16% |
| 5-year France versus Belgium | +1.03% | +0.56% | −0.05% | −1.04% | +0.29% |
Note: Normalized to French reference notional and including estimated one-year carry and roll-down. Returns from direct French holdings are model returns net of reference funding costs, not bond total returns. Probability weighting uses Table 16's scenarios and subjective probabilities; parameters are in Chapter 6.
The scenarios support the front end's relative resilience. 2- and 5-year French bonds retain positive estimated returns in every listed scenario, with smaller tail drawdowns at 2 years. Performance reflects short maturity sensitivity, carry and safe-haven declines in German rates jointly, rather than French credit risk alone.
Probability-weighted returns on 5- and 10-year France-Germany spreads are similar, both about 1.1%, but the 5-year loss in a tail crisis is about 1.62%, far below 5.72% at 10 years. Higher nominal spreads do not necessarily improve tail risk-adjusted returns; 5 years offers a better balance than the long end.
Spread-curve steepening contributes estimated returns of about 0.62% and 1.20% in deterioration and tail scenarios, respectively, but is negative under mild easing, showing its offsetting role across market conditions. Cross-country relative value has lower weighted returns and greater reliance on budget, rating and political catalysts, giving it lower research priority than France's own term structure.
9.2 Identifying the main risks
Table 18. Risk matrix and research implications
| Risk | Main transmission channel | Signals | Effect on the central assessment |
|---|---|---|---|
| Rating deterioration beyond expectations | Credit information, mandates and capital requirements | Downgrade size, outlook and rationale | Harder medium- and long-end recovery; reassess long-term funding demand. |
| Budget failure or government collapse | Unreliable fiscal targets and weaker adjustment capacity | Cumulative amendment effects, political cooperation and no-confidence motions | Reinforces long-end fiscal premiums and prolongs wide spreads. |
| Rising front-end credit risk | Near-term funding and default concerns | Front-end spreads widening faster than long-end spreads; marked curve flattening | Directly challenges the common premise of front-end preference and curve steepening. |
| Tighter funding and liquidity | Securities-borrowing costs, margin and deleveraging feedback | Repo specialness, quote width and clearing terms | Reduces net carry and amplifies immediate losses. |
| More ECB tightening than expected | Funding costs and transmission to fiscal interest expense | Inflation persistence and rate-path changes | Narrows compensation and makes fiscal repair harder. |
| Continued Italian improvement | Wider fiscal and rating divergence | Primary balance, growth and rating decisions | Mean reversion to the historical France-Italy ranking may be delayed further. |
| Oil and war shocks | Inflation, growth and global rates | Energy prices and policy responses | Strengthens fiscal and monetary constraints simultaneously. |
| Disappointed policy-support expectations | Inadequate response after market disorder | Cross-country contagion and ECB statements | Tail duration and losses may exceed the current model. |
The most important counterevidence would be a change in the nature of French front-end risk. If short spreads and CDS accelerate together, sovereign demand worsens and pressure spreads to other countries, the interpretation of predominantly medium- and long-term fiscal repricing must change. Conversely, executable budget measures, an improving primary balance and converging political expectations would justify recovery across more maturities.
10 Portfolio positioning and research conclusions
10.1 Benchmark-relative country and maturity preferences
The portfolio view remains cautious on overall French exposure, tilted toward its front end and less concentrated in long-end spread risk. France's roughly one-quarter index weight means maturity distribution often matters more for portfolio risk than simple country weight. Shorter allocations and diversification of medium- and long-term spread risk can express both yield-compensation and fiscal-constraint judgments.
Table 19. Portfolio research preferences by country
| Country | Country and maturity preference | Core grounds |
|---|---|---|
| France | Cautious overall; prefer 1–3 years; cautious beyond 7 years | Substantial front-end compensation; long-end recovery still depends on improved fiscal and election risk. |
| Italy | Relatively neutral; monitor intermediate value | Improving primary balance and rating momentum, but exposed to French contagion. |
| Germany | Value core-rate exposure and diversification under stress | Low credit risk and safe-haven qualities coexist with rising supply and reduced scarcity. |
| Spain | Relatively constructive; focus on intermediate allocation | Stronger growth and fiscal trajectory; relatively lower sensitivity to French contagion. |
| Belgium | Relatively cautious, especially at the long end | Deficit and debt-ratio pressure; less yield compensation than France. |
| The Netherlands | Relatively constructive as a core-asset comparator | Stronger fiscal and debt foundations, with some compensation over Germany. |
| Portugal | Monitor diversification from fiscal improvement | Falling debt ratio and relatively favorable fiscal position. |
In benchmark-relative assessment, French long-end spread volatility may become a major source of tracking error. Using annualized 10-year spread volatility of about 71bp, reducing France's spread-duration contribution by 0.5 years corresponds to roughly 35bp of relative-performance volatility. Actual outcomes also depend on country, maturity and rate correlations; portfolio assessment must distinguish common interest-rate duration from French spread duration.
10.2 Conditions for the views to hold or fail
The front-end preference requires continuing near-term funding demand, manageable short-term credit risk and carry compensation not substantially eroded by financing and liquidity costs. Its advantage weakens if front-end spreads widen faster than the long end or if ratings, issuance demand and funding conditions deteriorate together.
5-year relative value requires gradually declining budget uncertainty and rating outcomes that do not further alter medium-term credit assessment. A long-end turn requires stronger evidence: an improved primary balance, stabilizing debt trajectory and constrained pre-election fiscal commitments. Lower volatility improves risk-return characteristics, but price recovery after one announcement still requires validation against fiscal change.
Curve steepening requires fiscal premiums to remain concentrated in medium and long maturities. Cross-country value depends respectively on French political risk converging toward Belgium's and French fiscal and rating momentum improving relative to Italy. Separating these conditions identifies whether returns come from term structure, country recovery or a common market rebound.
10.3 Core questions for further research
First, can French budget targets become a credible primary-balance improvement? Evidence determining long-term spreads includes persistent measures, growth assumptions and parliamentary support, beyond completion of budget procedures. Gradually rising future debt costs make this increasingly important.
Second, will private investors continuously absorb new French issuance and maturing central-bank holdings? Participation by long-term real money, benchmark-relative funds and leveraged investors will affect the spread response to identical fiscal news and determine whether pressure becomes a liquidity feedback loop.
Third, can French risk remain country-specific and long-end-led? Joint changes across front and long maturities, cash bonds and CDS, and France and other countries help distinguish fundamental repricing, funding pressure and contagion. Policy tools' role will also change with the risk profile.
Overall, higher French sovereign yields have created research value in maturity selection, but broad recovery remains constrained by fiscal and political factors. Front-end relative yield, 5-year balance and long-end fiscal premiums are the clearest strategic distinctions. The future direction depends on changes in budget execution, ownership structure and policy conditions, which will also determine France's new position in euro-area sovereign pricing.


