Oil finished almost flat on August 12, concealing two opposing fundamental forces. An exceptionally large U.S. commercial crude build in the tens of millions of barrels undermined prompt bullish confidence. Deep product-inventory deficits and thin seaborne and floating-storage buffers pulled the other way. Prices' failure to plunge on upstream inventories reflected prompt supply-risk premiums and downstream physical tightness offsetting the paper build.
Slight closing gains, then weaker intraday snapshots
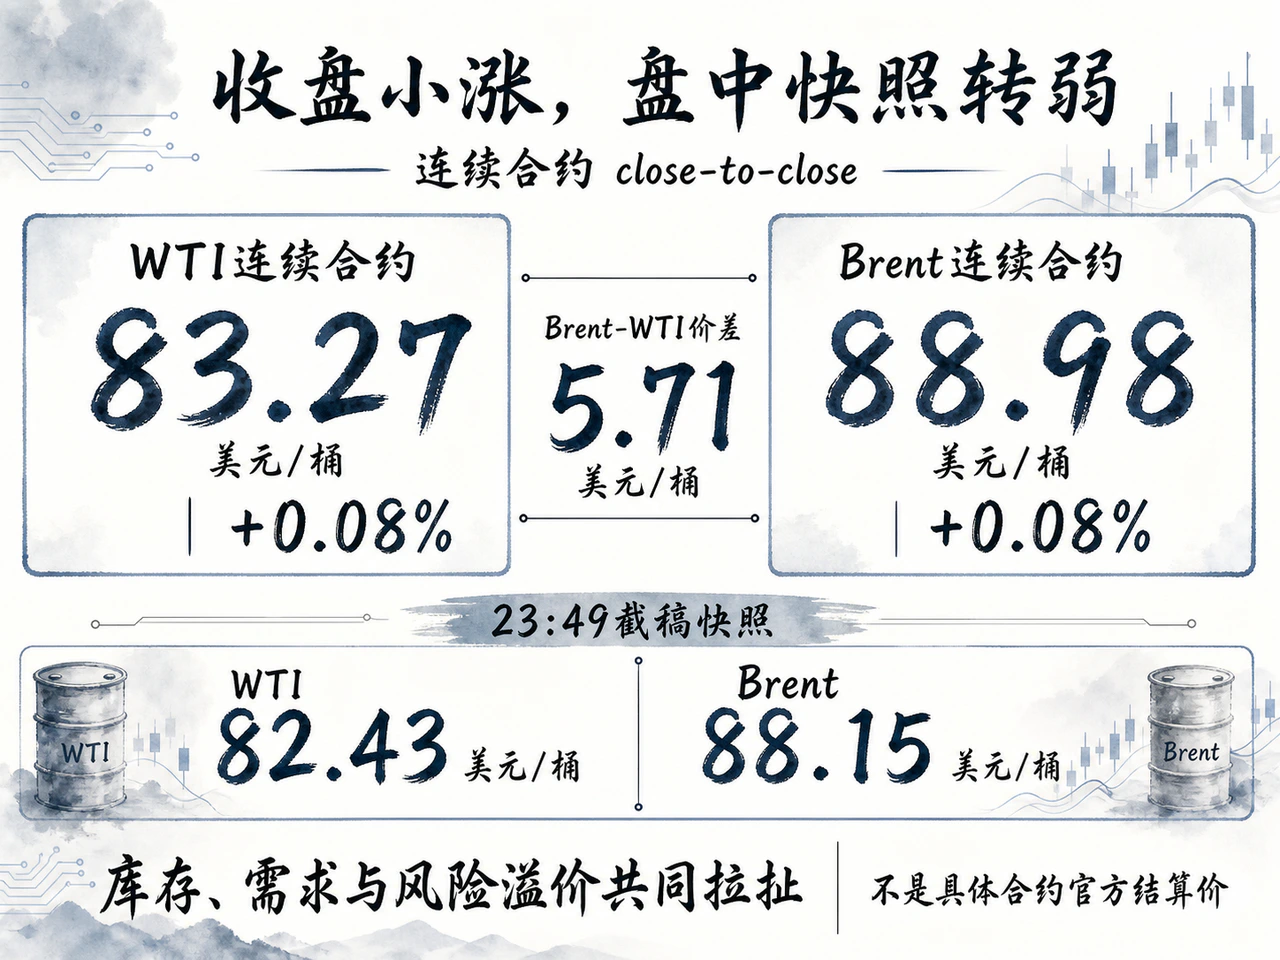
August 12 continuous daily close-to-close prices put WTI at $83.27/barrel, up $0.07 from $83.20, or 0.08%. Brent closed at $88.98/barrel, also up $0.07 from $88.91, or 0.08%. Brent-WTI stayed near $5.71, almost unchanged. Synchronized marginal moves showed offsetting drivers rather than a regional or delivery-grade anomaly.
These are continuous-contract daily close-to-close readings from the pricing evidence, not official final NYMEX WTI or ICE Brent settlements for a specified month. Rolls, curve splicing and terminal-specific closing cutoffs mean $83.27 and $88.98 cannot be equated with exchange settlement references.
Around 23:49 Beijing time on August 13, prepublication U.S.-session electronic snapshots showed WTI $82.43/barrel and Brent $88.15, around 1.0% and 0.9% below August 12 continuous closes. These record short-term sentiment, not final settlements, and cannot be mixed with prior formal closes as official daily changes.
U.S. crude inventories surge, but products remain tight

The EIA's August 12 weekly report hit physical bulls: commercial crude excluding SPR rose 17.4 million barrels in the week ended August 7 to 424.4 million. Stocks were still about 2% below the seasonal five-year average, but such a rare weekly build materially limited prompt upside.
Upstream accumulation did not mean ample final fuels. Gasoline fell 1 million barrels, to 6% below the five-year average; distillates, mainly diesel, fell 100,000, about 12% below. Refinery utilization reached 96.2% and processing 17.2 million barrels/day. Four-week average total product supplied was 20.7 million barrels/day, down 2.1% annually. High refinery loads mainly reflected necessary replenishment of depleted downstream channels, not a broadly loose product balance.
The latest IEA report completed the global picture. Observed crude and product stocks fell 69 million barrels in July, chiefly in transit and floating storage. Refinery throughput was nearly 5 million barrels/day lower year on year, and July seaborne diesel exports from Russia, the Middle East and Asia fell 1.3 million barrels/day. These broader data do not replace August 12's immediate inventories but explain why a large U.S. crude build did not break prices: global product and maritime buffers remained fragile.
Shipping risks raise supply premiums
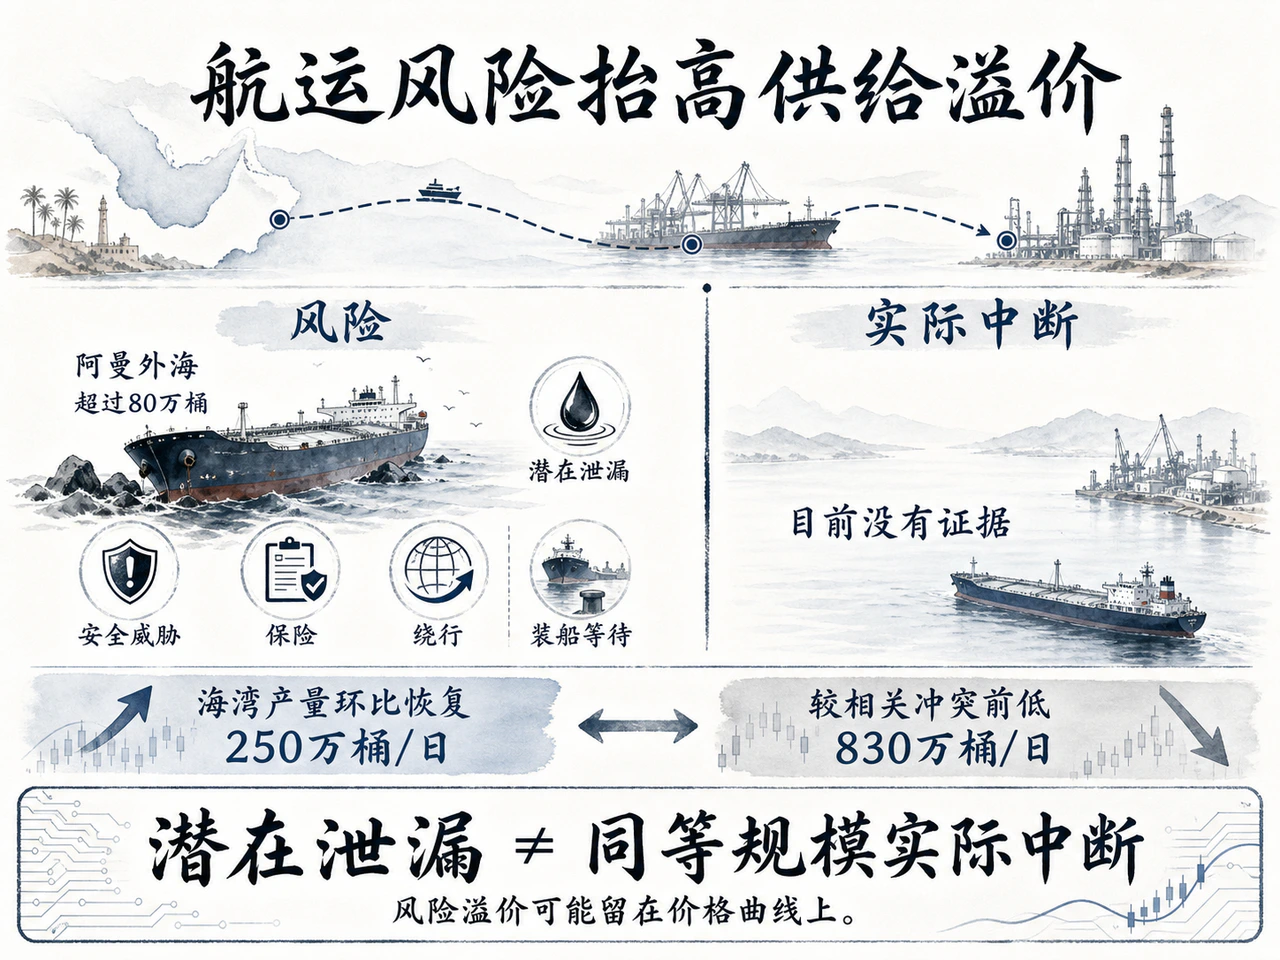
On August 13, spill response continued for a grounded tanker offshore Oman. Worsening storms complicated booms and salvage; estimated cargo exceeded 800,000 barrels. This required close near-term maritime and environmental monitoring, but no clear evidence established an equal actual global supply interruption. Potential pollution, local blockage and lost supply must remain distinct.
More substantive transport pressure came from uncertain Gulf routes and coastal repairs. The IEA said July Gulf production recovered 2.5 million barrels/day monthly but remained 8.3 million below preconflict. Bypass pipelines diverted some crude but could not replace the main strait. War insurance, Cape detours, loading demurrage and cross-region arbitrage costs can each embed persistent premiums in the curve.
Middle-distillate fragility was particularly acute. Middle Eastern and Russian refining and exports both faced external limits. North American utilization was high, with little spare elasticity as hurricane season deepened and autumn maintenance approached. Traders' main concern was not abrupt total disruption but longer delivery cycles and persistent friction preventing quick product abundance.
Oil swings between two competing logics

Near-term pricing faced parallel forces: unexpectedly replenished U.S. crude and weaker annual demand limited WTI upside; Gulf maritime obstruction, tight distillates and low floating inventories supported Brent's risk premium. IEA data showed both prompt WTI and Brent spreads firmly backwardated, indicating fierce competition for immediately deliverable barrels despite upstream paper builds. There was no sufficient evidence to extrapolate those spread magnitudes indefinitely into deferred delivery.
The dollar index gained about 0.19% on August 12, normally negative for dollar commodities, yet both oil benchmarks rose. Supply obstruction premiums had not been extinguished by inventory news. August 13's modest electronic decline reflected macro sentiment, profit-taking and delayed absorption of the exceptional build. Before another inventory report and actual cargo-loading evidence, intraday moves alone were inadequate proof of a trend reversal.
Three areas deserve attention: whether abnormal U.S. crude builds persist and gasoline/diesel stocks stabilize; whether Gulf terminal efficiency, demurrage, war-risk rates and bypass-pipeline use materially improve; and whether the Oman incident affects hub ports, transit pipelines or coastal refineries. Only sustained crude builds together with confirmed easing in products and shipping would support a lasting premium unwind. Until then, upstream abundance and downstream scarcity likely leave oil elevated and volatile.


