On August 13, Treasury completed a $25 billion 30-year auction at a high yield of 5.216%, the highest financing cost for a new 30-year issue since 2001.
A day earlier, $42 billion of 10-year notes cleared at 4.683%, the highest since August 2007. In secondary trading, the 30-year had already reached 5.27% on July 31, returning to the pre-financial-crisis range of seventeen years earlier.
These extremes invite a loose headline that Treasury yields are the highest since 2007. But they refer separately to 10-year primary auctions, 30-year primary auctions and 30-year secondary bonds. Maturities and market layers cannot be conflated. Nor does the evocative year 2007 justify equating today's market with the eve of the subprime crisis.
The notable feature is that higher long yields have not coincided with unanchored long-term inflation or collapsing auction demand. Markets have raised the required real return on long-term capital and compensation for ultralong duration. Global money has not abandoned Treasuries; it has abandoned the cheap-capital era familiar over the past decade and more.
What auction records do—and do not—say
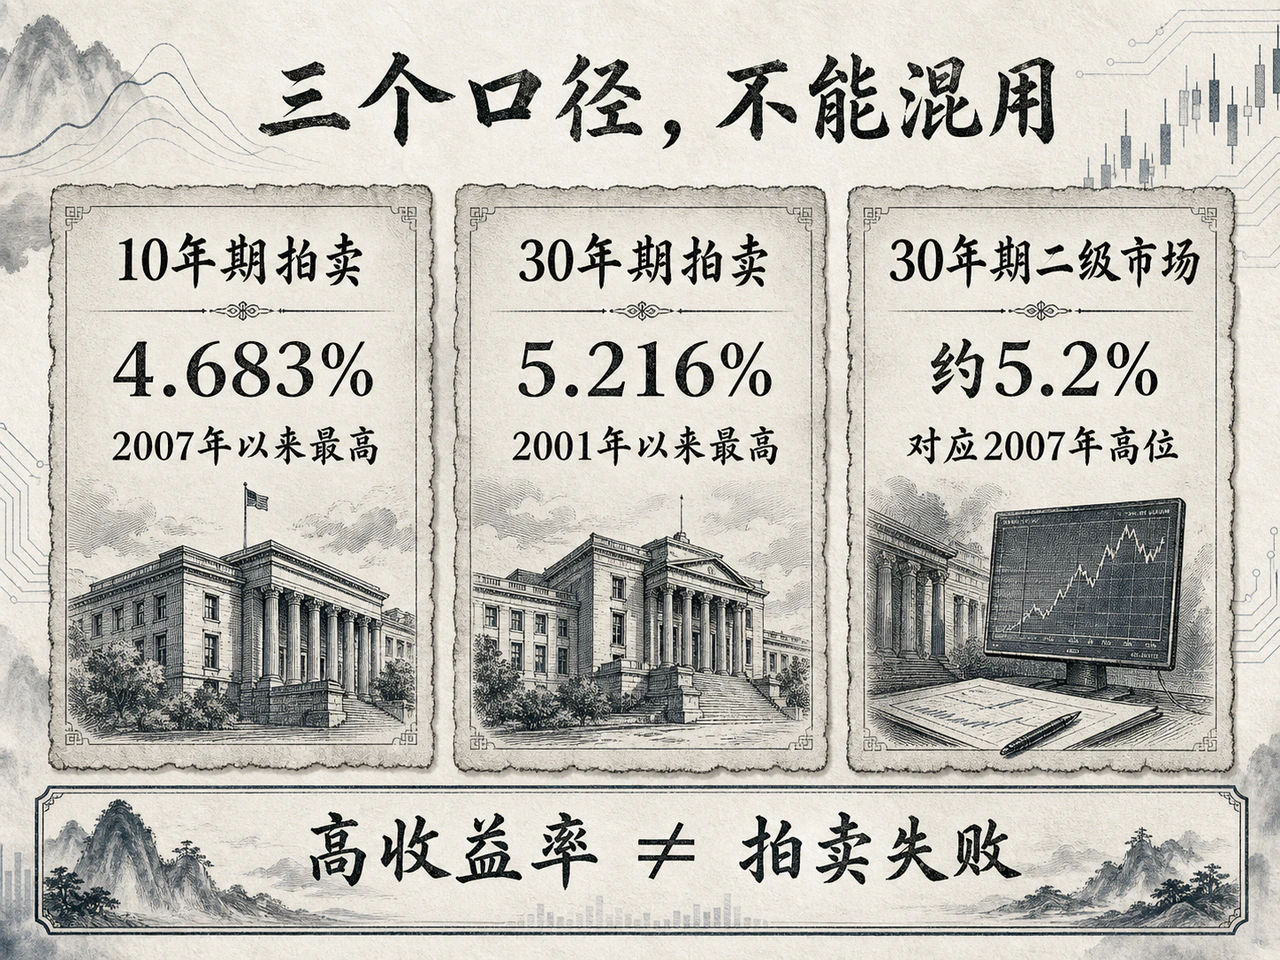
An auction's high yield is the clearing price for a new security at a particular moment. Higher secondary yields naturally require higher issuance costs. Whether demand is healthy depends also on coverage, buyer composition and the tail relative to when-issued trading, not the absolute yield alone.
The August 12 10-year auction had 2.53 bid-to-cover, with indirect bidders, mainly foreign central banks and large managers, taking 76.7%, and primary dealers only 8.6%. The next day's 30-year coverage was slightly lower at 2.39, but indirect buyers still took 66.8%, leaving dealers around 11.5%. Real long-term buyers remained present and underwriters were not forced into abnormally heavy inventories.
The major change was supply scale. August 2007's 10-year auction was only $13 billion versus today's $42 billion; February 2007's new 30-year was $9 billion versus $25 billion. Nominal sizes cannot be compared directly across nearly twenty years, but multiplied supply shows that the duration the financial system must absorb is vastly different.
The message of 5.216% is therefore not absent buyers but the need for yields unseen for two decades to clear enormous long-term supply. The risks differ fundamentally: impaired liquidity and market functioning versus a harsh confirmation of the equilibrium price under new supply and demand.
Almost all nominal-yield gains are explained by real rates
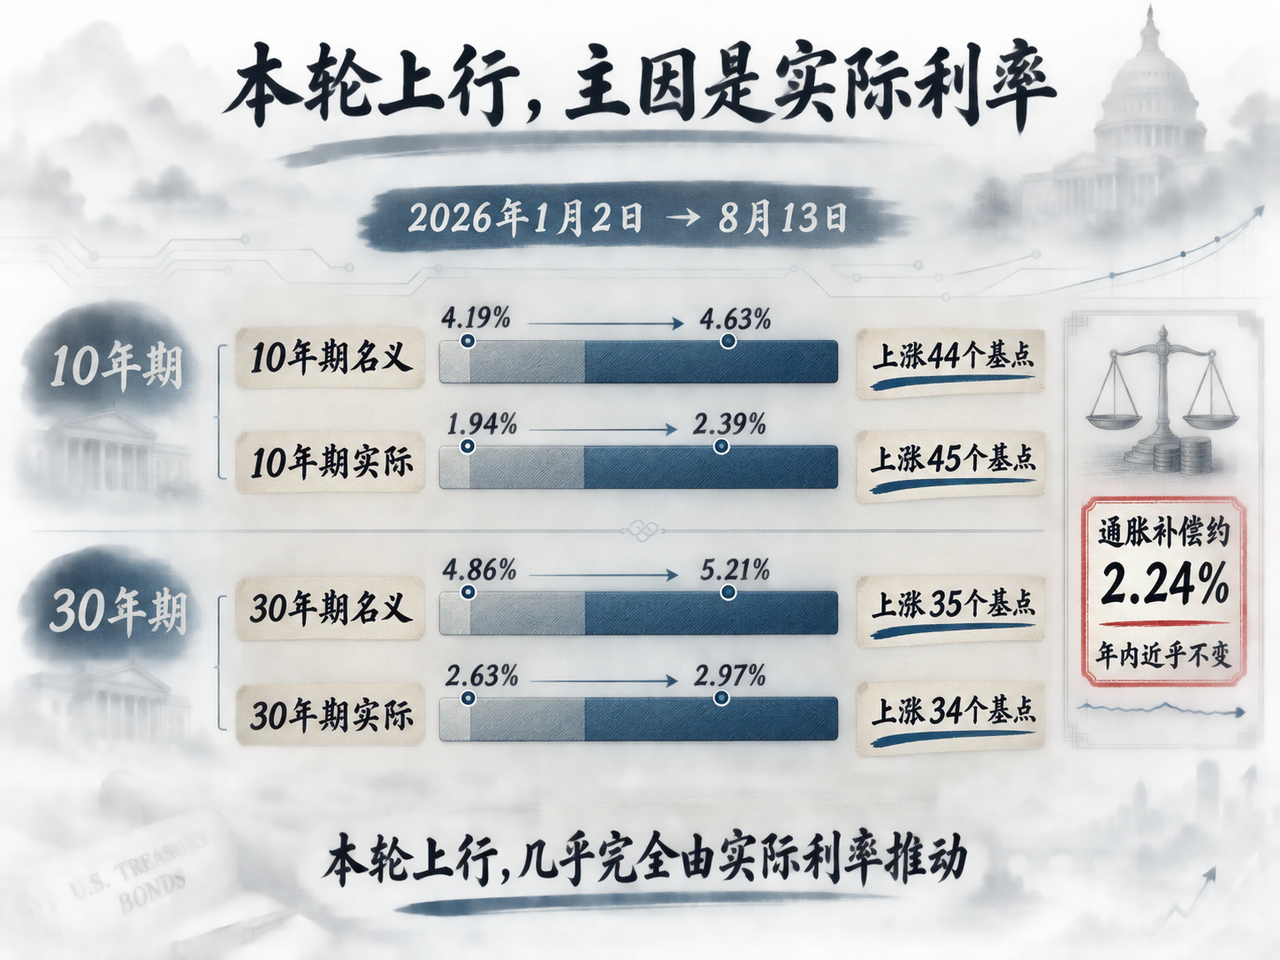
Long nominal yields can theoretically be split into expected short real rates, long-term inflation expectations and a term-risk premium. A practical decomposition subtracts same-maturity TIPS yields from nominal yields to obtain breakeven inflation, leaving the locked-in real return.
Treasury data show 10-year nominal yields rising from 4.19% on January 2, 2026 to 4.63% on August 13, up 44 basis points. The 10-year TIPS real yield rose from 1.94% to 2.39%, up 45. Thirty-year nominal yields rose from 4.86% to 5.21%, up 35, and real yields from 2.63% to 2.97%, up 34.
The implied 10-year inflation measure barely changed from 2.25% to 2.24%, while 30-year compensation stayed in a narrow 2.23%–2.24% range. On July 31, the 30-year TIPS yield reached 3.03%, a record since that tenor's issuance resumed in 2010.
This changes the interpretation of the sell-off. Geopolitics and energy did increase near-term prices—July CPI was 3.4% year on year, energy 14.7%—but ultralong weakness was not simply a bet on thirty years of uncontrolled inflation. It reflected higher required risk-free real capital returns and compensation for holding long duration.
A long-cycle Fed study released early this year corroborated this. Over five years, 9-to-10-year forward nominal rates rose by the most since the late 1970s and early 1980s. Estimated forward term premiums increased nearly 200 basis points toward the 85th percentile since 1971. Higher forward inflation risk could not explain the move; most came from repricing forward real-rate risk premiums.
Markets still trusted the Fed to contain long inflation near 2%, but had rejected the illusion that ultralong assets could be held at almost no cost.
The same '2007 high,' but a very different macro foundation
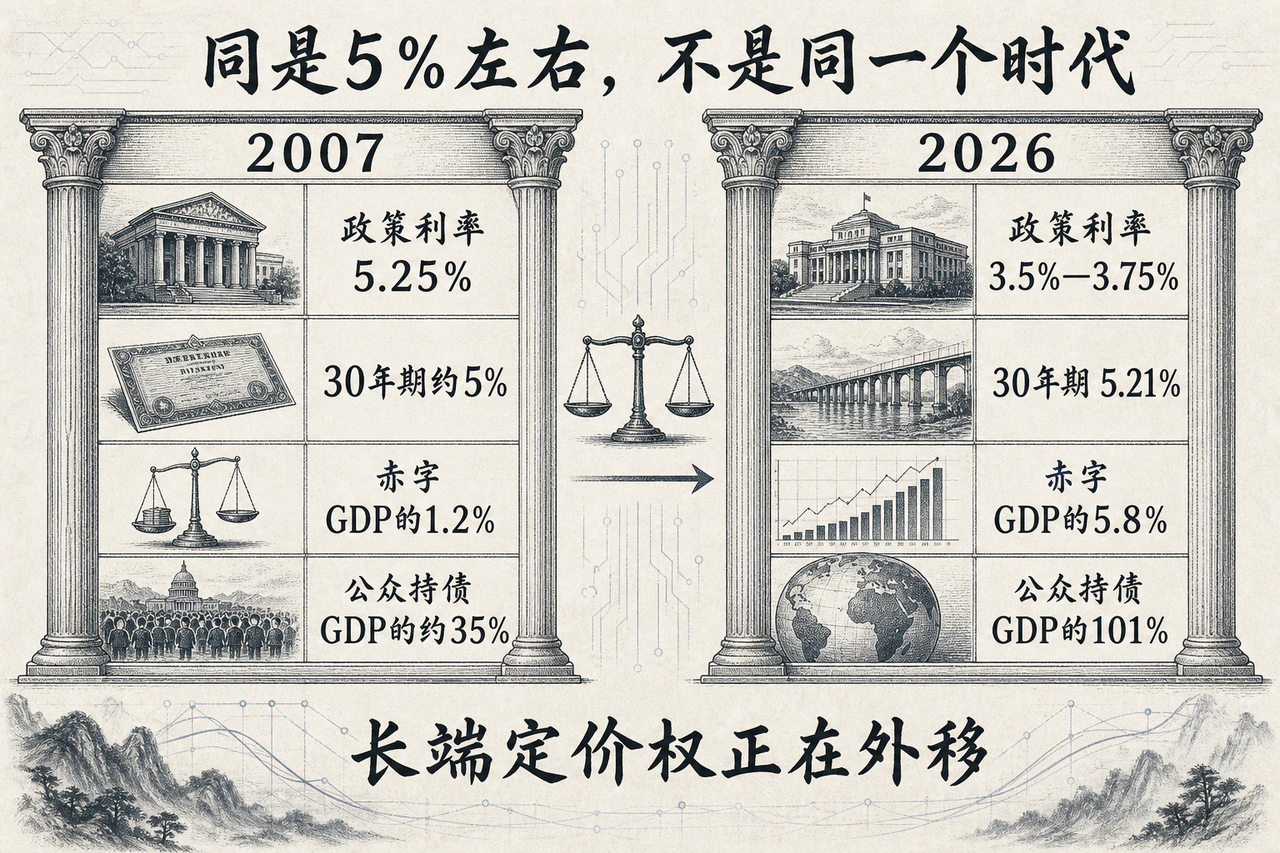
In August 2007, the policy rate was 5.25% and the 30-year near 5.00%. The inverted curve reflected slowing growth and anticipated major Fed cuts. The eventual crisis arose from household subprime defaults, excessive financial leverage and liquidity/maturity mismatch, rather than long risk-free yields alone.
Today the picture is reversed. Policy is only 3.5%–3.75%, while the August 13 30-year yield was 5.21%, nearly 160 basis points above the policy midpoint. Inversion has become steepness. The long end refuses to follow short-liquidity easing expectations, demanding a real-rate floor and term compensation beyond the next FOMC bet.
Fiscal differences are larger. In fiscal 2007 the deficit was around 1.2% of GDP and federal debt held by the public 35%. CBO's latest fiscal-2026 estimates put them at 5.8% and 101%. Seventeen years ago, high policy rates near the end of tightening coexisted with a relatively light public balance sheet and a private credit bubble. Today the mix is neutral-to-low policy rates, enormous public debt, vigorous industrial capital spending and repeated structural supply shocks.
After 2008, excess global savings, aging, weak private investment and major central banks' QE compressed real rates and term premiums. Ultralong sovereigns offered coupons and equity protection in recessions. Today AI data centers, computing infrastructure, grid upgrades, manufacturing reshoring and defense compete directly with government deficits for long capital. Treasury credit remains irreplaceable, but private capital's opportunity cost has permanently risen.
The claim that lower inflation necessarily returns long bonds to 2010s ultralow rates is therefore detached from reality. Even with inflation anchored near 2%, higher real returns and continuing fiscal issuance imply a materially higher nominal long-rate equilibrium.
Fiscal deficits are a fundamental slow variable, rather than a daily trading excuse
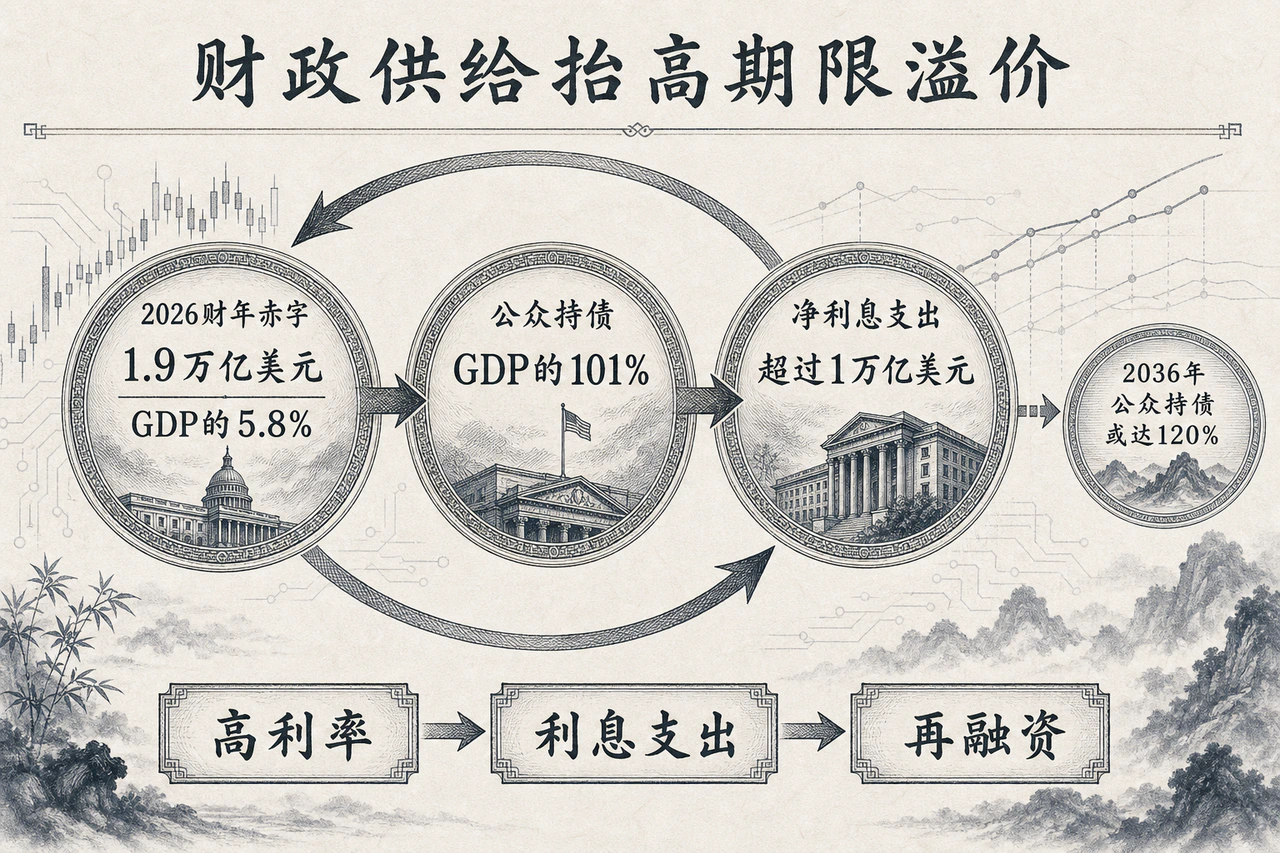
CBO projects a fiscal-2026 deficit near $1.9 trillion and net interest above $1 trillion, 3.3% of GDP. By 2036, federal debt held by the public could reach 120% of GDP and net interest 4.6%, with interest alone nearly matching all federal discretionary spending.
This does not imply imminent Treasury default. Dollar and Treasury collateral remain foundational to global finance. But principal credit safety is different from market-price safety: institutions can fully trust repayment while refusing to lock capital for thirty years at historically low yields.
August's quarterly refunding statement put issuance at $125 billion, including only around $28.7 billion in new cash, and pledged no increase in nominal coupon auction sizes over the next several quarters. This removed a near-term issuance surprise without easing continuing refinancing. Larger debt increases interest sensitivity and prompts markets to price future supply discounts earlier and more aggressively.
Kansas City Fed research using 1998–2025 issuance and pricing found an unexpected supply shock raising debt/GDP by 1 percentage point within two years increased the 10-year yield about 1.3 basis points that day, peaking near 2.5 over subsequent sessions. Longer maturities experienced more persistent term-premium increases. Individual shocks may be modest, but years of deficit supply can reshape the curve's valuation center.
Fiscal pressure rarely appears as a spectacular failed auction. It acts like persistent capital gravity: every auction clears, but buyers progressively demand lower prices until high yields become the new lasting norm.
The Fed remains a nominal anchor, but no longer the only one
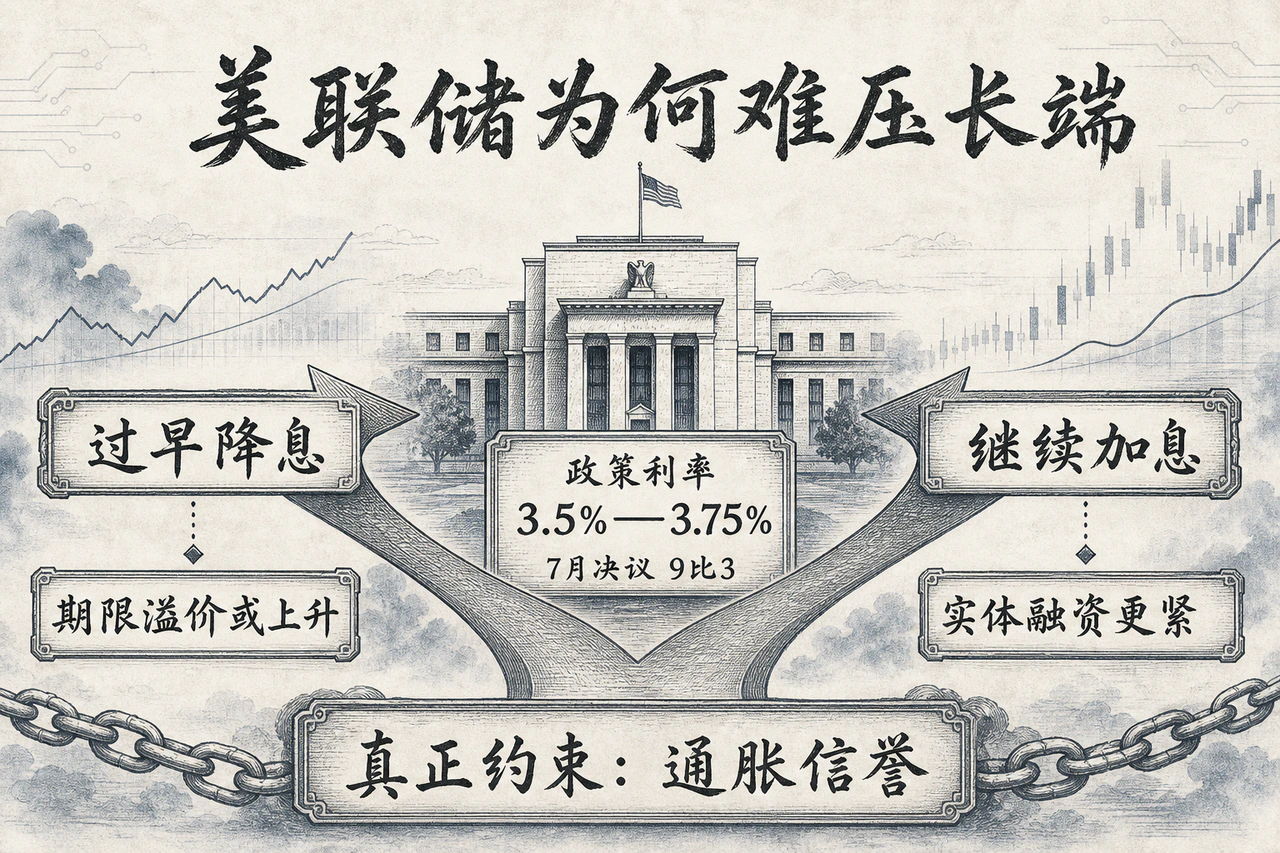
July's FOMC held 3.5%–3.75% by 9–3, with three dissenters favoring a 25 basis-point increase. June's SEP median projected 3.8% policy at end-2026 and a long-run neutral r* around 3.1%. Within the Fed's framework, short nominal rates sat near the lower end of restrictive territory while long yields had moved far above the neutral benchmark.
High-frequency data were mixed. July headline CPI rose a moderate 0.1% month on month and core 0.2%, suggesting emerging disinflation. PPI was flat monthly, but annual inflation and the measure excluding food, energy and trade services remained near 4.7%. This gave the Fed room to wait, while long holders still bore decades of unknowable geopolitical fragmentation, renewed inflation, fiscal excess and policy error.
The result is counterintuitive: hikes need not raise long yields, nor cuts lower them. A decisive hike that reinforces anti-inflation credibility can reduce forward inflation expectations and term premiums, flattening the curve. A cut interpreted as submission to political or fiscal pressure may lower short rates while sending long yields sharply higher on inflation and credit premiums.
The Fed retains large-scale purchases as a tool to influence term premiums, but institutional costs are high. After ending balance-sheet runoff at end-2025, purchases to maintain adequate reserves mainly focused on bills and short securities, fundamentally different from crisis QE absorbing large duration. Buying ultralong bonds before core inflation returns fully to 2% risks accusations of confusing liquidity management, easing and deficit monetization.
Policy rates still dominate money markets and the curve's front end, and dots guide the next two or three years. Beyond that horizon, ultralong pricing has become a three-way interaction among central-bank credibility, fiscal supply and real capital returns.
Future rates: Which component eases matters more than whether the Fed cuts
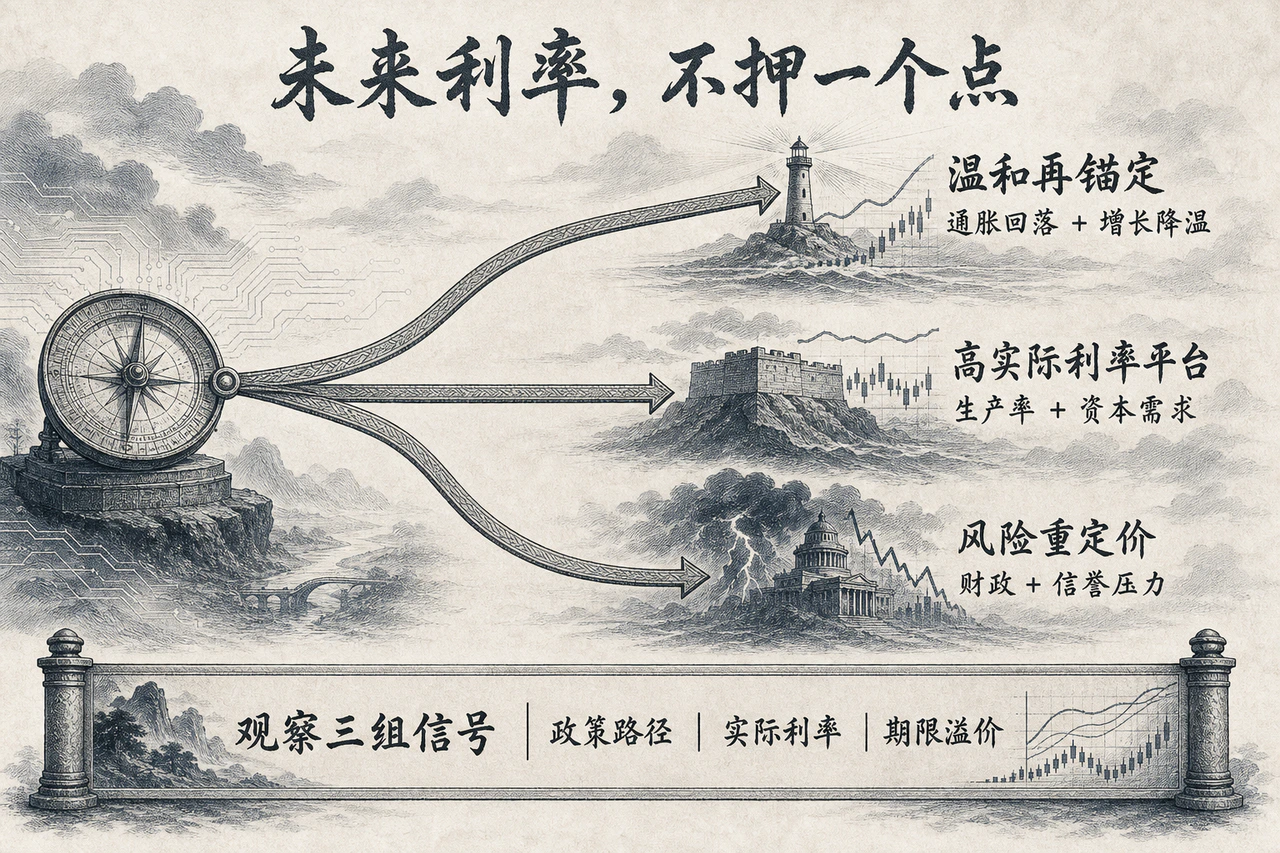
Over the next six to twelve months, three scenarios outline long-rate paths:
First, economic and capital-spending cooling with reinflation risk eliminated. If core converges smoothly toward 2%, labor weakens unexpectedly and issuance remains restrained, expected short rates and real term premiums can fall together. Only under all those conditions could the 10-year fall to 4.0%–4.3% and the 30-year to 4.6%–4.9%—a genuine duration bull market, not a tactical single-cut trade.
Second, investment and deficits sustain high real rates. Inflation slowly declines, the economy remains resilient, AI and energy-transition computing investment expands and deficits remain rigid. Even if the Fed cuts, inflation expectations remain stable and real yields have limited downside. The 10-year likely trades broadly at 4.3%–4.9%, the 30-year at 4.9%–5.4%. This is the most persuasive baseline given current data and supply-demand conditions.
Third, renewed fiscal imbalance or a credibility shock. Supply beyond absorption capacity, tariff-driven inflation compensation or doubts over policy independence could push the 30-year above 5.5%. The warning is not one record yield but repeated auction tails, surging dealer retention and simultaneous adverse increases in TIPS real yields and breakevens. Together these would mark a shift from higher borrowing costs to failing underlying absorption.
Fixed-income monitoring should have three layers. Two-year yields and OIS capture near-term Fed adjustments. Nominal-minus-TIPS spreads track inflation compensation. Real forwards, auction buyer structure and 5s30s slope measure long-term term risk. Fed funds futures alone can no longer define the long end.
High coupons do not mean low volatility or risk. The new 30-year with a 5.125% coupon still has modified duration around fifteen years. A further 50 basis-point yield increase could produce an immediate 7%–8% mark-to-market loss; a deep recession lowering real rates across the curve could instead deliver a powerful rebound. Higher coupons thicken the holding cushion without reducing inherent duration volatility.
The significance of 5.216% is a structural repricing of the world's core asset. The 2% inflation target remains the nominal anchor and the Fed still controls the front end, but required real returns, relentless fiscal supply and expanding term premiums have jointly pulled long yields away from their familiar harbor of the past decade and more.


