In the first half of 2026, global markets repriced U.S.–Iran developments almost daily: whether operations would expand, Hormuz reopen, sanctions ease or ceasefire talks advance. By August, asset prices had become markedly less sensitive to diplomatic statements and verbal exchanges. More concrete physical and fundamental data had taken over as the drivers of Treasury curves and macro rate expectations.
Reduced market sensitivity did not mean the macro effects of geopolitics were fading. Trading was shifting from sudden-event bets to prolonged transmission of real costs. Actual strait traffic, crude-port loading rates, commercial inventory depletion, insurance and freight would ultimately feed through energy prices, intermediate costs and expectations into Fed decisions.
A simple rule of hikes when oil rises and cuts when it falls cannot explain the dilemma. Tariffs, fiscal expansion, tighter immigration and AI capex are reshaping both supply and demand, producing sticky core inflation, structural labor imbalances and long-run expectations. The Fed must weigh these intertwined variables. Long Treasury yields in turn transmit doubts about central-bank credibility and larger deficits into mortgages, corporate credit and real investment.
As of mid-August, 3.50%–3.75% remained the most probable year-end target. The upside tail to 3.75%–4.00% was clearly larger than the downside to 3.25%–3.50%. That asymmetry depended on core inflation and long expectations not yet trending lower, rather than an election-calendar lock. Kevin Warsh was newly installed, and mounting November midterm noise put independence in the spotlight. With inflation not yet fully controlled, an early dovish turn carried a greater institutional credibility discount and explanatory cost than in an ordinary cycle.
From geopolitical shock to rates: the Fed's order of judgment

Listing macro variables produces only an unhelpful news inventory. Judging rates requires knowing the order in which each enters the policy matrix.
The first test is credibility and the anchoring of long-term inflation expectations. This determines whether the Fed can look through energy or tariff moves as one-time relative-price adjustments. If households and businesses trust convergence to 2%, it can tolerate headline spikes. But broad opportunistic repricing, high inflation embedded in wage bargaining and persistently wider bond inflation compensation would turn a local supply shock into entrenched inflation. Even with slowing growth, easing would then be difficult.
The second test balances the breadth of price pressure against actual job losses. Oil volatility directly lifts headline PCE and erodes purchasing power, but policymakers care more about transmission into transport, warehousing, aviation, chemicals, packaged foods and broader nonhousing core services. Payroll gains alone are also inadequate. Slower immigration and aging reduce labor supply, allowing lower normal monthly job growth to coexist with low unemployment. Hours, initial and continuing claims, vacancies, layoff announcements and real household consumption better reveal whether demand has fallen below potential.
Productivity and the neutral rate ($R^*$) enter at the same stage. AI capex and potential total-factor-productivity gains may reduce unit labor costs. Yet enormous capital demand and higher potential growth can also lift returns on capital and equilibrium real rates. Expanded supply helps prices, while strong industry investment supports demand. Productivity becomes a sound reason to cut only when clear data show supply-side disinflation materially exceeding demand stimulus.
The final loop is financial conditions. Long yields rising mainly through real rates or supply-driven term premiums directly restrain mortgages and long-term corporate funding, sharing some of the short-end tightening task. If instead they rise because expectations unanchor or political pressure discounts independence, the policy meaning reverses. The same 30-year yield can require opposite policy responses.
History offers no simple rule that oil determines rates
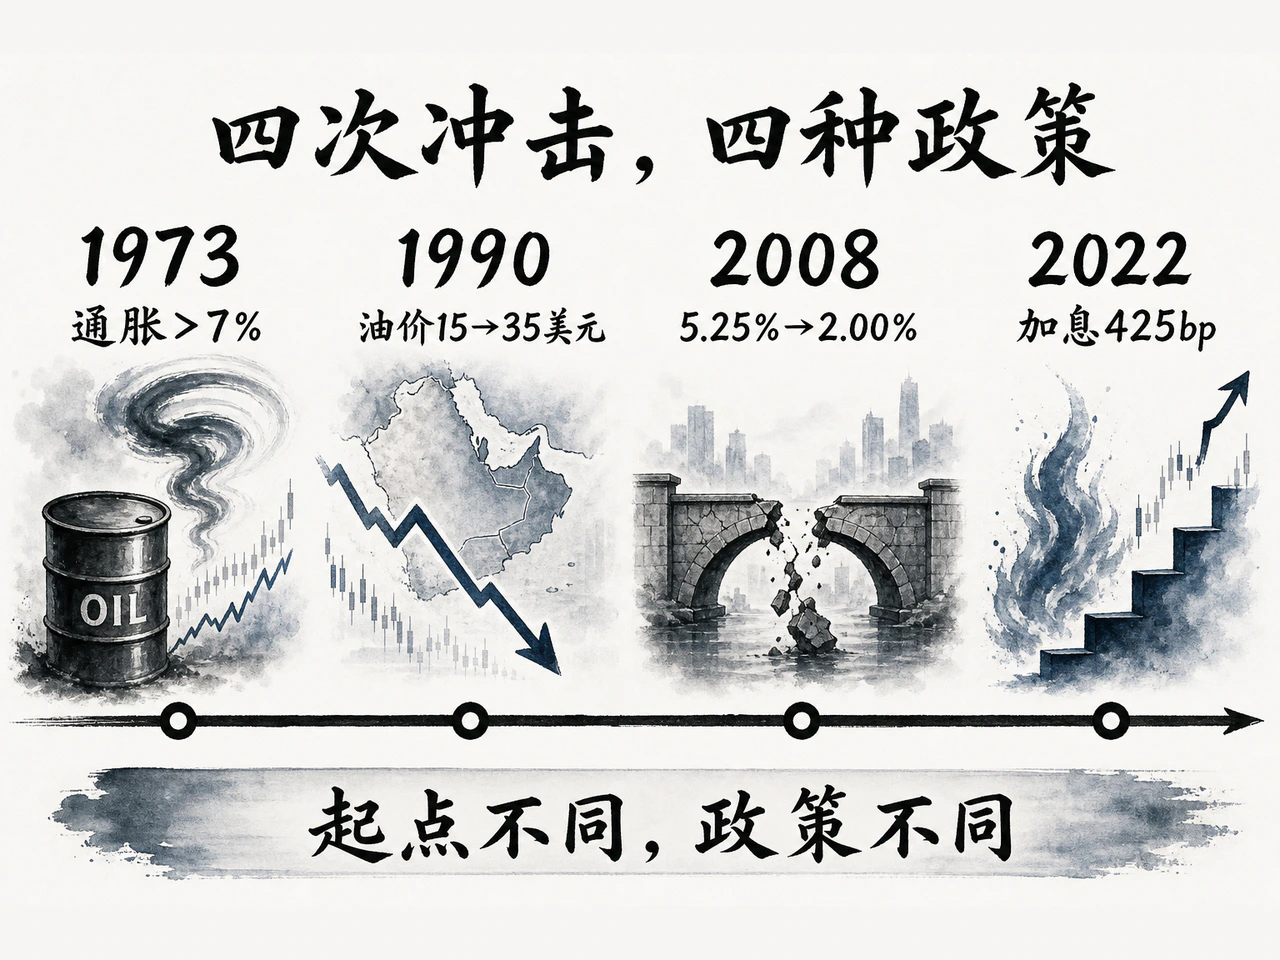
Attributing 1970 s stagflation solely to two oil crises obscures serious monetary-policy failures. Dallas Fed historical analysis shows U.S. CPI inflation above 7% before the first oil crisis in October 1973 and near 10% before the second oil surge in February 1979. Michigan short-term inflation expectations had already risen from 2.1% to 4.6% between 1966 and 1971.
Nixon applied exceptional easing pressure before the 1972 election. Under Arthur Burns, the Fed repeatedly blamed broad inflation on supposedly external factors such as union premiums, poor harvests and oil embargoes. Excessive 1971–1972 monetary expansion inflated demand before prices spiraled. Premature easing after recessions created a disastrous stop-and-go cycle, ended only when Paul Volcker's extreme rates broke expectations. The lesson of the 1970 s was not to follow every oil move; repeatedly blaming external shocks and easing too early under political pressure destroys reaction-function credibility.
The 1990 Gulf War showed the opposite response. Iraq's invasion of Kuwait lifted crude from around $15 to above $35 a barrel. Recession signs had preceded the surge, however, with commercial-property losses, bank-credit contraction and collapsing confidence reinforcing each other. From July 1990 to early February 1991, the Fed cut 175 basis points, from 8.00% to 6.25%. It was not ignoring energy inflation: it expected financial tightening and collapsing demand to generate far greater medium-term disinflation than the one-time oil shock. The same supply shock can produce opposite policy given a different starting output gap.
The 2008 path was more extreme. From the second half of 2007 to April 2008, the Fed cut from 5.25% to 2.00%, then paused amid surging commodity inflation. Only after Lehman's collapse and systemic crisis overwhelmed the commodity boom did cuts fully resume. Looking through headline inflation for defensive easing required anchored long expectations and a credit-and-demand collapse powerful enough to erase inflation risks over time. Treating 2008 as routine permission to cut aggressively with high oil, outside systemic-crisis conditions, misreads the evidence.
In 2022, the response went the other way. By the Russia–Ukraine conflict, U.S. inflation had spread from durable goods into housing, supply chains and services; labor was extremely tight and real policy rates deeply negative. The Fed raised rates 425 basis points in nine months, aiming not to control one month's gasoline price but to prevent high expectations entering wage and pricing contracts.
History does not support mechanically trading Fed decisions from oil's direction. Responses depend on whether inflation was already broad, expectations anchored and demand and finance able to generate disinflation themselves. In 2026, expectations were not wholly unanchored, but core prices had remained above target for years and the new chair's credibility had not yet faced the test of a complete disinflation campaign.
The new chair and midterms change the cost of mistakes
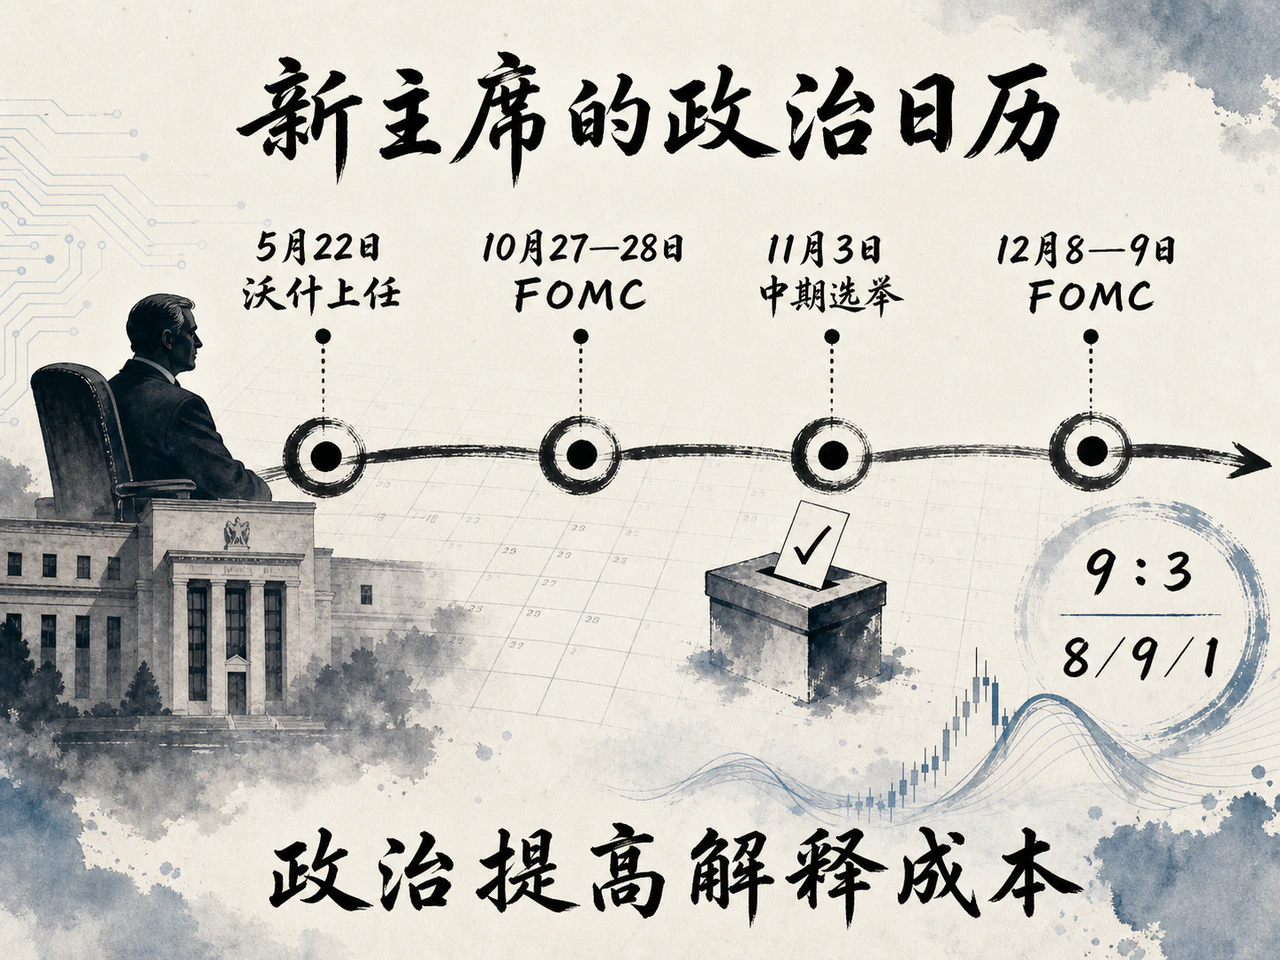
Warsh was sworn in May 22 and had served less than three months by mid-August. His first meetings establish more than the next 25 basis points: they reveal the thresholds for action, whether White House pressure can sway decisions and whether the 2% target is binding or negotiable language.
This sensitive period collided with politics. Trump repeatedly pressed for lower rates, emphasizing the burden on mortgages and borrowing and the government's growing debt-interest bill. Republicans urgently needed answers on housing affordability and living costs before the November 3 midterms. The October 27–28 FOMC fell just six days before voting, while December 8–9 came after the result.
Before elections, incumbents naturally want lower borrowing costs and better employment, while inflation's costs may emerge quarters later. Long central-bank terms defend independence against this time-inconsistency temptation. The Burns-era tragedy was not simply whether the White House sent a request. When easing fully aligns with executive demands, markets can conclude that the Fed lacks the political resolve to bear disinflation's costs.
Political pressure operates in opposite directions. Executive demands for cuts can pull short rates lower at the margin, but defending fragile independence may make a new chair raise the evidentiary bar for easing. With Warsh newly in office and core inflation above 2%, that defensive instinct clearly dominated. It is no immutable dogma: refusing to respond to a collapse in labor, retail demand and credit would also invalidate a reasonable reaction function.
Collective FOMC voting constrains personal rule. July's nine-to-three vote held 3.50%–3.75%; three dissenters favored an immediate 25-basis-point hike. Of 18 June dot-plot participants, eight expected unchanged year-end rates, nine at least one more hike and just one a cut. Warsh can shape agendas and communications but has one vote. Persuading an inflation-focused committee to ease broadly while core inflation is far from target would face formidable resistance.
More dangerously, political risk can bypass fed funds and roil long bonds. A cut perceived as capitulation could raise long inflation compensation and sovereign-credit premiums, rather than reduce financing costs. Even with a lower short benchmark, 30-year and mortgage rates could climb and the curve steepen punitively. The aim of cheaper housing finance could be swallowed by a heavier long-term premium.
Election results do not mechanically determine rates. Unified control would ease passage of tax cuts and spending; divided government might block incremental stimulus but could not reverse existing deficits or necessarily remove unilateral tariffs. Post-election markets would price whether the overall policy mix increased Treasury supply, hindered labor-supply recovery or raised supply-chain costs. The Fed must manage the resulting macro effects, while forward-looking long bonds price them earlier.
How the war ends matters more than when
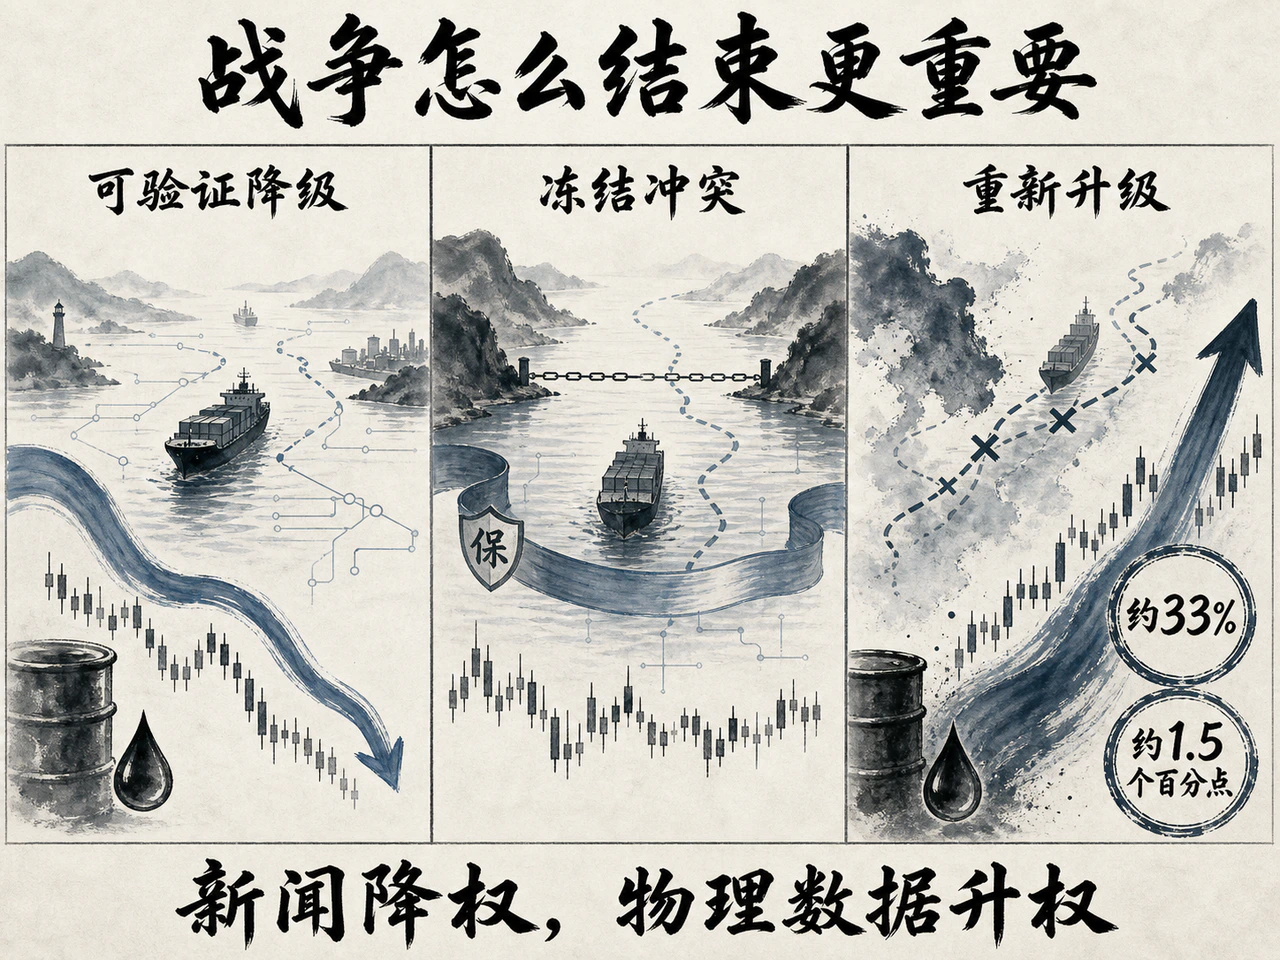
As talks drag on and statements change, individual headlines carry less pricing weight. Physical measures become the test: actual vessel density, commercial crude-loading tonnage, consumer-country stocks, refinery runs, Lloyd's premiums and VLCC spot freight reveal real supply-chain turning points more reliably than claims of an imminent deal.
First path: verifiable, irreversible de-escalation. Seaborne routes normalize, sanctions rules stabilize, stocks rebuild consistently and benchmark crude and U.S. gasoline establish a downward trend. Headline inflation eases first, while lower energy spending repairs real disposable income and consumption, partly offsetting disinflation from slower growth. This removes forced-hike tail fears without automatically triggering cuts. Only several consecutive months of core PCE readings fully consistent with 2% could bring a substantive move toward neutral; severe employment collapse need not be a precondition.
Second path: lower military intensity but a long frozen conflict. Large-scale fighting pauses while sanctions remain, escorts and transit friction persist and rhetoric oscillates. Oil may not revisit wartime extremes, but stocks cannot build a safety cushion and insurance and security premiums stay high. Markets may tire of fragmented news while real supply chains retain their costs. This favors waiting: neither unsubstantiated verbal escalation nor ceasefire statements without implementation guarantees justify a hasty policy shift.
Third path: failed talks and renewed escalation. A Boston Fed time-varying model estimates that a roughly 33% exogenous real-oil shock would now add about 1.5 percentage points to headline PCE over 12 months, below the pre-mid-1980 s effect of 2.2 points. The study emphasizes substantial parameter uncertainty; historical estimates are not an inevitable script. Labor absorption also differs from half a century ago. As the United States became the largest oil and gas producer and a net exporter, capex, wage and employment gains in producing regions could offset some damage in net-importing regions, substantially moderating the national employment drag.
Deterioration would therefore place pressure on the Fed to reduce inflation that outweighed concern about weaker employment. If second-round supply-chain pricing and expectations worsened, its instinct would be restrictive rates or renewed hikes, rather than indiscriminate growth support through cuts. Prolonged war would also expand special defense funding and supply-chain restructuring costs from a new sanctions architecture. Together with unilateral tariffs, these would raise underlying cost inflation and force more long Treasury issuance.
Markets were reducing trust in diplomatic language and political maneuvering, while the underlying pricing weight of actual traffic, freight and inventory rebuilding remained intact.
Current data support waiting, without yet supporting a pivot
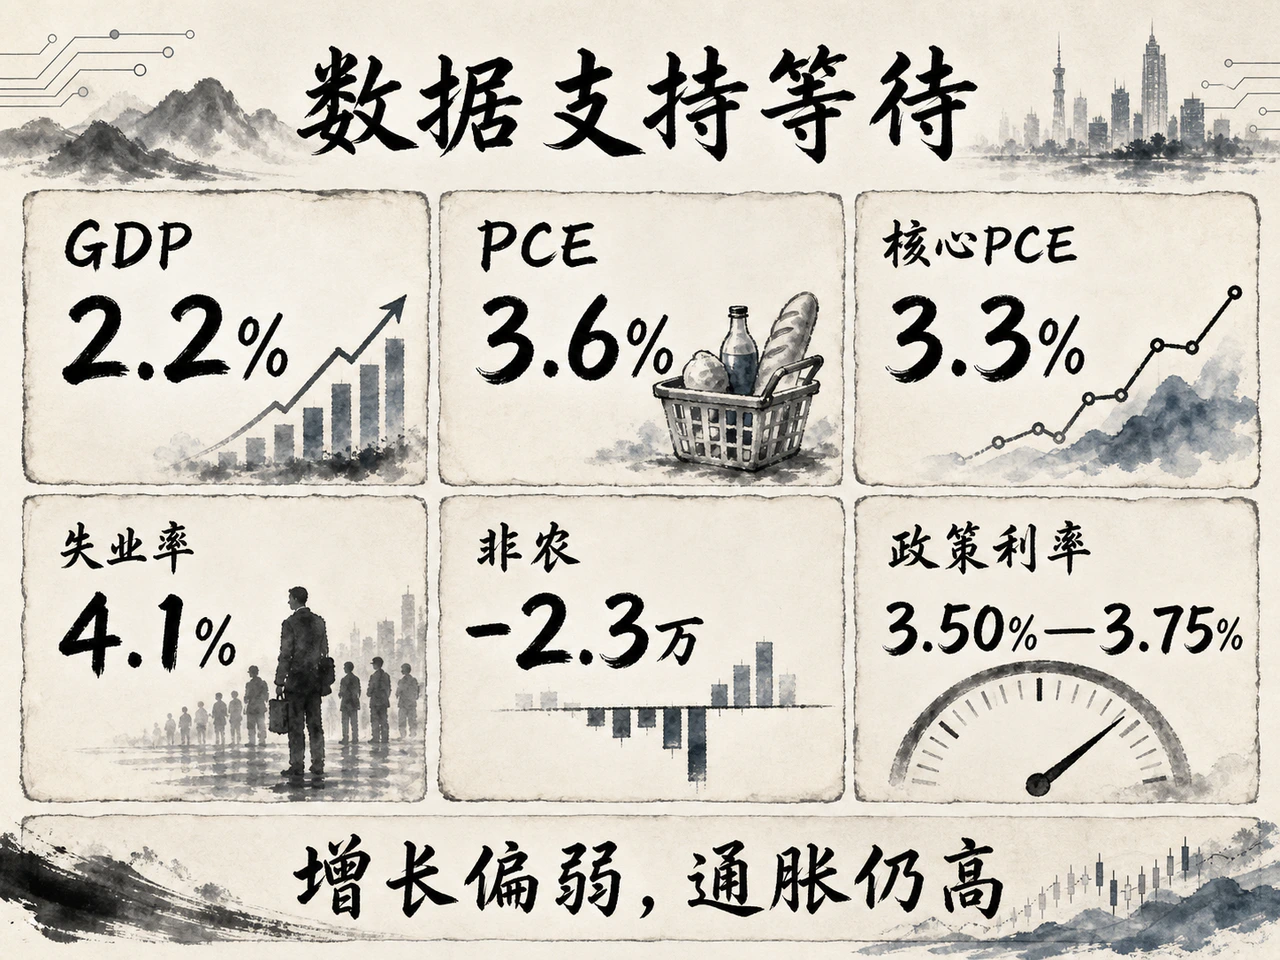
June's SEP showed a sharp change in officials' assessment. Versus March, median 2026 real GDP growth fell from 2.4% to 2.2%, while headline PCE rose from 2.7% to 3.6%, core PCE from 2.7% to 3.3% and year-end fed funds from 3.4% to 3.8%. These were comprehensive assessments, not solely war effects, but they displayed a negative-supply-shock pattern: slower growth, much higher core inflation and a higher desired restrictive rate.
July price reports reduced the immediate urgency to hike again. CPI rose 0.1% monthly and 3.4% annually; core CPI 0.2% and 2.5%. PPI was flat monthly but 4.7% annually, while excluding food, energy and trade services it rose 0.4% monthly and 4.7% annually. Short-term consumer-price momentum slowed, but upstream and intermediate costs still needed absorption. One PPI reading could not establish that pass-through into PCE had ended.
Labor signals were contradictory. July payrolls unexpectedly fell 23,000 and the prior two months were revised down 103,000, clearly showing broadly weaker hiring. Unemployment nevertheless edged down to 4.1%, initial claims stayed historically low and no broad layoff wave emerged. This looked like frozen labor-market turnover—defensive low hiring and low firing, rather than a collapsing layoff spiral. Retail sales fell 0.6% and the control group 0.4%, indicating inflation was eroding household spending capacity, but one weak month could not establish imminent broad recession.
The July semiannual Monetary Policy Report confirmed deeper divergence. First-quarter real GDP grew 2.1% annualized; real consumption grew only around 1.3% annualized in the first five months, and housing investment stalled. High-tech capex and advanced-manufacturing productivity remained strongly resilient. The economy showed a barbell of pressured households and property versus strong technology investment and manufacturing. This extended the observation window: demand was not weak enough to require immediate cuts, while core inflation was not soft enough for comfort.
Cuts do not necessarily require labor collapse. June's median long-run neutral rate was 3.1%, below the current target midpoint of 3.625%. If core PCE repeatedly converged to monthly gains such as 0.15%–0.20%, consistent with 2% annually, and expectations stayed anchored, falling inflation would mechanically tighten real restraint even with unchanged nominal rates. A preventive or neutralizing 25-basis-point cut would then be theoretically and practically justified without sharply higher unemployment. The obstacle was June's 3.3% full-year core PCE forecast and the lack of enough consecutive low-inflation months.
Tariffs, tighter immigration and fiscal expansion further destabilized the trade-off. Tariffs initially raise landed import costs; consumer pass-through depends on firms' absorption and margins. Structurally slower immigration permanently lowers potential labor supply and reduces the monthly job gains needed to keep unemployment stable. Large deficits and rising military spending support demand while supplying enormous quantities of long Treasuries. With these forces intertwined, weak payrolls no longer directly imply faster disinflation, and old employment thresholds cannot mechanically set cut timing.
Long rates are testing policy credibility
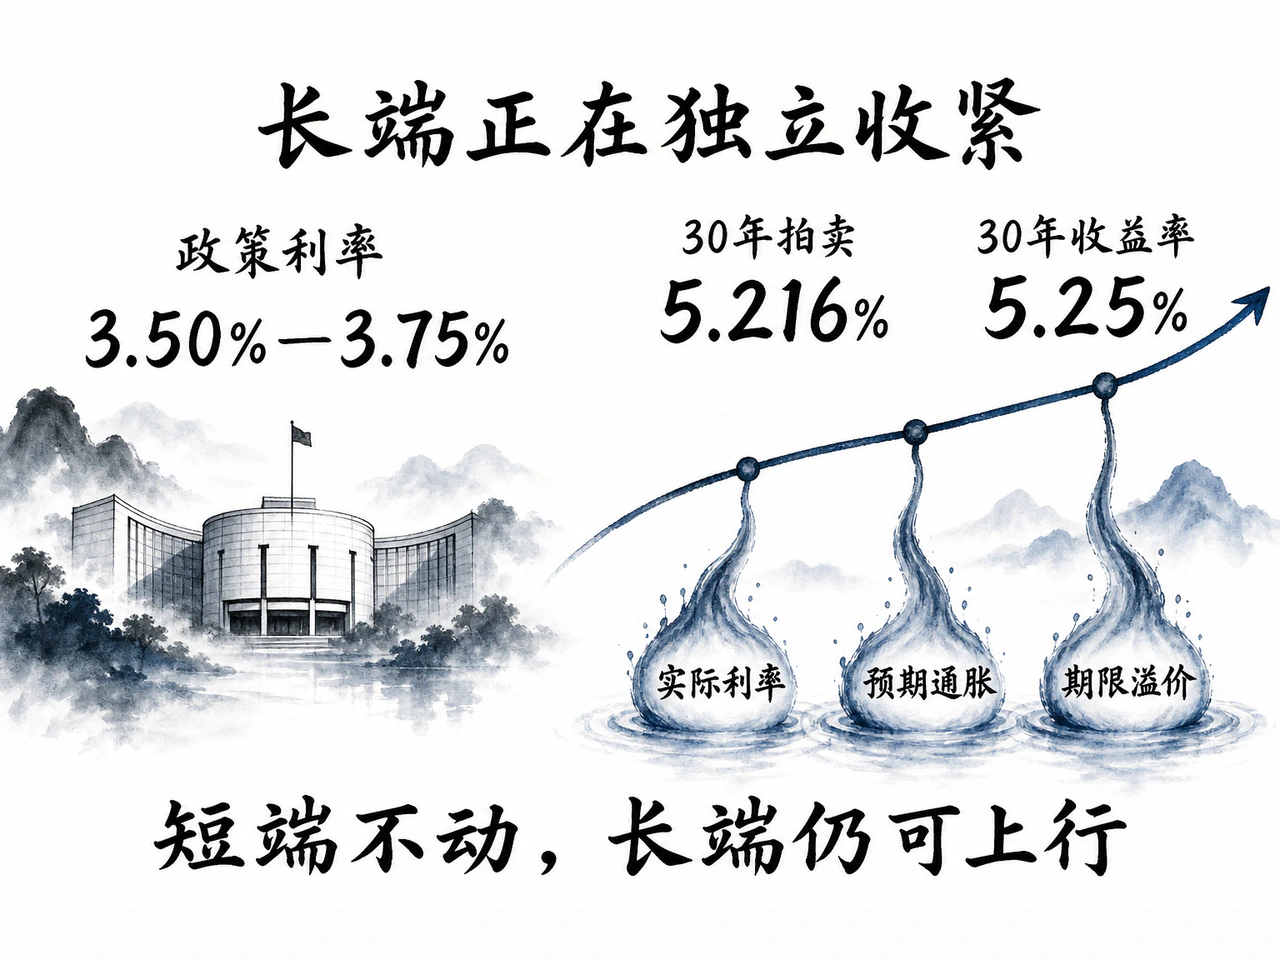
The August 13 30-year Treasury auction yielded 5.216%, highest since 2001. The next day's official closing curve put the 30-year at 5.25%. High long rates constrained mortgages, commercial-property refinancing and long-horizon capex. Even if the Fed held short rates unchanged, overall financial conditions could keep tightening.
Nominal long yields can be decomposed into expected future real short rates, long-run inflation expectations and a term premium incorporating inflation uncertainty, supply–demand imbalance and duration volatility. If rising natural real rates or difficulty absorbing deficit-driven duration mainly lift yields, market tightening can replace some policy hikes. If instead yields surge from fears of uncontrolled inflation or lost faith in independence, this is a credibility penalty rather than benign bond-market tightening on the Fed's behalf. Distinguishing the cases requires systematic comparison of breakevens, TIPS, term-premium models, mortgage spreads and high-yield credit spreads.
Global pricing anchors were dangerously splitting. Short-end money funds and swaps traded meeting odds and dots, while the long bond market rapidly absorbed structural premiums for huge deficits, post-election intervention risk and prolonged geopolitics. Households' and companies' ultimate financing constraint was no longer fed funds at 3.50%–3.75%, but a long risk-free anchor above 5.25%. A year-end Fed hold would not mean the real economy escaped another gradual tightening.
September–December: hold as baseline, hikes as the main tail
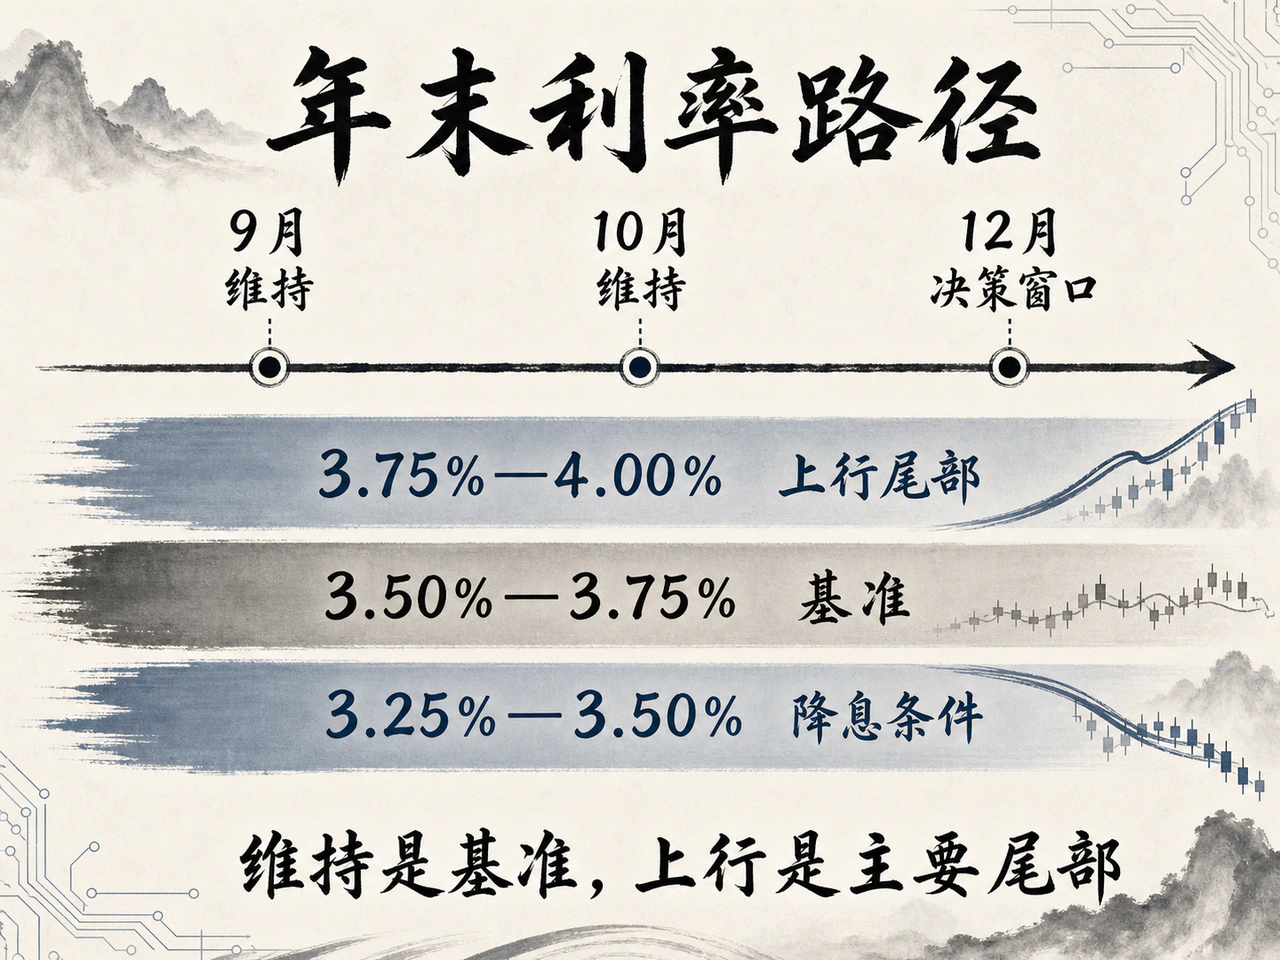
At September 15–16, holding 3.50%–3.75% remained most likely. A new SEP would help clarify how much lower energy reached core services, whether weak hiring spread into broad layoffs and whether extreme long yields reflected supply term premiums or a warning about inflation and credibility. July data neither justified cuts nor created enough urgency to force an immediate September hike.
The October 27–28 meeting falls only six trading days before November's midterm vote. The consensus hold rests on the evolution of fundamentals, rather than political avoidance. U.S. policy has no pre-election blackout; repeated 75-basis-point hikes before the 2022 election demonstrate that. Proximity to voting mainly raises the communication threshold: either a surprise hike or cut needs compelling economic evidence beyond political noise for markets and Congress.
December 8–9 is the most consequential window for policy uncertainty. Elections will be over, new dots and forecasts available and autumn inflation and labor evidence clearer. The baseline remains a strong likelihood of 3.50%–3.75%, with the distribution tilted modestly toward 3.75%–4.00%. Half of June participants expected at least one further hike, and three July voters formally dissented for one. Tightening is no fringe view. Whether moderates shift depends on core inflation, long expectations and employment jointly signaling renewed inflation. June's dots predated weak July conditions and cannot be treated as a fixed road map.
The broad triggers for three year-end paths are:
- Hold, the baseline: core PCE keeps cooling at the margin but annual inflation remains well above 2%; unemployment stays near June's central 4.3%–4.4% range, claims and layoffs do not deteriorate broadly, and long expectations remain anchored.
- Another 25-basis-point hike, the main tail risk: three-month annualized core PCE rises back above 3%; data confirm widespread transmission of geopolitical premiums into services, utilities and tariff-sensitive durables; long inflation compensation jumps; unemployment remains below 4.2% without abrupt weakening.
- A defensive 25-basis-point cut, the secondary tail, has two routes. One is core PCE monthly growth repeatedly at 0.15%–0.20% or less with anchored expectations, naturally allowing a move toward neutral. The other is fourth-quarter unemployment rapidly approaching the SEP range's upper 4.6%, alongside systemic deterioration in initial and continuing claims, layoffs, average hours, the retail control group and private-sector credit spreads.
Current fundamentals still make 3.50%–3.75% the firmest year-end 2026 landing point. Renewed autumn core inflation and higher long expectations make a one-step hike the principal tail risk. Sustained inflation fully consistent with 2% could restore neutralizing defensive cuts to discussion even without a complete payroll stall. Intensifying politics changes how markets interpret the motives for these opposing choices and how strongly long-bond premiums respond, but cannot replace the dual mandate. Lower oil only removes a surface headline-inflation impulse. Opening the door to a cutting cycle still requires prolonged evidence of falling core prices and defended central-bank credibility.


