On August 20, 2026, Treasuries quickly surrendered much of the rally caused by expanded buybacks. On Wednesday, the Treasury doubled the per-operation liquidity-support buyback cap for ten-to-thirty-year securities to $4 billion, sending the thirty-year yield down about nine basis points. On Thursday, five-, ten- and thirty-year yields each rebounded four basis points to 4.39%, 4.69% and 5.23%. Bessent added in a morning interview that individual operations could exceed $4 billion, but the thirty-year only briefly fluctuated before rising again. The marginal boost from verbal intervention lasted one session, while the actual expansion would not begin until September 9.
Macro and company fundamentals diverged sharply. August Philadelphia Fed manufacturing reached a five-year high, while Walmart's comparable-sales growth sank to a near-six-year low. A fifth consecutive oil increase revived bond-market inflation premiums. Equities repriced traditionally defensive consumer staples as cyclical, prompting reconsideration and rotation of defensive positioning.
Bonds: the entire long-yield increase comes from inflation compensation
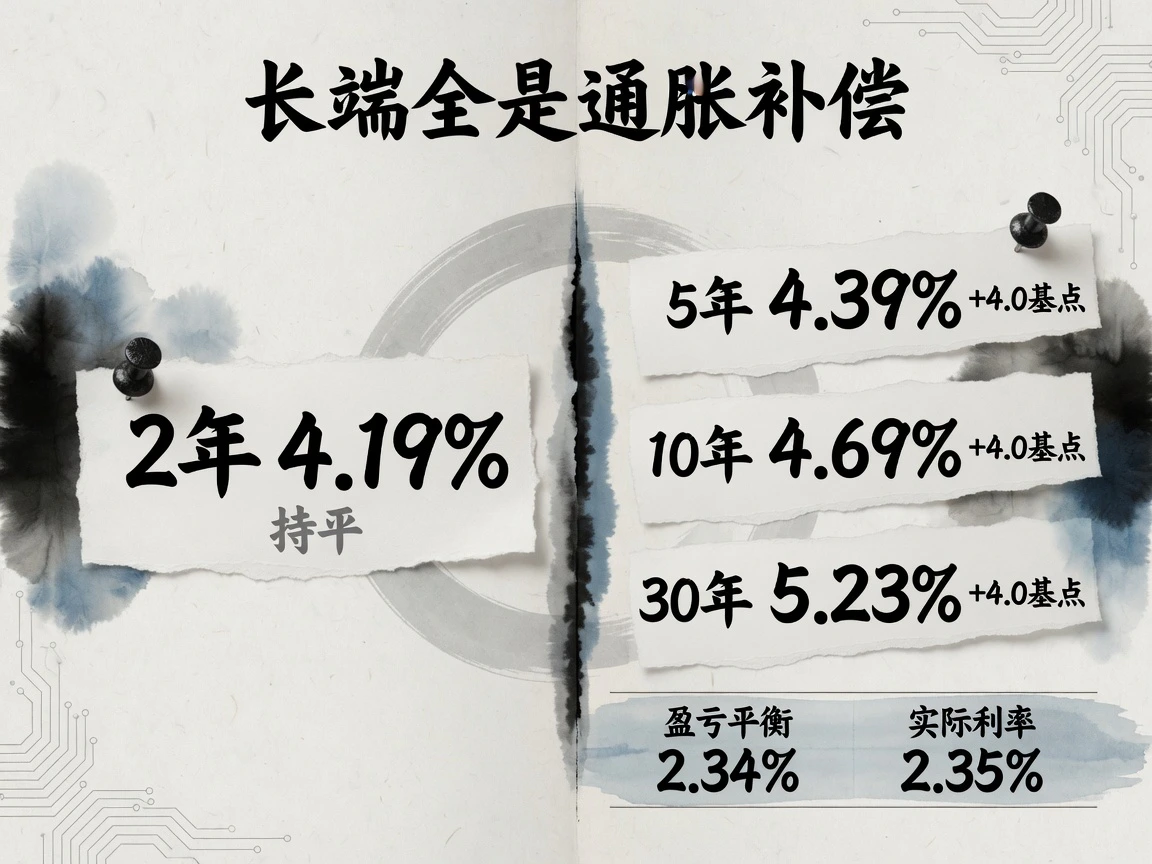
At Thursday's close, five-, ten- and thirty-year yields each rose four basis points, while the two-year remained anchored at 4.19% for a fourth session. The curve bear-steepened, with 2s10s widening from 46 to 50 basis points.
| Maturity | August 20 close | August 19 close | Daily change |
|---|---|---|---|
| 2-year | 4.19% | 4.19% | Unchanged |
| 5-year | 4.39% | 4.35% | +4.0 basis points |
| 10-year | 4.69% | 4.65% | +4.0 basis points |
| 30-year | 5.23% | 5.19% | +4.0 basis points |
The detailed rate structure showed nearly all of the long nominal-yield increase coming from inflation compensation. Ten-year breakevens rose from 2.30% to 2.34%, with implied real yields broadly unchanged near 2.35%. Brent's return above $93 a barrel prompted a renewed premium for inflation protection and rebuilding of hedges released after the liquidity-buyback announcement.
Primary auctions confirmed this structure. Thursday's $8 billion thirty-year TIPS reopening cleared at a high 2.973% real yield, with a 2.82 bid-to-cover ratio. Indirect bidders, mainly foreign central banks and non-U.S. institutions, took about 84%, the strongest demand in more than a year. Institutions bought inflation protection heavily near a 3% ultra-long real yield while remaining cautious on nominal long bonds, reflecting concern over fiscal deficits and persistent second-round inflation.
Rate futures lifted September hike odds from about 31% toward 35% overnight, but the two-year barely moved. The front end still reflected a September hold baseline, while the long end priced premiums from oil, geopolitics and fiscal supply. Total U.S. government debt passed $40 trillion that day; Bessent played down any special significance in the number. Mainstream Wall Street responses to liquidity buybacks were muted, generally viewing them as marginal administrative adjustments unlikely to reverse the endogenous long-yield center amid expanding supply.
Macro: manufacturing at a five-year high, with no bad employment news
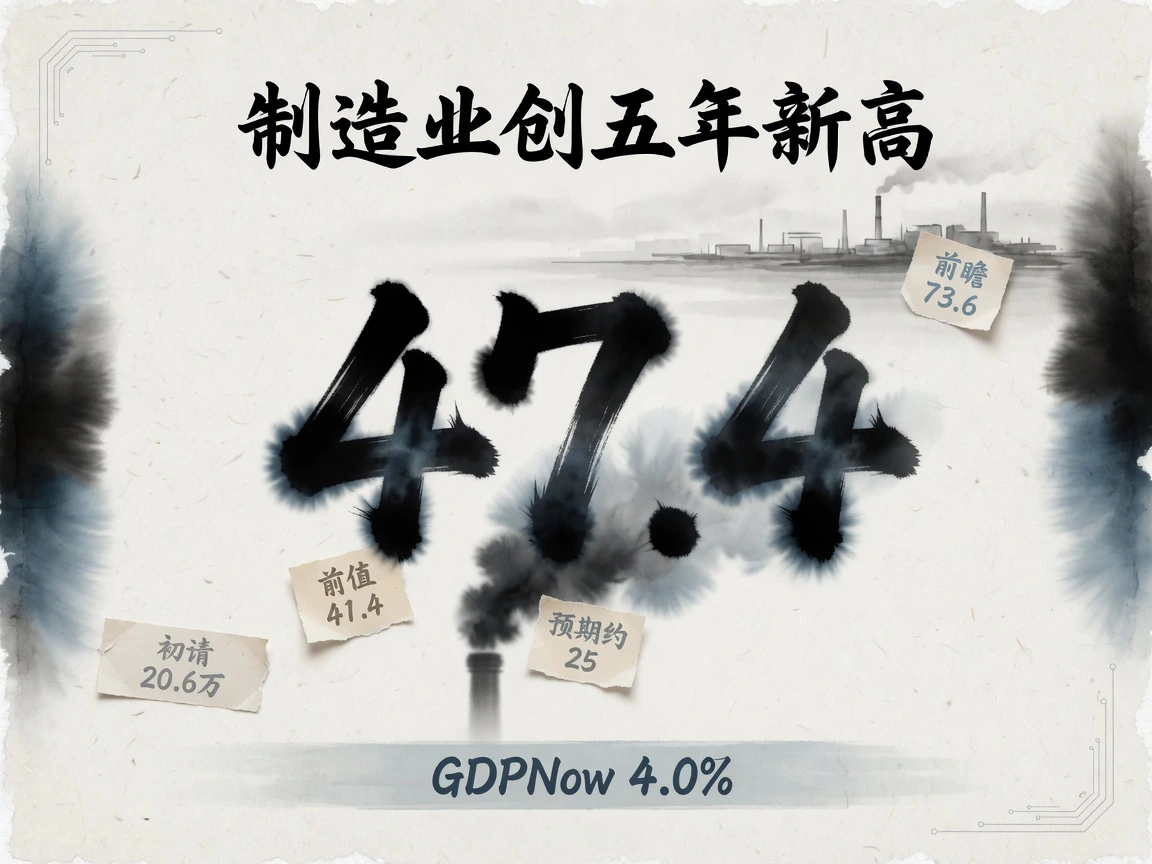
Thursday's data further supported long yields. Initial unemployment claims were 206,000, below expectations of 210,000, continuing a low-layoff, low-hiring pattern. There was neither a layoff wave forcing an urgent Fed pivot nor definitive evidence that employment had fully stabilized.
The major upside surprise was Philadelphia Fed manufacturing. August current activity jumped from 41.4 to 47.4, well above consensus near 25 and the highest since April 2021. Employment reached its highest since April 2022. Six-month expected activity surged to 73.6, the highest since 1983, while prospective capex reached a near-53-year high. Prices paid and received both fell to their lowest since February. Strong current output and investment intentions alongside narrower selling-price diffusion modestly increased September tightening odds without disturbing the two-year's sideways pattern.
The Conference Board LEI's six-month growth turned positive for the first time in nearly four years, while Atlanta Fed GDPNow maintained a strong 4.0% annualized third-quarter forecast. The next test was July PCE on August 26. Cleveland Fed nowcasts still put annual core PCE around 3.34%; confirmation would reinforce the recent minutes' guidance toward further tightening if inflation stalled. Officials were hawkish too. St. Louis Fed President Alberto Musalem said policy rates remained below long-run neutral and financial conditions were quite loose, favoring earlier, gradual tightening over later forced large hikes. He did not commit to September, retaining flexibility. Attention turned to Jackson Hole on August 27–29, with Chair Warsh's keynote scheduled August 28.
Commodities: oil rises for a fifth day; nearby supply is tight but deferred pricing remains calm
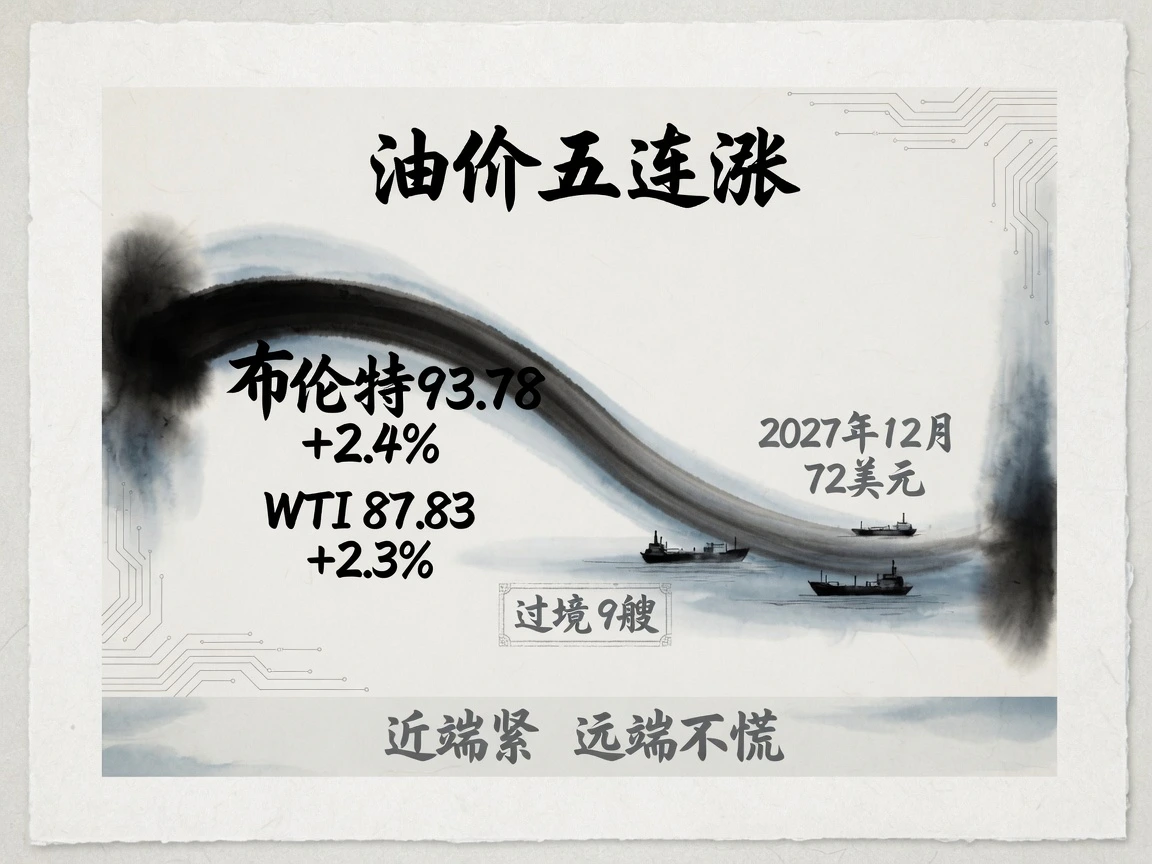
Crude rose for a fifth consecutive session, driven entirely by geopolitical premiums. October Brent settled up 2.4% at $93.78 a barrel and expiring September WTI up 2.3% at $87.83, both highest since July 24. Washington threatened secondary sanctions on partners supporting Iran, while Bessent promised details Monday. Actual Hormuz traffic remained near a standstill: Kpler counted only nine visible merchant ships on Wednesday, far below normal.
Deep backwardation reflected tight immediate supply and expected later normalization. Nearby premiums were high, while December 2027 remained near $72 a barrel. Buyers paid for currently deliverable physical crude without pricing permanent scarcity. Products diverged too: WTI gained 2.3%, but RBOB gasoline only 0.24%, as the EPA allowed a roughly two-week-earlier transition to winter gasoline on September 1, easing formulation costs at retail. Supply tension accumulated more in diesel and other middle distillates and export delays.
Precious metals followed a separate contest. Strong early jobs and Philadelphia data initially pressured spot gold toward $4,450 an ounce. Later, Bessent's suggestion of uncapped buybacks helped recover losses, with December COMEX gold closing up 0.6% at $4,571.40. Nominal yields and inflation compensation each rose four basis points, leaving real rates unchanged. Gold essentially traded a discount to confidence that Treasury intervention could truly suppress long yields. Some investors read expanding debt supply and buybacks as a possible prelude to deficit monetization, adding hedging premiums for non-interest-bearing assets. Spot silver was stronger, up 1.9% at $68.16 an ounce.
Equities: Walmart loses $80 billion while Asia prices the previous U.S. session
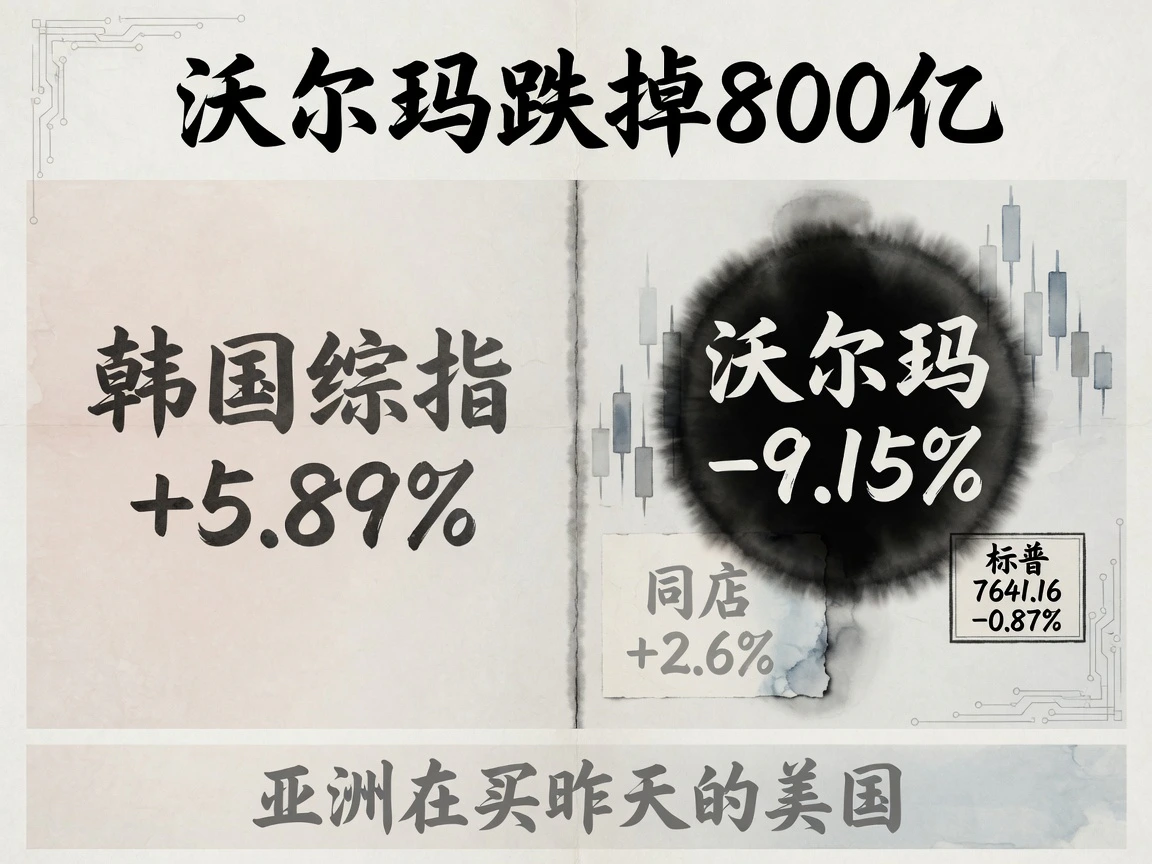
Thursday's Asian and U.S. sessions showed a pronounced timing lag. Earlier Asian closes mainly reflected Wednesday's easing sentiment from expanded Treasury buybacks. Korea's Kospi rose 5.89%, almost recovering Wednesday's plunge; Nikkei 225 gained 1.36%, Hang Seng 0.80% and Shanghai Composite 0.24%. SK Hynix also announced repurchases and full cancellation of KRW 40 trillion, about $28.6 billion, in treasury shares. Its stock surged 12.73%, lifting Samsung 9.49% and broadly repricing shareholder-return expectations for memory chips.
During regular U.S. trading, the narrative switched to rebounding Treasury yields, higher oil and disappointing retail results. The S&P 500 fell 0.87% to 7,641.16, Nasdaq Composite 1.00%, and VIX regained 16. Consumer staples led declines at 1.93%, while energy and a few cyclical sectors rose against the trend, changing defensive positioning.
Walmart was the center of the equity storm. Fiscal second-quarter U.S. comparable sales excluding fuel grew 2.6%, below the 3.8% consensus, the slowest in nearly six years and the first miss in at least five. Traffic growth halved from 3.0% to 1.5%. Management said gasoline above $4 significantly affected consumer psychology, with lower- and middle-income households making more cautious spending choices. Despite higher overall revenue and full-year earnings guidance, weak third-quarter EPS guidance triggered selling. Shares plunged 9.15%, erasing more than $80 billion, the worst day since May 2022. Costco, Dollar Tree and other retailers declined as markets reassessed consumer resilience. Technology was not sold indiscriminately: semiconductor ETFs gained, Micron rose nearly 4% and Nvidia fell only 0.33%, with core investors awaiting its August 26 after-hours results. U.S. weakness quickly pressured Japan and Korea in early Friday trade, reversing the previous day's excessive optimism.
Geopolitics: the harshest sanctions, or a menu not yet printed?

The central contest concerned secondary sanctions' practical reach. U.S. officials presented pressure on Iran as a decisive economic campaign, with Bessent promising Monday details and describing sanctions plus blockade as a combined strategy. Thursday's actual official list covered only ten financial intermediaries accused of moving Hezbollah funds. Officials subsequently confirmed it was not the promised comprehensive Iranian energy-trade framework. Despite single-digit Hormuz traffic and ongoing oil premiums for secondary-sanctions expansion, markets had not fully accepted Washington's attempt to substitute economic and financial restrictions for physical military blockade. Today's companion article covers the specific 24-hour Gulf and Iran developments.
Next week's cross-asset tests follow closely. Monday's Treasury briefing will show whether secondary sanctions reach shipping insurers, transit settlement and independent refiners. Two-, five- and seven-year auctions on August 25–27 provide the first intermediate-maturity supply test after expanded-buyback announcements. August 26 brings July core PCE, EIA inventories and Nvidia earnings together. At Jackson Hole on August 27–29, whether Warsh directly supports earlier, gradual hikes will help determine fourth-quarter global liquidity. Any one outcome could recalibrate the current curve of a wait-and-see short end and a pressured, steepening long end.


