The June ceasefire memorandum expired without renewed talks, while the Treasury promised history's harshest Iran sanctions on Monday. Oil benchmarks rose for a second consecutive week, with Brent regaining $94 a barrel and a near-one-month high. Friday nevertheless showed divergence: Brent remained firm, WTI stalled under the contract roll and inventory builds, and nearby spreads softened. Investors continued paying for cutoff risk while shifting their focus to the force of Monday's sanctions details.
Market action: Brent stays firm as the roll weighs on WTI
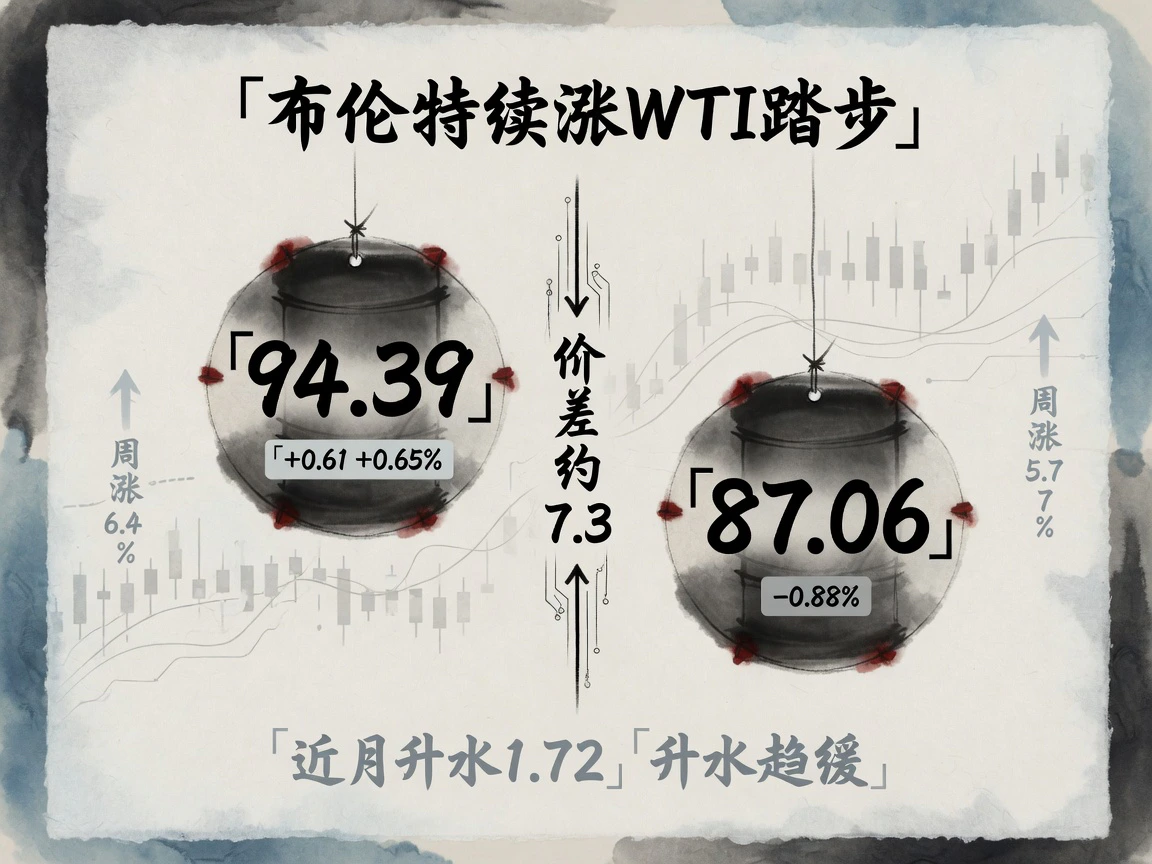
At the August 21 settlement, active October Brent was $94.39 a barrel, up $0.61, or 0.65%, from the previous session. Continuous WTI was $87.06, down 0.88% from the preceding settlement.
WTI's reported daily decline mainly reflected the roll. September expired on Thursday, leaving October as Friday's reference. Comparing October with itself, Reuters showed a small $0.23, or 0.26%, gain. The two measures point in different directions; this article uses the commodity daily-settlement basis for the day. Weekly performance remained clear: WTI rose about 5.7% and Brent 6.4%, both reaching their highest settlements since July 24.
Calendar and cross-benchmark spreads more clearly revealed divided positioning. Brent's premium to WTI widened to about $7.3, deepening the split between geopolitical premiums for seaborne crude and inventory pressure on U.S. inland barrels. Backwardation stayed steep but eased at the very front: October/November Brent narrowed to about $1.72 a barrel from roughly $2.10, while the six-month spread near $11.35 was well below late July's extreme around $19.
Inventories: U.S. crude keeps building, while Cushing and products remain tight
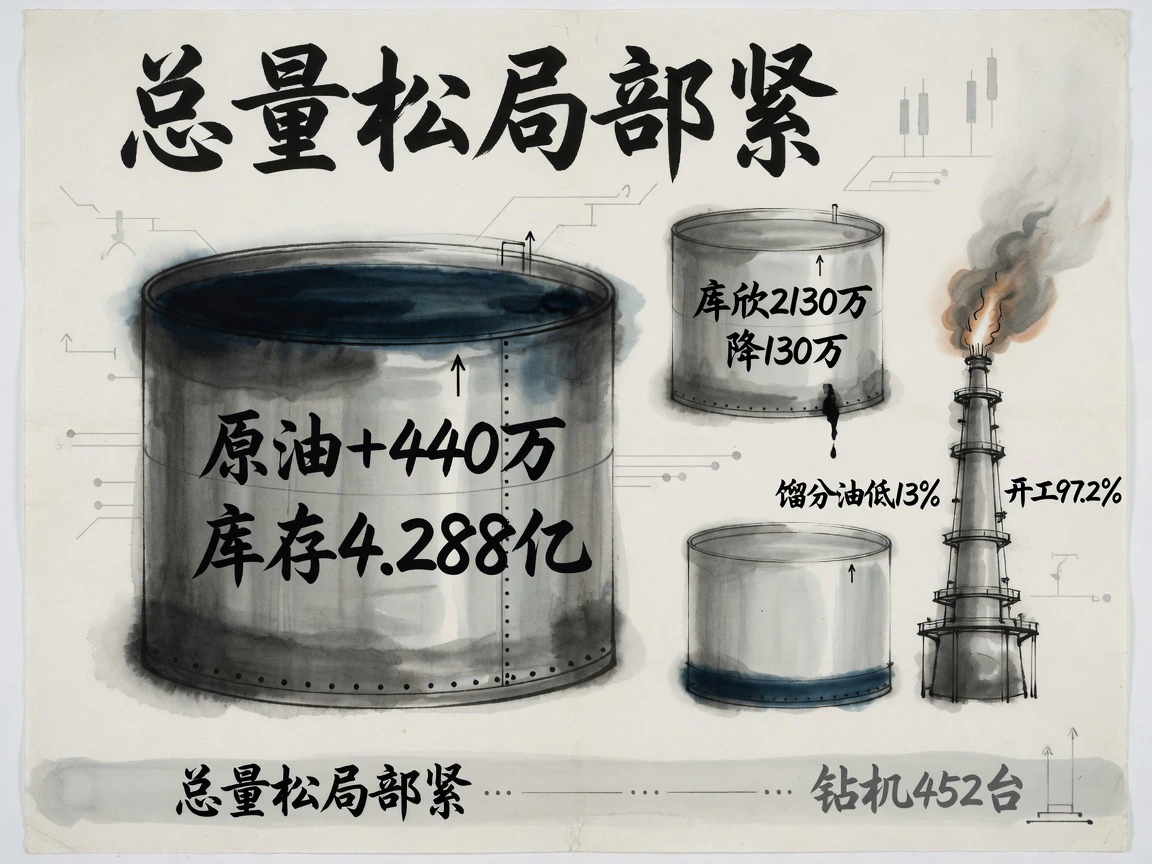
Domestic fundamentals continued to weigh on WTI. The EIA's August 19 report showed commercial crude stocks up 4.4 million barrels to 428.8 million in the week through August 14, a third consecutive build, bringing total stocks back to the five-year seasonal average.
Beneath the aggregate recovery, delivery nodes and products remained structurally tight. Cushing stocks fell 1.3 million barrels to 21.3 million, approaching operational safety limits again. SPR stocks fell 5.3 million to 293.4 million as government releases continued. Distillates fell 1.5 million and remained about 13% below the five-year average. Even refinery utilization of 97.2% had not closed the product gap. Looser total crude, tighter Cushing delivery and tighter products formed the central logic of WTI's substantial underperformance. Upstream spending remained restrained: Baker Hughes reported 452 active U.S. oil rigs on Friday, down three, with only the Permian up two to 267. WTI at $87 had not yet prompted meaningful shale expansion.
Producer policy did not change during the week. Eight OPEC+ countries had decided August 2 to add 188,000 barrels a day of September quota, nominally completing the reversal of 2023 voluntary cuts. The next meeting was September 6, with markets already anticipating a possible Q4 pause. Heavy Hormuz disruption limited the relevance of paper quotas to immediately deliverable supply. The IEA's August report estimated a third-quarter global crude deficit of 1.8 million barrels daily, July Gulf shut-ins of 8.3 million, and cumulative observable global inventory draws of 410 million since fighting began. Non-OPEC supply, mainly the Americas, could add only about 1.4 million barrels a day in 2026, insufficient to fill Middle Eastern and Russian gaps.
Macro conditions: higher yields and recovering risk appetite, but oil follows its own logic
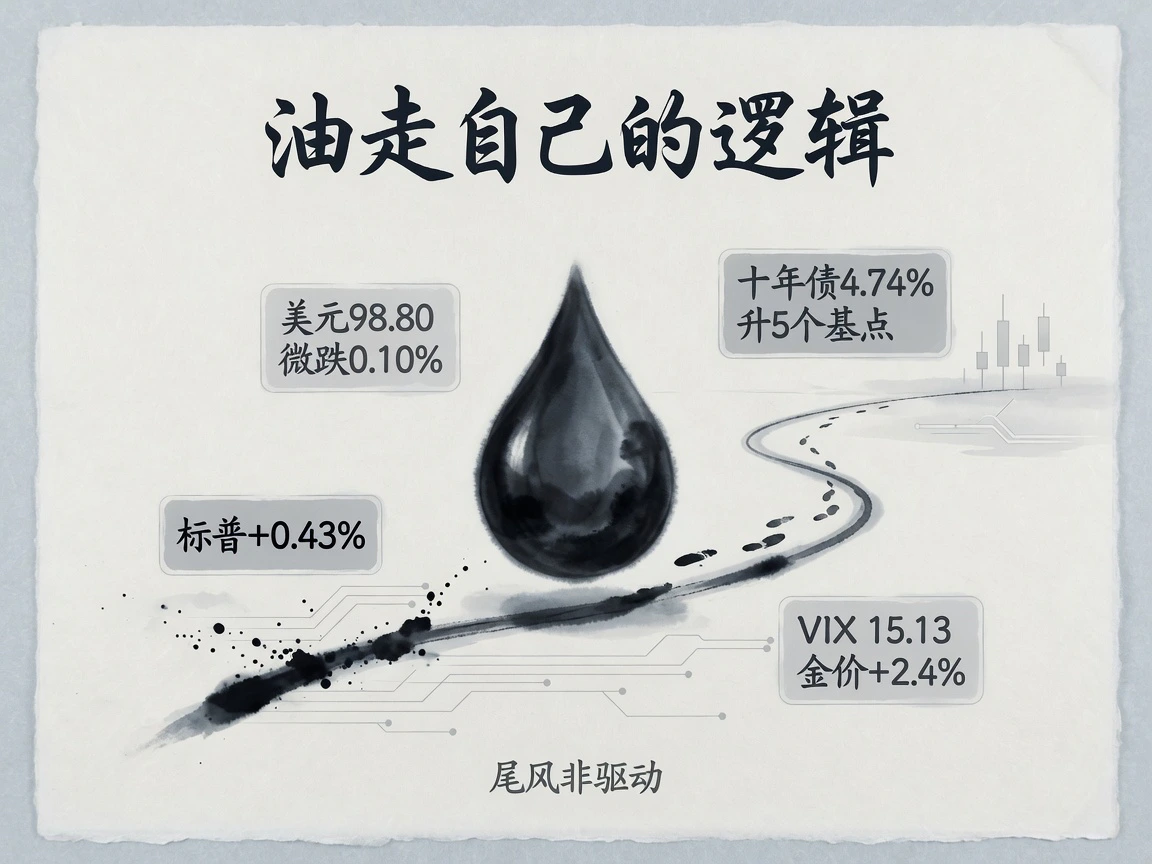
Friday's macro backdrop offered modest support rather than the main driver. The dollar index closed at 98.80, down 0.10%. The ten-year Treasury ended at 4.74%, up five basis points on the Treasury's close-to-close daily par curve, amid slight liquidity-expectation changes. The S&P 500 gained 0.43%, VIX fell 5.5% to 15.13 and New York gold settlement rose 2.4%.
Higher Treasury rates, better equity risk appetite and stronger oil occurred together, showing that immediate supply shocks and geopolitical protection dominated trading. Macro liquidity was not the principal marginal variable.
Geopolitics and shipping: sanctions threats approach implementation while Hormuz traffic stays weak

New geopolitical policy mainly concerned expectations. The June temporary ceasefire memorandum expired that week without U.S.-Iran contacts. On Thursday, Bessent announced a special Monday, August 24 briefing for sanctions covering the whole oil chain, warning third parties buying Iranian crude, settling payments or helping transfers. More than 80% of Iran's seaborne crude goes to China, while Washington's June sixty-day purchase waiver expired around Friday, focusing attention on Chinese buyers' next arrangements. Iran threatened devastating countermeasures. By Friday's close, however, no specific U.S. entity list had appeared and the Hormuz blockade had not escalated militarily. Rhetoric had not yet become a new factual constraint.
Logistical obstruction nevertheless remained severe and measurable. Kpler counted only seven dry-bulk and oil/gas commodity ships through Hormuz on Thursday, nearly half the previous day's number. More than 60% of merchant ships tracked during August 1–19 disabled AIS for dark passage, according to Al Jazeera citing Kpler. Total traffic remained a small fraction of normal. War-risk premiums were 7.5%–12.5% of hull value, with a single VLCC voyage costing up to about $10 million in insurance versus roughly $250,000 before the conflict. Middle East–China VLCC time-charter equivalents were at record $510,000–$520,000 daily. One-way freight reached 19% of the UAE Murban cargo's value, continuing to set records.
Pricing: persistent disruption is priced; Monday's details determine escalation

Spreads and events reveal a clear framework. Large weekly gains reprice failed ceasefire expectations and tougher sanctions. Firmer Brent, flat WTI and slightly narrower nearby spreads indicate pricing for continued existing disruption, while investors wait before assuming it spirals further. The deferred curve is restrained by the IEA's expectation of roughly 4.6 million barrels a day of global surplus in 2027, while immediate physical tightness provides support. The curve therefore remains deeply backwardated with a slightly gentler front slope.
JPMorgan's baseline sensitivity estimate adds $7–$8 to the oil-price center for each additional month of interrupted Middle Eastern shipments. Sanctions directly restricting third-party procurement or provoking aggressive Iranian closure could start another repricing of risk. Measures within the existing framework could instead unwind prepaid premiums rapidly. Friday's stronger equities and lower VIX also showed that geopolitics had not become broad systemic panic.
The next tests are Monday's Treasury briefing and whether it penetrates particular refiners, financial institutions or fleets; the August 26 EIA report, testing a fourth crude build and whether Cushing falls below extreme safety thresholds; daily Kpler traffic and war-insurance rates, showing actual logistics changes; and the September 6 OPEC+ ministerial meeting, potentially giving the first clear signal on a fourth-quarter output pause.


