The threat of imminent tougher U.S. sanctions and unrelieved Hormuz shipping bottlenecks forced prompt physical crude and freight rates into historically extreme territory. Across the full forward curve, however, derivatives were already discounting medium- and long-term capacity recovery and weak global demand. Bulls had clearly moved ahead before Washington formally released sanctions details Monday.
Friday's opposite moves reveal direction through the spread
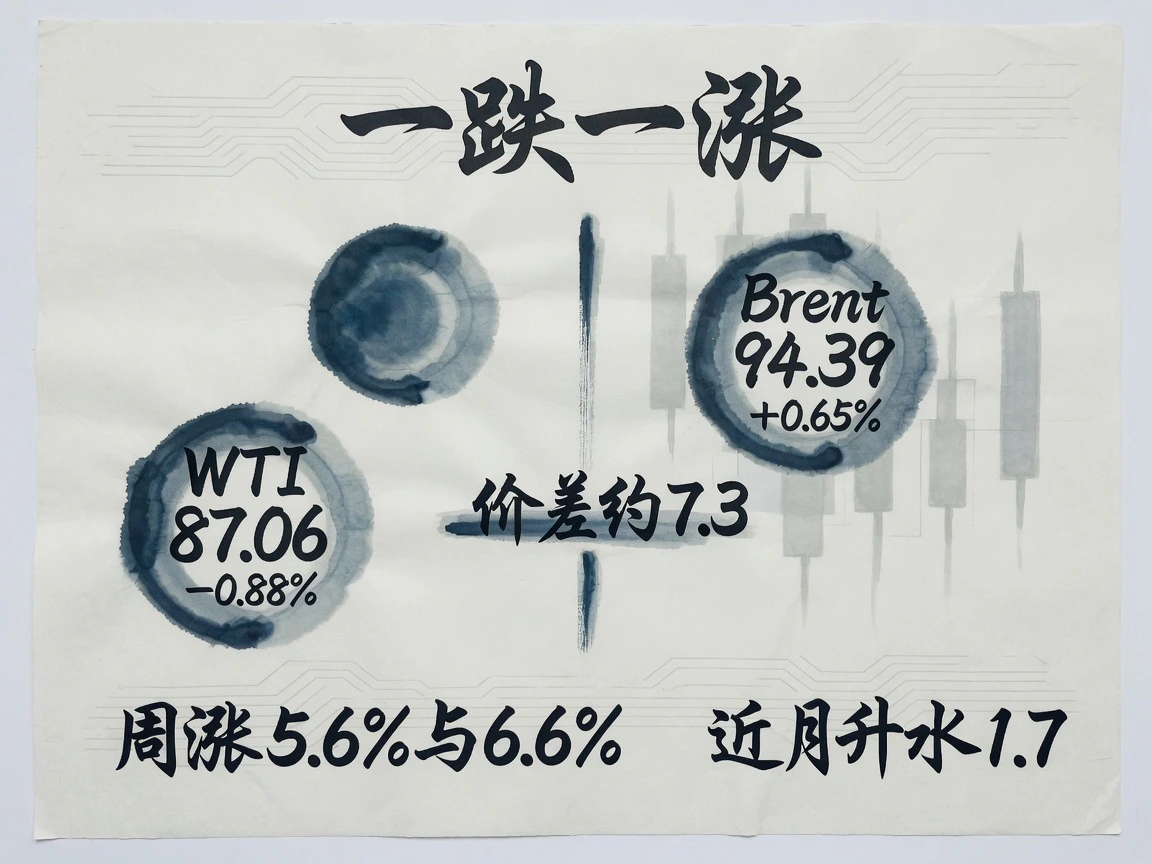
Official August 21 Friday settlements put the main NYMEX WTI contract at $87.06 a barrel, down 0.88% from $87.83. The main ICE Brent contract rose 0.65% from $93.78 to $94.39. Opposite moves widened the transatlantic Brent–WTI spread to about $7.3 a barrel. The conflict-related supply-risk premium was expressed almost entirely in Brent, the benchmark most closely linked to seaborne Middle Eastern physical oil.
The statistical basis needs clarification. Some post-Friday commentary said WTI edged up 0.3%, drawing on a NYMEX market-summary bulletin. The quoted price levels agreed; the opposing direction came from benchmark choice. The first comparison uses official continuous-contract settlement to settlement, while the second compares intraday matched prices for the active month. This article consistently uses settlement to settlement. The weekly bullish trend was unambiguous: oil rose for a second consecutive week, with WTI up about 5.6% and Brent about 6.6% under Dow Jones and Reuters weekly-review benchmarks.
The curve remained steeply backwardated. October Brent settled at $94.39, with November near $92.67, leaving a prompt spread near +$1.7 a barrel. Later contracts declined progressively, all below $80 by mid-2027. The tight-near/looser-far structure was unchanged. At the 08:22 August 24 Beijing-time snapshot, electronic WTI was around $86.0 and Brent $93.3, roughly 1% below Friday's settlements. This opening-sentiment snapshot was not a final daily settlement change.
Crude is available; diesel is scarce

The EIA's August 19 inventory report for the week ended August 14 showed a split picture. Commercial crude stocks rose 4.4 million barrels to 428.8 million, fully eliminating the earlier deficit and matching the seasonal five-year average, after a huge build of 17.4 million barrels the week before. Gasoline rose 700,000 barrels, but middle distillates, including diesel and heating oil, fell 1.5 million and stood around 13% below their five-year average. With refinery utilization already near a historically high 97%, the structure made the microeconomic problem plain: crude feedstock itself was not scarce; refined products, particularly diesel, were.
Signals of medium-term supply growth were accumulating. On August 2, OPEC+ approved a planned 188,000-barrel-a-day increase from September, fully reversing the 2023 voluntary cuts. After leaving quota constraints in May, the UAE continued producing at 3.8–4.1 million barrels a day. Iraq sent a senior delegation to Saudi Arabia on August 21 seeking a larger quota and publicly stated plans to push capacity to 8–10 million barrels a day within six years. U.S. shale output had reached a record around 13.8 million barrels a day. Baker Hughes showed active U.S. oil rigs falling three to 452 in the week of August 21, the first drop in four weeks, suggesting that high prices had not prompted a reckless upstream-capex response. High existing supply nevertheless remained a fact.
Demand projections kept being revised down. OPEC's August 12 report made its fourth cut that year to 2026 demand-growth expectations, to 580,000 barrels a day. The IEA's August baseline was more pessimistic: demand contracting 1.6 million barrels a day year on year and supply falling 4.3 million. It recorded a July drop of 69 million barrels in observed stocks and inferred a third-quarter deficit of 1.8 million barrels a day. The divergence between the institutions' models contained information itself: the IEA's extreme physical shortfall rested on the extreme assumption of sustained, rigid disruption to Persian Gulf strait passage.
Safe-haven moves align, while inflation expectations stay unchanged

Financial liquidity exerted no external squeeze on crude. The dollar index closed Friday at 98.80, down 0.10%. The ten-year Treasury yield finished at 4.74%, up five basis points on the New York closing basis, but ten-year breakeven inflation remained unchanged at 2.34%. The day's nominal yield rise was therefore entirely driven by real rates; bonds added no new premium for a second inflation wave.
London spot gold rose 2.4% that day to a record $4,624 an ounce. The safe-haven and geopolitical premiums in prompt oil aligned with precious metals and were compatible with equities, as the S&P 500 rose 0.4%. Macro investors were positioning around a localized supply shock. Trading had become neither a recession bet on collapsing aggregate demand nor evidence of large cross-asset inflation hedgers sweeping into oil.
Freight is the clearest carrier of this premium

On August 19–20, Washington formally announced what it called the toughest comprehensive economic sanctions ever imposed on Iran. Bessent identified bank settlement, physical oil purchases and cross-border shipping as the main enforcement chain, postponing details to the August 24 Monday press conference. Friday oil had already priced an abrupt supply contraction. Monday's early roughly 1% retreat was therefore revealing: markets distinguished political statements from implementation. Iranian crude exports to China had fallen at the margin but were far from zero. Whether the rules would impose secondary sanctions on major importing entities remained the largest unresolved risk for both sides.
Shipping derivatives and spot markets had converted geopolitical fear directly into expensive delivered freight. On August 19, Middle East Gulf–China TD3C VLCC time-charter-equivalent earnings surpassed $520,000 a day, above roughly $481,000 a week earlier, repeatedly setting records in extreme historical territory. The Baltic Exchange's weekly freight assessment approached WS 570. With effective Hormuz throughput constrained, offshore STS transfers in the Gulf of Oman and off Fujairah had become routine. High freight was embedded in unavoidable delivered costs for Asian buyers; while it stayed elevated, prompt crude's large premium retained firm support.
The curve's two ends tell different stories
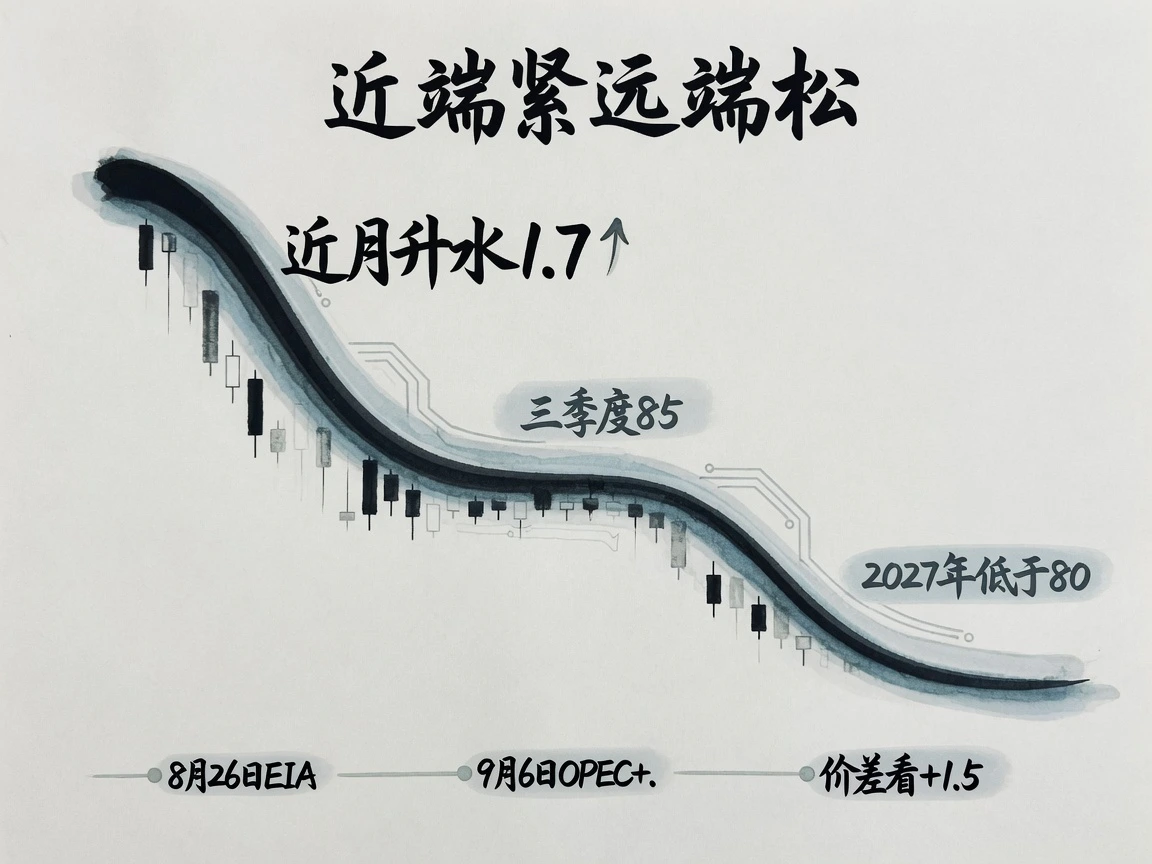
The ends of the futures curve described two distinct balances. Prompt contracts priced sanctions implementation plus a shipping chokepoint, visible in steep backwardation, record freight, low diesel stocks and high Western refining cracks. The far end priced replenishment through high U.S. shale output, unconstrained UAE growth, potential Venezuelan increments and expanding land-based bypass pipelines. Forwards had already established a sub-$80 anchor in 2027, while the EIA placed third-quarter average Brent around $85 before a subsequent decline. Friday's late advance and Monday's swift Asia-Pacific reversal showed that prices were discounting a policy statement; an actual physical cutoff had not yet occurred.
Three anchors mattered next: Monday Treasury enforcement rules, especially secondary sanctions directly targeting major Asian buyers and any transitional waivers; the August 26 EIA report testing whether distillate deficits worsened despite high refinery runs; and the September 6 OPEC+ ministerial meeting, including September quota implementation and Iraq's aggressive request. Actual weekly Hormuz vessel traffic and signs of a top in TD3C freight also deserved close attention. In the oil transmission chain, freight turning points traditionally precede peaks in paper prices. A fall below +$1.5 a barrel in Brent's October–November spread would materially weaken the trade based on extreme prompt physical tightness.


