Understanding the Fed, article 11/20
Macroeconomic data are never final readings carved in stone. Initial seasonally adjusted real GDP, payroll growth and core PCE contain extensive inference from incomplete samples. Fuller accounts, tax records and benchmark censuses lead to revisions over months or years. Institutions' and traders' expectations drift alongside them.
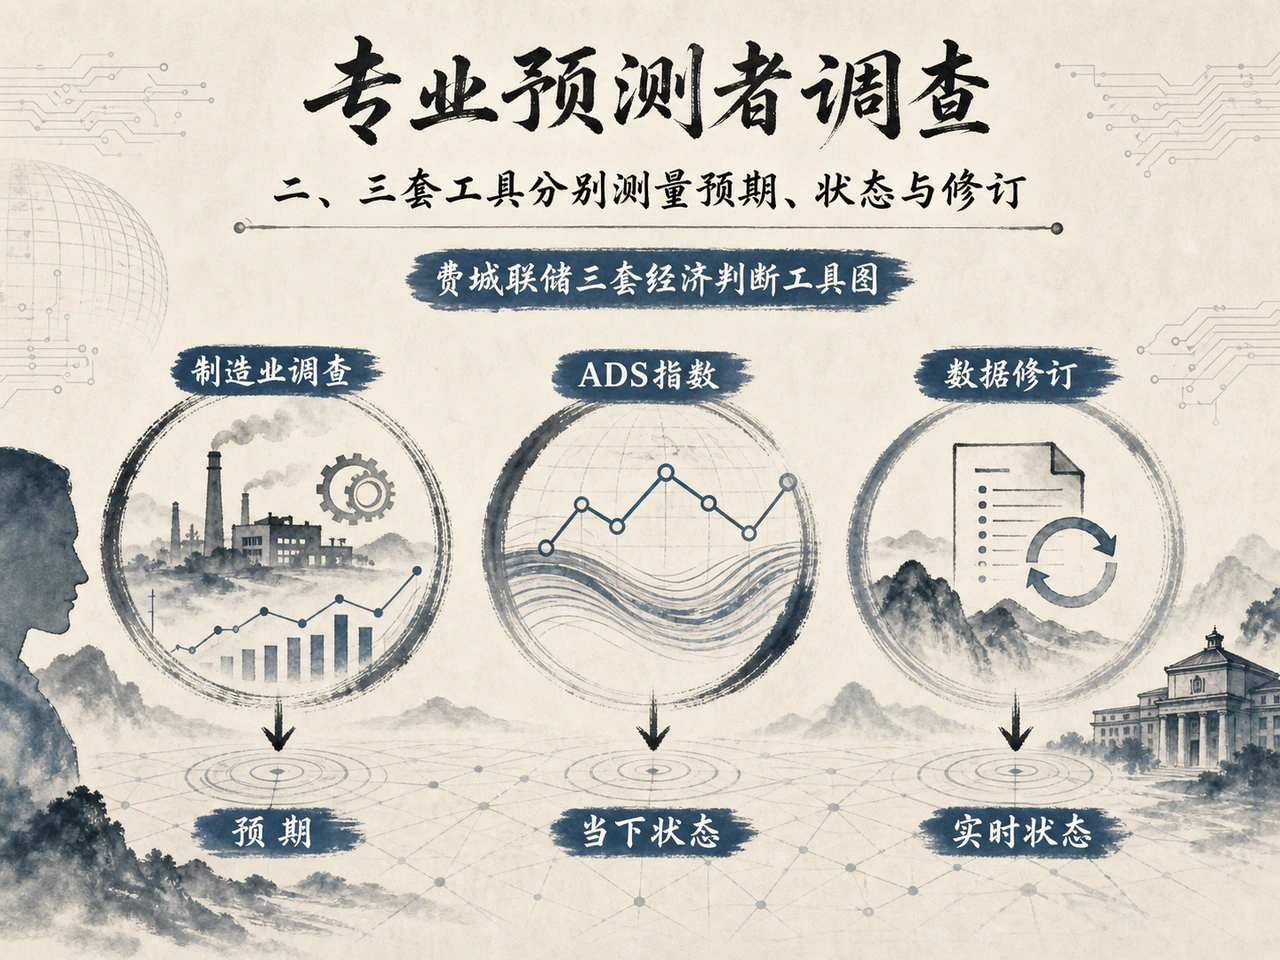
To judge a moving target, the Philadelphia Fed near Independence Hall developed a distinctive empirical toolkit: the half-century-old Survey of Professional Forecasters measures consensus and disagreement; the mixed-frequency dynamic-factor ADS index cuts through reporting lags to current conditions; and the Real-Time Data Set preserves vintages to reconstruct what decision-makers actually knew before revisions.
The Third District covers Delaware, 9 southern New Jersey counties and 48 eastern Pennsylvania counties. It is headquartered in Philadelphia without branches. Its compact territory is highly diverse: capex- and trade-sensitive manufacturing, specialty chemicals and ports; defensive healthcare and higher education, or Eds and Meds; Delaware incorporation and credit-card finance; and urban services. These sectors do not share one cycle.
1. Manufacturing is prominent but is not the entire Third District

Why a regional survey moves national markets
Each midmonth, the Manufacturing Business Outlook Survey can move global trading screens. Arriving about two weeks before national ISM manufacturing PMI, it is treated as an early probe of US industry and inflation.
Results mainly use diffusion indices: the share reporting improvement minus the share reporting deterioration. A positive reading means more firms improve than worsen, not an equivalent percentage rise in output or order value. It measures breadth rather than depth. In an extreme case, modest recoveries at two small processors can offset a severe shutdown at one large heavy-industrial firm.
The district also differs from national industry. It emphasizes specialty chemicals, metals, industrial machinery and food processing, lacking Detroit's auto assembly and Gulf energy extraction. Monthly responses are limited, usually around a hundred, so weather, local logistics or extreme answers by a few firms can produce exaggerated swings. New York's Empire State and Philadelphia surveys frequently point opposite ways in the same month.
Analysis must go beyond the headline general-business-activity index. Are orders and shipments improving together? Are backlogs accumulating? Are employment and hours expanding? Is the prices-paid/received gap widening? Only consistent components, later tested against national ISM and industrial production, give an unusual reading genuine macro-pricing value.
Healthcare, education and urban services follow another cycle
Traders watch factory signals, but most livelihoods and credit fundamentals lie outside factory walls.
Philadelphia has leading education and medical clusters. Penn, Temple and affiliated health systems are major employers funded by tuition, research, relatively rigid health spending and donations, giving them defensive qualities. Delaware's business-friendly corporate law and Court of Chancery attract incorporation of over half of US listed companies, supporting corporate administration, litigation, card settlement and wealth management. Eastern Pennsylvania's highways and ports create an e-commerce and cold-chain corridor serving tens of millions on the East Coast.
Their monetary transmission differs. Hikes first revalue assets and pressure mortgage applications, commercial-property refinancing and bank credit appetite, then raise capital costs and discourage manufacturing expansion. University research, hospital activity and everyday services often feel rates only through slower budget and wage cycles.
Reducing the whole district to the manufacturing index invites partial understanding. Community contacts, large high-frequency settlement monitoring and worker-focused consumer-finance surveys bring services and households into the picture, preventing policy assessment from following one fragile industrial curve.
2. Philadelphia's three rulers measure expectations, the present and revisions
SPF collects professional forecasts, not Fed views
The Survey of Professional Forecasters is a major US expectations survey. Founded in 1968 by the American Statistical Association and NBER and transferred to Philadelphia in 1990, it is the country's oldest quarterly professional macro forecast archive.
Respondents are dozens of professional analysts at investment banks, think tanks, multinationals and universities, not a random public sample. Alongside point forecasts of GDP, payrolls, unemployment and core PCE over quarters and years, it collects subjective distributions—for example, recession probabilities over four quarters and chances inflation exceeds thresholds. It captures median consensus, uncertainty and perceived fat tails.
Professional status is no guarantee of foresight. Herding and backward-looking inference leave consensus slow at recessions or inflation regime shifts. Its irreplaceable value is tracking expectations' evolution: do 10-year CPI/PCE averages remain near 2%? Is disagreement narrowing or widening? Does the recession probability distribution show a meaningful right skew?
SPF reflects independent private and academic judgments, not Philadelphia's official model and not the FOMC's quarterly SEP or dot plot.
ADS asks where the economy stands now
Policymakers cannot see the full present in real time. Quarterly GDP arrives months late; monthly jobs and CPI also have lags and measurement error. Aruoba, Diebold and Scotti developed the ADS Business Conditions Index to address that blind spot.
ADS uses a nonlinear state-space model and dynamic-factor analysis to combine weekly claims, monthly payrolls, industrial production, real personal income excluding transfers, real manufacturing and trade sales, and quarterly real GDP. It filters idiosyncratic noise to extract one latent common condition factor and reports deviations from long-run historical averages. Zero is the benchmark: positive readings indicate above-average momentum and negatives weakening expansion.
Mixed-frequency tracking means dynamic reshaping. Each new weekly or monthly observation updates current estimates, while historical BLS or BEA revisions also rewrite the index's past. It is not a simple substitute for GDP growth, but a sensitive compass near turning points.
The Real-Time Data Set for Macroeconomists complements ADS. Hindsight uses years of revised data and can unfairly make past turns look obvious. Philadelphia preserves actual release vintages at historical dates since 1965, allowing researchers to remove hindsight bias and reconstruct the information available at each decision. Policy evaluation must begin with what officials saw then, rather than revisions years later.
3. The rotating vote matters; the reasoning matters more

Anna Paulson and a formal 2026 vote
Anna L. Paulson became Philadelphia president in July 2025, succeeding Patrick Harker. The statutory district rotation gives Philadelphia an FOMC vote in 2026, putting her in a formal rate-setting seat only half a year after arrival.
Previously Chicago's research director, Paulson studied financial-institution behavior, household balance sheets and systemic vulnerabilities. Her 2026 remarks reflected that empirical background: housing-supply rigidity and inflation lags, actual labor supply-demand balance, and the time needed for AI investment to deepen capital and improve productivity. She repeatedly warned against rigid rules under uncertain supply and geopolitical shocks, retaining flexibility to correct course as information changed.
Voting presidents can move FX and rates derivatives, but permanent hawk or dove labels are crude and dangerous. Voting status rotates annually. More valuable is reasoning: which sticky prices persist, whether wages threaten expectations, and how far capex has transmitted into total-factor productivity. Understanding these mechanisms can provide insight before views shift.
Put four tools on one timeline
With noise and repeated revisions, the answer is not a single crystal ball. Embed the tools in one multicycle, mixed-frequency assessment sequence:
First, early reconnaissance: the midmonth manufacturing survey captures frontline production and business conditions.
Second, cross-check: look through the diffusion headline to orders, backlogs, hiring/hours and prices paid, seeking consistent movement and avoiding small-sample outliers and sentiment premiums.
Third, anchor conditions and expectations: use SPF for consensus, long-run inflation anchoring and dispersion in recession probabilities; use ADS to filter different reporting cycles and locate current conditions relative to average potential output.
Fourth, historical comparison and final checks: stress-test preliminary official readings against revision histories in the real-time database, then await payrolls, GDP and successive revisions.
Consider a sharp monthly rise in manufacturing prices paid. Two very different interpretations are possible:
If SPF's 10-year inflation expectations remain at 2% and ADS stays low and negative, the move likely reflects raw-material supply friction or temporary geopolitical pass-through rather than overheated demand. Excess tightening could create unnecessary recession risk.
If prices rise with explosive orders, ADS breaks above normal ranges and SPF's medium-term inflation distribution shifts toward a high fat tail, that signals overheating plus unanchored expectations, making additional restraint unavoidable.
Philadelphia's deepest lesson is respect for statistical illusion and cognitive limits. Seeing the present is hard as well as forecasting the future. Official data change, surveys retain bias and models depend on historical regimes. Rather than seeking a permanently infallible indicator, align expectations, current conditions and revision vintages on one timeline and approach the economy through mutually confirming evidence.