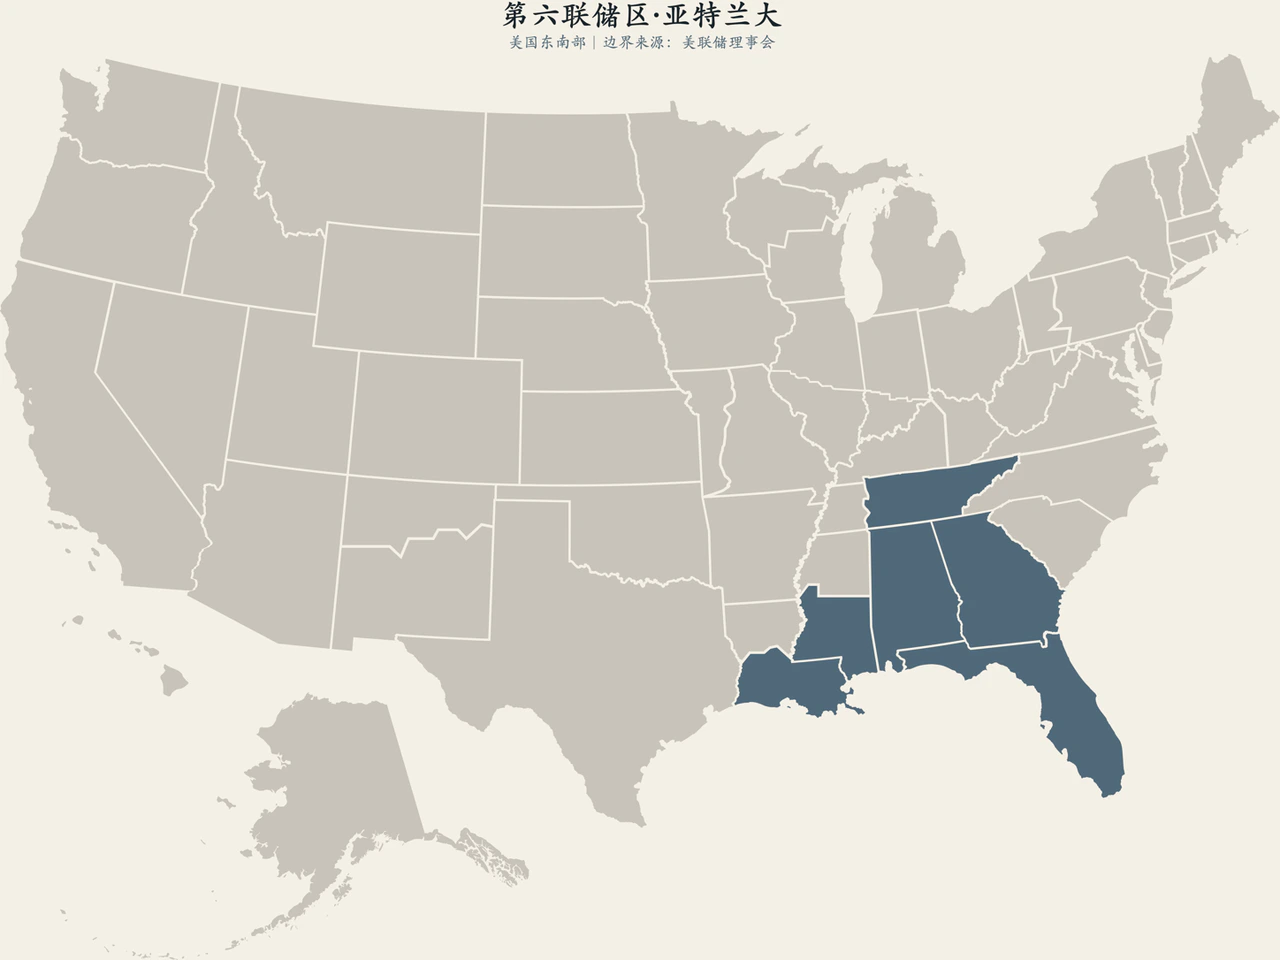
Understanding the Federal Reserve, article 20/20
Judging the American West only by California's technology bull market or Hollywood consumption would produce a deeply distorted sketch.
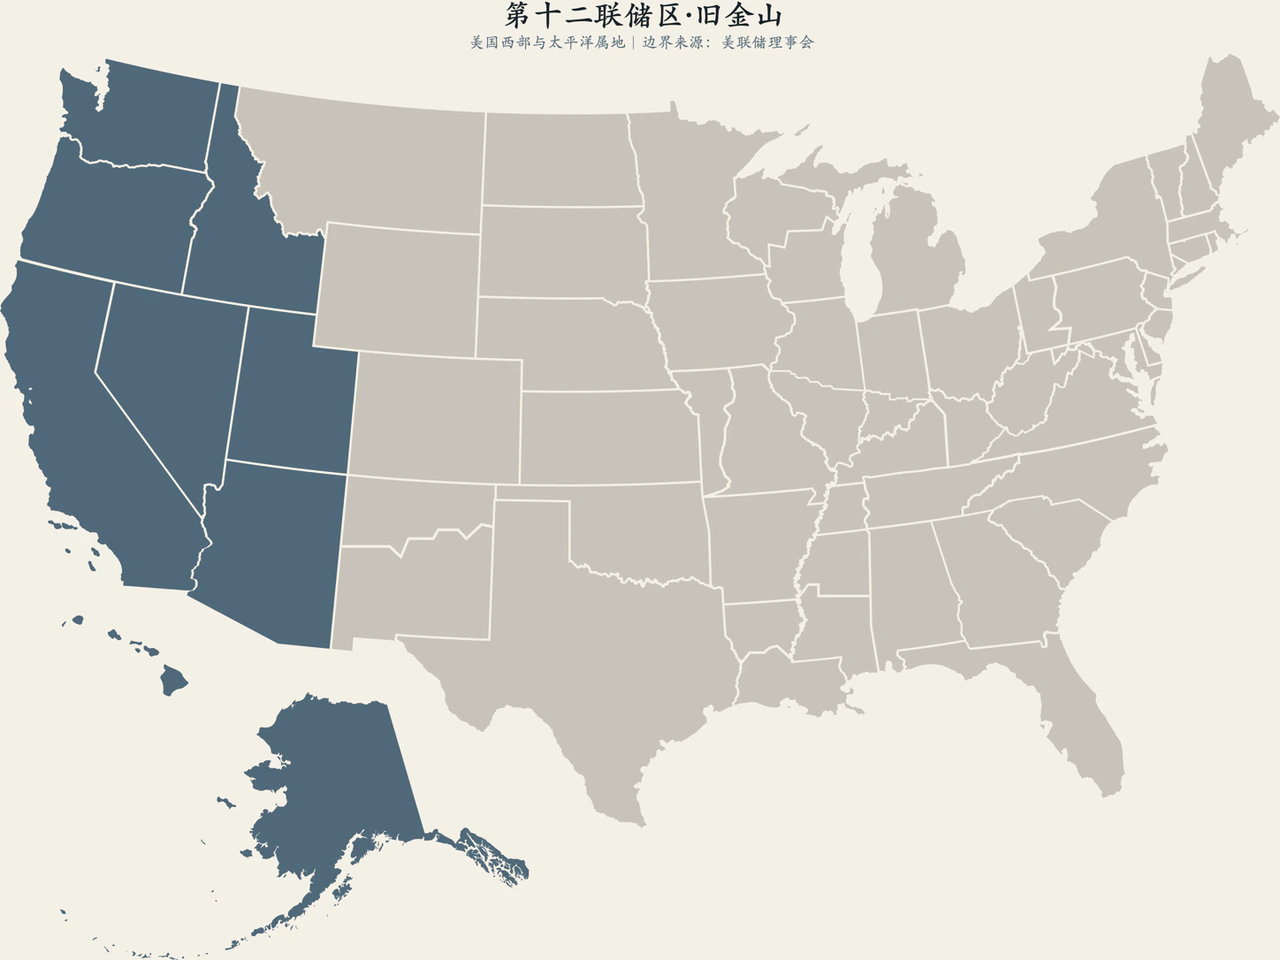
The Twelfth District, San Francisco, has the widest geography and greatest heterogeneity among the twelve districts, stretching from Alaska's icefields to Hawaii and west to Guam and American Samoa. Seattle cloud computing, Bay Area venture capital, Los Angeles/Long Beach cargo queues, Utah and Idaho migration and inland agriculture, forestry and mining do not share one cycle. A single macro average cannot represent that internal tension.
It covers nine states—Alaska, Arizona, California, Hawaii, Idaho, Nevada, Oregon, Utah and Washington—plus American Samoa, Guam and the Northern Mariana Islands. Its four branches are Los Angeles, Portland, Salt Lake City and Seattle; Seattle covers Alaska, while San Francisco headquarters directly serves Hawaii and the territories.
1. The western economy has never followed one cycle
Technology, housing, ports and tourism respond differently to rates
Coastal metros and inland mountain states have very different policy sensitivities.
The Bay Area and Seattle concentrate technology, cloud giants and venture capital. These long-duration assets are highly sensitive to discount rates, so tightening often first appears in equity valuations and frozen fundraising. Los Angeles and Long Beach combine major North American shipping with entertainment and manufacturing. Arizona, Nevada, Idaho and Utah have received skilled coastal migrants and manufacturing, fueling housing and commercial expansion. Oregon and Washington semiconductors, agriculture and forestry, and Alaska/Hawaii's detached economies depend heavily on energy transport, aviation fuel, freight and cross-border visitors.
One hike yields opposing experiences. Technology valuations and hiring shrink and property refinancing strains rise. Yet mortgage shocks combine with land-approval constraints to produce rate lock-in: existing owners avoid selling, sharply cutting resale listings, leaving house prices and rents sticky amid imbalance. A strong dollar constrains coastal exports while raising goods-input costs in offshore U.S. territories.
The four branches and district contact network break the assumption that California represents the West. Reducing the district to technology misses farming, resources, logistics and growing inland states.
How Asia and the Pacific quickly become domestic macro variables
San Francisco is the Fed's forward post facing global trade and finance.
Western ports and businesses are deeply embedded in East Asian chip foundries, electronics manufacturing and supply chains. Freight changes, tariffs, yen and renminbi movements and trading-partner demand reach West Coast orders, inventories and import quotes within weeks. For Hawaii and Guam, stable Pacific routes directly affect household necessities and tourism livelihoods.
The Center for Pacific Basin Studies focuses on open-economy models, cross-border capital and central-bank cooperation. It does not conduct diplomacy or trade negotiations; it helps Washington trace how western-Pacific shocks affect U.S. employment and inflation goals.
2. Confirm AI productivity step by step through evidence

Capex comes first; productivity often comes much later
At generative AI's origin, the Twelfth District was among the first to confront computing demand, data-center construction, power loads and competition for top engineers.
A long, difficult chain separates investment from macro output. Heavy capex immediately raises demand for servers, specialized power infrastructure and highly paid staff, lifting local factor costs. Business-process redesign, broad skill adaptation and commercialization that raise total factor productivity (TFP) often require years or decades to appear clearly in statistics.
Measurement is also difficult. The Solow paradox remains relevant: free digital models, individual efficiency and accumulated intangibles are hard to value in national accounts. Time saved at a few star firms does not establish a qualitative economy-wide labor-productivity leap.
Policymakers face two risks. Prematurely believing supply has permanently shifted right and raising potential-growth estimates may overlook investment overheating and bubbles. Dismissing the revolution as hype may mistake productivity-led noninflationary growth for overheating and cause unnecessary tightening.
San Francisco's approach follows the evidence chain: infrastructure investment and actual adoption; then nontechnology unit labor costs and marginal output; finally broad diffusion into manufacturing and everyday services. Persistent cross-sector real-output gains are needed before revising long-run potential growth.
When Mary Daly discusses regions, she is checking the model's foundations
Mary C. Daly has led San Francisco since 2018. A labor economist, she participates in all policy debates and submits SEP forecasts even in nonvoting years.
In public discussions during 2026, Daly repeatedly considered AI, productivity assessment and regional heterogeneity together. Microeconomic pulses from twelve districts must ultimately feed the same national dual mandate.
Understanding her position requires tracing the changing balance among job resilience, inflation risks and potential supply. Academic optimism about technology does not mechanically imply near-term easing, nor does cooling in one labor sector automatically imply a rate cut. The useful focus is conditional reasoning under macro constraints, rather than hawk/dove personality labels.
3. Twelve regional banks form one national map
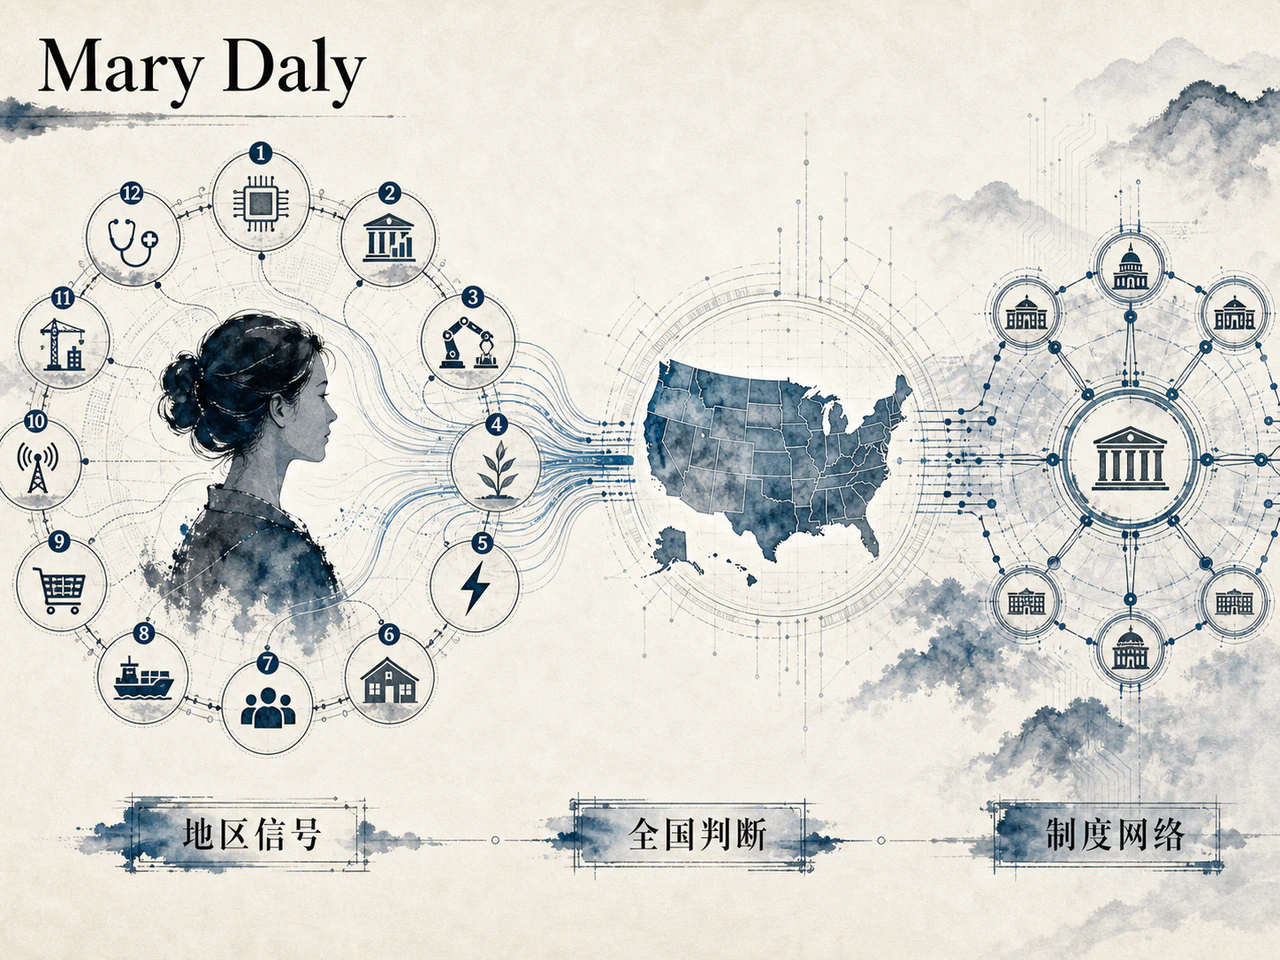
Different information, one set of rates
The twelve districts now provide distinct and irreplaceable cross-sections:
- Boston shows knowledge industries, innovation and housing-supply limits in established cities;
- New York houses the open-market desk and examines offshore dollars and Wall Street trading;
- Philadelphia maintains half a century of the Survey of Professional Forecasters (SPF), tracking expectations with real-time data;
- Cleveland studies price mechanisms through trimmed-mean and median CPI measures of inflation persistence;
- Richmond compares federal-budget rhythms with changes in New South manufacturing;
- Atlanta uses GDPNow and a monthly wage tracker to quantify migration benefits and current growth;
- Chicago monitors industrial Rust Belt centers and measures financial tightness with the National Financial Conditions Index (NFCI);
- St. Louis retains a monetary and rules-based research tradition and supplies the global public macro-data resource FRED;
- Minneapolis studies financial backstops, last-resort lending limits and Indigenous credit fairness across sparse Great Plains farming regions;
- Kansas City connects wheat fields, oil wells and Jackson Hole, focusing on commodities, rural finance and durable long-term credit;
- Dallas covers Permian shale and U.S.-Mexico nearshoring, using trimmed-mean PCE to filter core inflation noise;
- San Francisco watches technological transformation and the Pacific trade and financial cycle.
These twelve different regional pieces form a national picture at Washington's meeting table. Fed federalism means gathering heterogeneous information before uniform policy, then tracking its different effects across balance sheets afterward, rather than letting each region set its own benchmark.
Four steps make future Fed analysis easier
Across twenty articles, a four-step decoding method emerges:
- Identify the speaker: Board, FOMC or a regional Reserve Bank, and whether the person has a formal vote that year;
- Identify the function: monetary decisions, market operations and balance-sheet management, bank prudential supervision, payments operations or independent research;
- Assess the evidence: revised national official data, leading but sample-limited regional diffusion indices, endogenous market pricing, or firsthand Beige Book contacts;
- Locate the conditions: the inflation path, employment floor and financial boundaries supporting an official's position, and how it changes if data depart from them.
This takes more effort than chasing a headline or quoting an official, but survives cycles. Chairs change, votes rotate and dramatic indicators are revised; institutional checks, evidence selection and micro transmission endure.
Return to the series' starting point: the Fed's complex, sometimes frictional design reflects America's foundational distrust of concentrated government and financial oligarchy. It would entrust the monetary center wholly to neither Washington bureaucracy nor Wall Street capital.
After twenty articles, the answer is clear: a macrofinancial governance system gathers multidimensional information through decentralized networks, decides collectively through a statutory committee and transmits policy through uniform market operations. Complexity creates disagreement and friction, but its checks form a crucial safeguard against one regional experience, class interest or market narrative monopolizing judgment of the entire economy.