Understanding the Federal Reserve, Part 16/20
On macro researchers' and traders' screens worldwide, FRED—Federal Reserve Economic Data—has almost become the default gateway to U.S. and global indicators. Federal funds, payrolls, PCE and Treasury curves can be retrieved by code. Many may not realize that this public infrastructure, containing hundreds of thousands of series, is maintained by the St. Louis Fed on the Mississippi. FRED does not produce most observations itself. It standardizes scattered government, international and private series in an open, traceable gateway, saving researchers the mechanics of finding and cleaning tables so they can focus on definitions and comparisons.
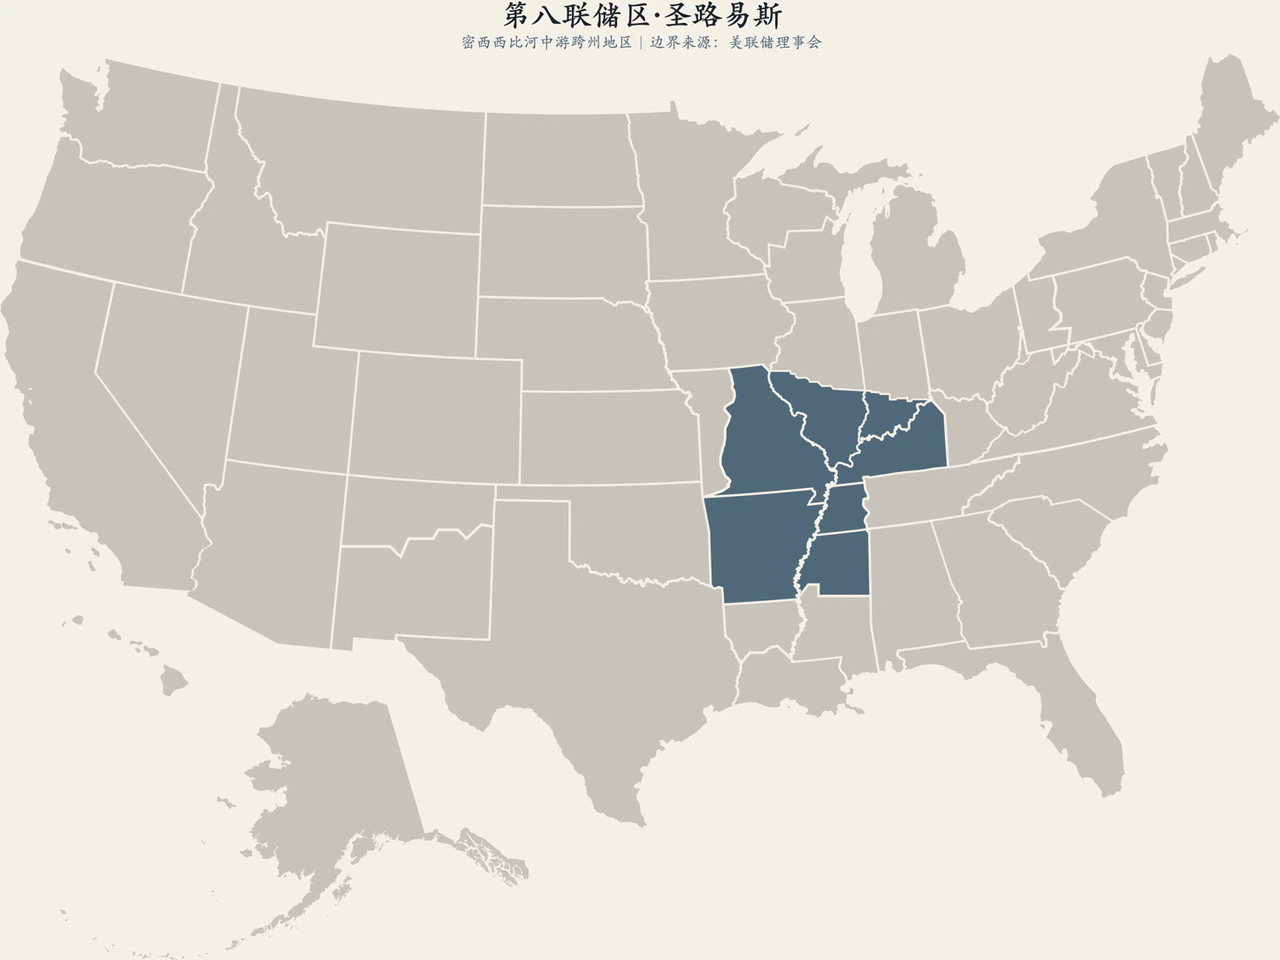
The Eighth District covers all Arkansas and parts of Illinois, Indiana, Kentucky, Mississippi, Missouri and Tennessee, with branches in Little Rock, Louisville and Memphis. Its borders follow Mississippi waterways, railways and trade rather than whole states, connecting Midwestern farmland, river logistics, industrial towns and regional cities.
1. Seven-state boundaries shaped by rivers and business
Why it does not resemble a state map
St. Louis, Memphis, Louisville and Little Rock lie in different states but have long been linked by rivers, rail freight and agricultural storage and trading. In 1914, district organizers prioritized actual clearing routes, goods flows and commercial credit over tidy administrative borders. Incorporating parts of several states required regional research to look beyond isolated state aggregates from the outset.
The area is structurally diverse. Soybean, corn and cotton prices directly affect farmland values, machinery credit and rural bank quality. Mississippi water levels quickly create barge bottlenecks and export-cost changes. Metropolitan St. Louis employment rests on healthcare, life sciences, advanced manufacturing and corporate headquarters. Funding access and costs in the Arkansas Delta or rural Mississippi differ sharply from mature metropolitan firms. District-wide income or employment averages can erase these deep microeconomic divisions.
The three branches provide cash circulation and supervision as well as direct industry contacts. Grassroots information is especially valuable when it reveals how outside shocks pass from farms, barge docks and assembly floors into consumption and local-bank balance sheets.
Monetarism is institutional history, not a permanent personal label
In late-20th-century macro debates, St. Louis was known as a monetarist center. Under economists such as Homer Jones, it emphasized money-supply changes, long-run inflation causes and explicit policy rules, openly questioning Keynesian discretionary fine-tuning. This tradition advanced standardized empirical work and open, testable debate within the system. It was historical institutional learning, however, not a label to attach mechanically to every subsequent policymaker.
Today's framework uses ample reserves, IORB and ON RRP. Financial innovation and changing deposit liabilities have structurally broken the simple statistical relationship between narrow money and inflation. The tradition's most valuable legacy is not a static formula but demanding empirical discipline: every policy claim must identify its indicators, explain transmission and specify falsifiable tests.
2. FRED, ALFRED and FRASER answer different questions
FRED aggregates access; original agencies still produce the data
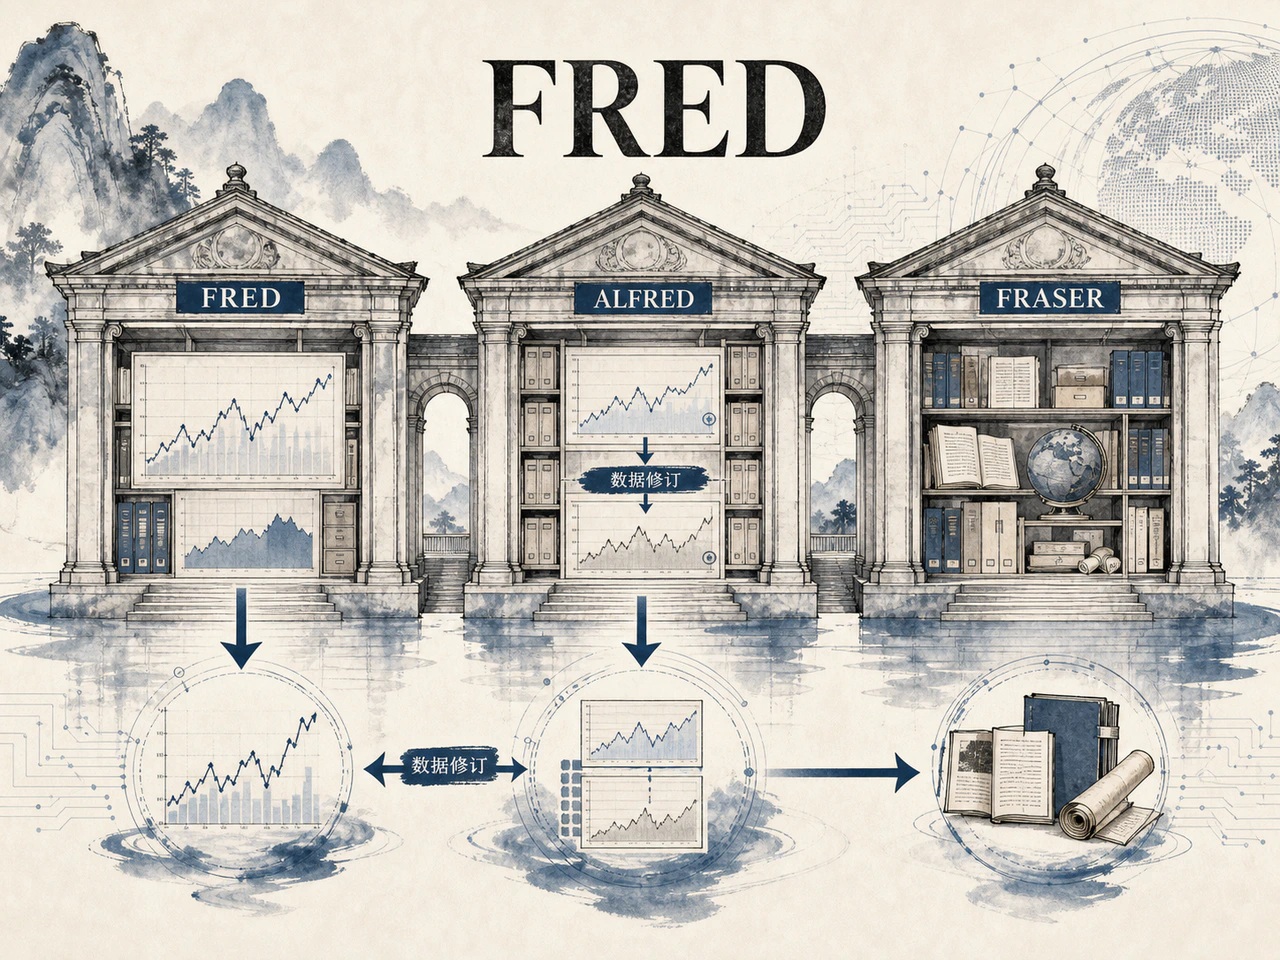
FRED contains hundreds of thousands of series from more than a hundred sources, including the Board, BLS, BEA, Treasury, IMF and OECD. It offers convenient APIs, frequency conversion, transformations such as annualized period-on-period growth and log differences, and online charts. A series' meaning nevertheless comes from its original producer's methodology and survey notes. Knowing only a code risks missing benchmark revisions, seasonal-factor reestimation and major coverage changes.
Its public value is breaking institutional data silos and format barriers through a standardized readable gateway, lowering access costs. But platform presentation can create a false equivalence: two lines sharing a chart and time axis may seem directly comparable or causally connected. Convenient visualization does not establish compatible definitions or economic causation.
ALFRED preserves old vintages; FRASER preserves institutional history
Hard macro data undergo frequent, lengthy revisions. Today's elegant GDP, payroll or saving-rate history may reflect years or decades of benchmark changes, not the initial observations before historical policy meetings. ALFRED—ArchivaL FRED—freezes release-time vintages, reconstructing the actual real-time information set facing policymakers and markets. This is foundational for avoiding hindsight bias in policy evaluation, forecast assessment and quantitative-strategy tests.
FRASER archives U.S. economic and financial history: policy reports, unabridged hearings, early FOMC minutes, discontinued statistical publications and economists' papers. It explains institutions' emergence and the contemporary context of statements, rather than tracking current markets. GeoFRED, a formerly common regional mapping tool, has changed in service form and technical support; serious research and citation must use the latest official maintenance status rather than outdated tutorials.
3. What is scarce is data discipline, not charts

How Alberto Musalem connects productivity and price stability
Alberto G. Musalem became St. Louis Fed president in April 2024. An alternate in the 2026 FOMC rotation, he does not formally vote but participates fully in policy debate and SEP forecasts. With buy-side and New York Fed open-market experience, he emphasizes total-factor productivity's dynamic relationship with price stability. Potential gains create room for long-term noninflationary expansion, but do not justify overlooking immediate inflation or easing prematurely.
This captures the supply-demand timing gap. Productivity's reduction in unit costs is a slow medium- to long-term supply effect; technology and equipment upgrades first stimulate strong capital spending, immediately raising demand for advanced equipment, power and skilled workers. Before potential supply is released, investment can lift aggregate demand and factor prices, complicating near-term inflation. Understanding officials means unpacking transmission logic, not assigning a doctrinaire camp whenever St. Louis is mentioned.
Three minimum standards for using data platforms
With abundant accessible tools, cautious data discipline is scarcer than charting skill. Platform users need at least three standards:
First, look beyond codes and verify the producer, units, seasonal adjustment and actual survey period;
Second, use real-time vintages for historical decisions and forecasts, rather than replacing available information with years-later revisions;
Third, charts show apparent correlation; causal inference requires sound identification of external shocks or tests of transmission mechanisms.
A common error uses heavily revised final GDP to accuse earlier policymakers of missing recession risk. If their initial data were strong, rigorous evaluation must account for that constraint. Another overlays two rising FRED lines and infers causation, ignoring a shared credit cycle or demographic driver.
St. Louis is distinctive in making transparency and methodological traceability a global public infrastructure. FRED eases retrieval, ALFRED reconstructs revisions, and FRASER returns institutional reflection to its historical context. Together they form a macro empirical toolkit accountable to markets and decisions.
The same discipline matters in research and writing. Every chart should state the original agency, definition and period. Claims of record highs require checks for methodological changes and breaks. Policy evaluation should approximate the information visible then. When data access and chart creation are unprecedentedly cheap, respect for definitions and factual detail is what makes macro insight credible.