The US Treasury formally launched its Economic Exile action against Iran. On paper it appeared a heavy blow to supply, but markets treated it as bullish news already exhausted: on Monday, August 24, both crude benchmarks' official settlements fell around 2.35%. Beneath the retreat, the most substantive new information came not from Washington's documents but from the Red Sea. An attack on the much-relied-on Saudi alternative export route challenged the assumption that pipelines to the Red Sea could offset a blocked Hormuz. It reminded both sides of the market that the physical foundations of the geopolitical premium remained intact.
Prices and curve: Both benchmarks decline, but the curve still signals nearby scarcity
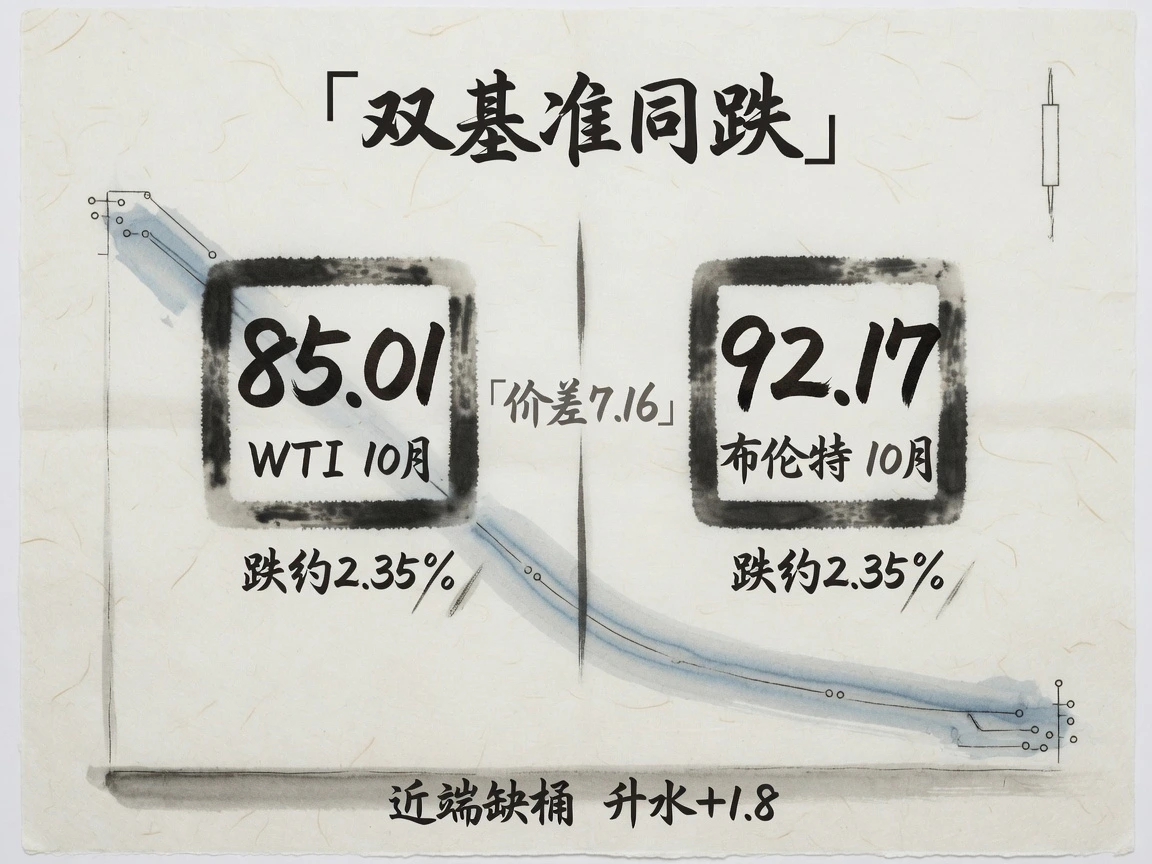
Official August 24 settlements put the main October WTI contract at $85.01/barrel and October Brent at $92.17, both about 2.35% below August 21 settlements of $87.06 and $94.39. Reuters, Bloomberg and other terminals agreed on this basis. September contracts had already completed delivery and both main contracts were October, so the comparison represented a pure daily settlement change.
The Brent–WTI spread remained wide at $7.16/barrel, typical of severe shipping disruption. Hormuz directly restricted offshore seaborne barrels, while transmission to WTI's inland North American delivery base was longer and less direct. At 08:05 Beijing time on August 25, electronic WTI rebounded to $85.19 and Brent to $92.29, slightly above settlement. These were liquidity snapshots, excluded from official daily returns.
Despite the daily retreat, the curve retained deep backwardation. October-over-November spreads in both WTI and Brent held near +$1.8 per month. December Brent traded around $88, with deferred prices only gradually moving below $80 approaching mid-2027. This steep downward curve recognized real immediate scarcity. Lower deferred prices discounted eventual restoration of Hormuz flows, but that recovery kept being postponed.
Conflicting inventory signals; shut-in supply remains the larger issue
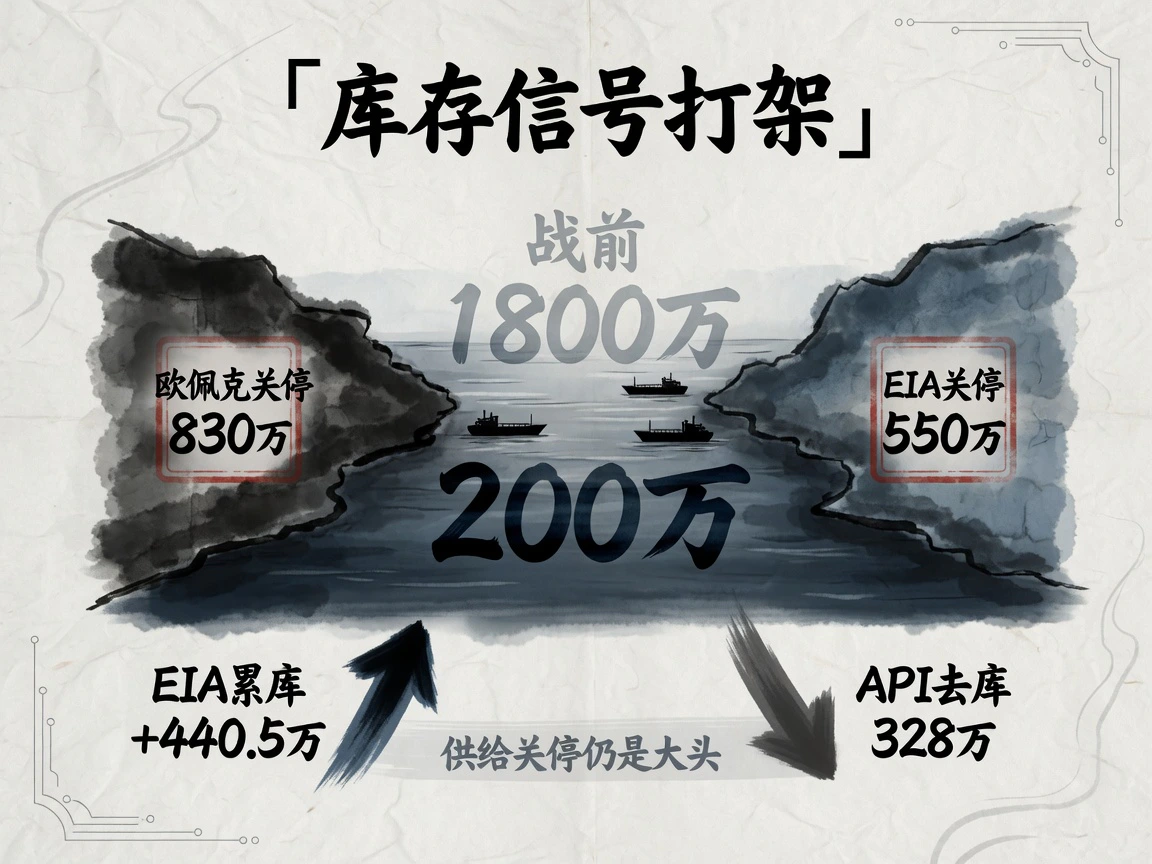
The main determinant of physical supply remained the enormous involuntary production shutdown in the Persian Gulf. Different models require presenting estimates side by side: OPEC's August 12 monthly report put crude production shut by war and logistics at around 8.3 million barrels/day. The EIA's August Short-Term Energy Outlook was more conservative at around 5.5 million in July, assuming most returned before early 2027.
Actual export recovery lagged financial-market expectations. Combined AIS vessel tracking suggested crude transits through Hormuz barely around 2 million barrels/day, nearly 90% below the prewar norm near 18 million. On demand, OPEC's August report, citing extreme spot prices and disrupted global supply chains, cut its 2026 demand-growth forecast to a year-on-year decline of 1.6 million barrels/day.
US high-frequency stocks sent conflicting signals. EIA data for the week ended August 14 showed commercial crude building an above-expected 4.405 million barrels to 428.8 million, a third consecutive build. Cushing stocks instead fell 1.314 million and distillates 1.53 million, revealing aggregate accumulation alongside tight delivery-hub and middle-distillate conditions. API estimated a 3.28 million-barrel draw for the same week, the opposite direction. Noisy weekly data could distract short-term trading and could not alone establish the overall balance.
Macro did not drive oil that day

Oil's pronounced August 24 weakness could not be blamed on macro liquidity or cross-asset transmission. The 10-year Treasury yield fell 4.0 basis points to 4.70%, the 2-year was broadly unchanged at 4.24%, and the dollar index was quiet near 98.8, with a 98.97 cutoff snapshot. Neither yields nor the dollar imposed an external tightening shock on commodities.
Selling originated within crude itself. After both benchmarks surged over 5% the previous week, excessive speculative momentum and leveraged longs had accumulated. Treasury's formal announcement triggered classic buy-the-rumor, sell-the-fact profit-taking and crowded-position liquidation.
Gold offered stronger corroboration: London spot remained firm near record levels, around $4,735/ounce in the cutoff snapshot, showing no simultaneous global exit from havens. The money leaving was overheated capital trading short-term policy events in crude futures; asset managers had not reduced their assessment of broader Middle Eastern risk.
Sanctions priced in, Red Sea attack new: The incremental threat is the bypass route

The main political event was Treasury Secretary Bessent's August 24 Economic Exile action: new sanctions determinations against five pillars of Iran's economy—digital assets, high technology, gold, aviation and shipping. OFAC blacklisted nearly 60 entities, people and registered vessels, targeting shadow-fleet brokers and intermediary trading networks, and warned international shipowners complying with Iranian strait-fee rules.
The action had already been extensively signaled through a public opinion article, making lower oil unsurprising. Its marginal impact was limited: it targeted Iran's remaining concealed smuggling channels, while compliant exports were already nearly absent. It therefore struggled to remove additional effective supply from the already tight compliant global crude market.
The new threat came from that day's Red Sea attack. Yemen's Houthis claimed a ballistic-missile strike on the Saudi VLCC Amzan, approximately 320,000 deadweight tonnes, around 63 nautical miles west of Yanbu. A deck fire and safe crew evacuation were confirmed, and both the Saudi owner and UKMTO subsequently confirmed the incident. Yanbu is the essential outlet for Saudi crude moved west through the 1,200-km Petroline to bypass Hormuz. The strike hit a core alternative logistics corridor for Gulf producers.
Shipping finance had intensely monetized physical disruption risk. Baltic Exchange week 34 assessments put Middle East–China TD3C VLCC earnings around $585,000/day, corresponding to the extreme WS570 rate. Industry reports from late July put Persian Gulf transit war-risk surcharges at 7.5%–10% of vessel value. Threatened attacks did not mean immediate complete shipping paralysis, but extraordinary freight and insurance represented buyers' and owners' live pricing of interruption probability. These costs showed no easing.
What markets price: From ceasefire hopes to disruption duration

Settlements, calendar spreads and prompt freight together showed no loss of the underlying pricing anchor from one day's decline above 2%. Deep nearby discount structure priced a real shortage of prompt-delivery barrels, while progressively lower forwards priced eventual repair of supply-chain bottlenecks. Brent spot near $92, against a prewar center around $70–72, still embedded a geopolitical premium of around $15–20/barrel. Major Wall Street institutions' scenario-based estimates ranged $10–20.
Leading banks' baselines were also changing qualitatively. Morgan Stanley raised Brent forecasts on August 24 to $90 for Q3 and $100/barrel for Q4, citing much slower Middle Eastern supply recovery and continued commercial inventory depletion. Research baselines were shifting from a brief geopolitical spike followed by rapid production and shipping recovery toward persistent disruption and physical shortages into 2027. Trading had moved from betting on when a ceasefire would arrive to valuing how long supply interruption would last.


