On August 28, 2026, Fed Chair Warsh's first keynote since taking office, at Jackson Hole, made September's decision entirely dependent on subsequent data. Swap and futures odds of a 25-basis-point September hike jumped from about 35% to 55%–58%, exceeding hold odds for the first time since late July. The 2-year Treasury surged 14 basis points to 4.34%, its largest daily rise since March. Real rates drove almost all the nominal increase as the curve sharply bear-flattened. Gold slumped about 2.9%, oil eased, and stocks reversed early gains, barely retaining weekly advances on earlier major-tech earnings. With US markets closed over the weekend, Monday August 31 Asian trading will digest the second round of hawkish repricing.
Treasuries: short yields jump, entirely driven by real rates
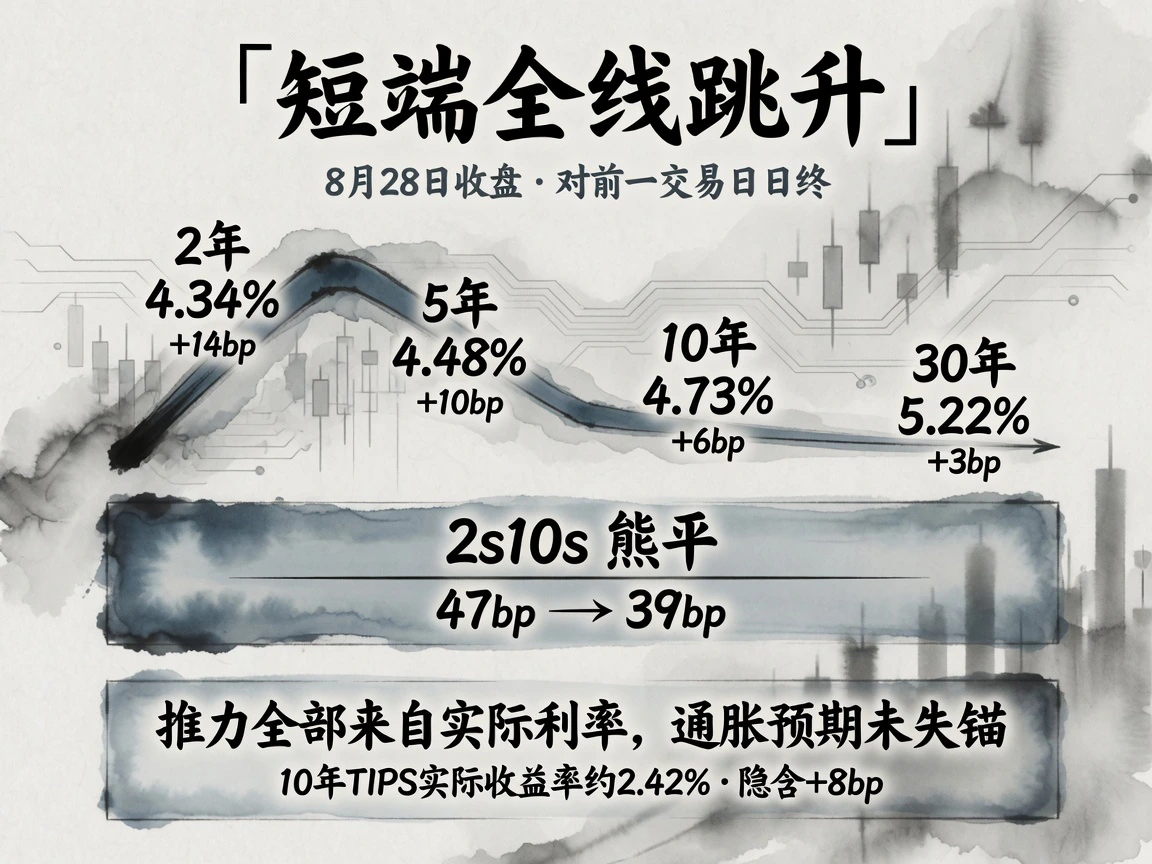
August 28 Treasury changes versus the previous official daily close:
| Maturity | Close | Change |
|---|---|---|
| 2-year | 4.34% | +14.0 bp |
| 5-year | 4.48% | +10.0 bp |
| 10-year | 4.73% | +6.0 bp |
| 30-year | 5.22% | +3.0 bp |
Nominal increases came almost entirely from real rates. Ten-year breakeven fell from 2.33% to 2.31%, 5 y 5 y forward inflation from 2.35% to 2.32%, implying a 10-year TIPS real yield near 2.42%, up approximately 8 basis points. Medium/long expectations stayed anchored, without long-end fear of runaway inflation. 2s10s compressed from 47 to 39 basis points, concentrated in short/intermediate maturities. The 2-year had stayed within 4.17%–4.24% August 24–27 despite PCE, claims and regional hawkish comments; Warsh's signal that otherwise more work remained broke the deadlock. Some media reported an 11–13-basis-point rise to around 4.35%, chiefly reflecting new-issue versus constant-maturity end-of-day definitions.
Policy pricing entered a post-speech, pre-data interval. FedWatch put September 15–16 hike odds at 55%–58%, versus Kalshi 48% and Polymarket 49%, a 7–10-percentage-point gap over hawkishness. Interbank liquidity showed no stress: August 28 published SOFR 3.64%, EFFR 3.63%, ON RRP use below $100 million, with broadly ample liquidity under the 3.50%–3.75% corridor. Short-yield increases reflected hike repricing alone rather than funding pressure.
The long end rose only 3 basis points, restrained by anti-inflation credibility and Treasury support. Treasury had announced doubling long-bond liquidity-buyback caps from $2 billion to over $4 billion per operation September 9–November 4, covering 10–20 and 20–30 years. Yet 30-year yields at 5.22% remained near August 17's 5.31% high. Supply, declining overseas official demand and competing AI/investment-grade issuance still supported term premiums. Auctions showed steady front-end but weaker longer demand: 2-year 4.204%, $69 billion; 5-year 4.393%, $70 billion; 7-year 4.512%, $44 billion, highest since December 2024. August 27 OAS buffers were thin, investment grade 0.79% and high yield 2.63%; an actual hike would expose credit to higher benchmarks and wider spreads.
Hike expectations had reached HKD's front end. August 28 overnight HIBOR was 3.42464%, up about 23 basis points; one-week 3.23%, three-month 3.01%, still roughly 55–60 basis points below the dollar corridor. Under the peg, that discount was expected to converge toward parity mainly at the front around September's meeting. Hong Kong government 10-year yields were 3.597%, Asian dollar IG spreads near 57 basis points and Hong Kong sovereign spreads near 12, all historically low. At August 28 17:05 Eastern, August 29 05:05 Beijing, Treasuries quoted 2-year 4.36%, 10-year 4.73%, 30-year 5.213%, within 0–2 basis points of official closes before the weekend shutdown.
Fed: policy paths give way to data thresholds
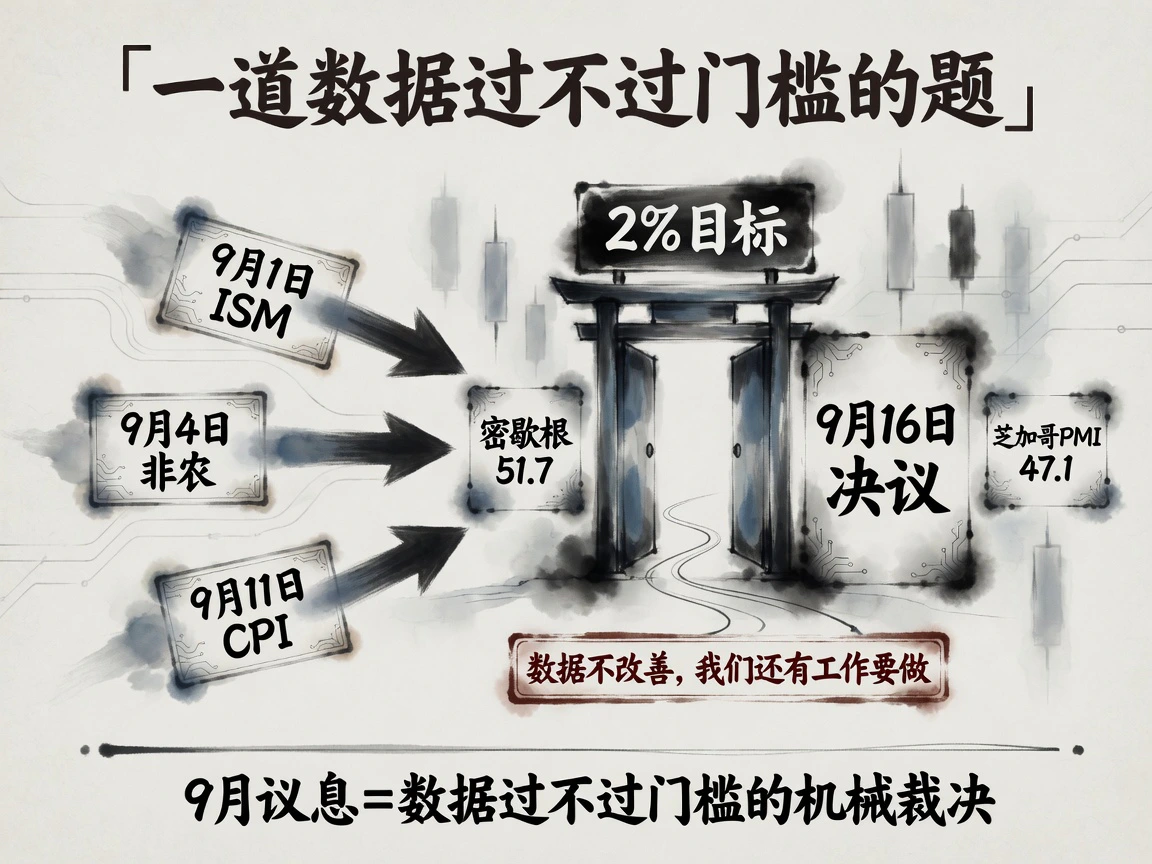
Warsh's day-100 keynote, In Our Time, gave data triggers rather than a rigid hiking path. He said routine forward guidance had outstayed its welcome as a crisis tool, and advocated restraint so markets could assess unfiltered rates, credit, currencies and commodities. He cited core PCE 3.7% over twelve months and 4.1% annualized over six; 54% of basket components rising over 3% over the past twelve months; unemployment 4.1%, consistent with full employment; historically low corporate/leveraged-loan spreads and easy credit standards; equipment/intangible investment up about 9% year on year; S&P 500 profits up over 20% year on year. The message was clear: underlying inflation must demonstrably move toward 2% fast enough, otherwise more work remains. September 16 would depend almost entirely on September 1 ISM manufacturing, September 4 payrolls and September 11 CPI.
Friday data illustrated the difficulty. Final August Michigan sentiment was 51.7 versus preliminary 51.0 and prior 55.2, still falling. One-year inflation expectations declined to 4.0%, while five-year held 3.3% for a third month, indicating anchored medium-term expectations. Chicago PMI nevertheless plunged 10.5 points from 57.6 to 47.1, first contraction since April, while prices paid hit their highest since February 2022. Similar weak-order, strong-price stagflation in national ISM would complicate September's trade-offs.
Warsh fundamentally reshaped expected rates from prolonged waiting plus higher dots toward data-triggered September action. The 7–10-point market gap creates a dividing line: softer ISM/payrolls could unwind short yields and return hike odds near 40%; high prices with contracting activity would bring his no-hold-without-improvement principle directly to bear. Dollar and real-rate tightening first hit metals and may spread to Asian currencies, offshore HKD and risky funding. Fiscal/trade variables approach: US Section 338 of the 1930 Tariff Act imposes 50% tariffs on about $27.6 billion of Canadian goods; retaliation starts September 8 alongside expanded long buybacks. TGA remains high at $950 billion–$959 billion. Its interaction with buybacks and Fed repricing is a central early-September theme.
Commodities: gold drops sharply while oil watches Hormuz
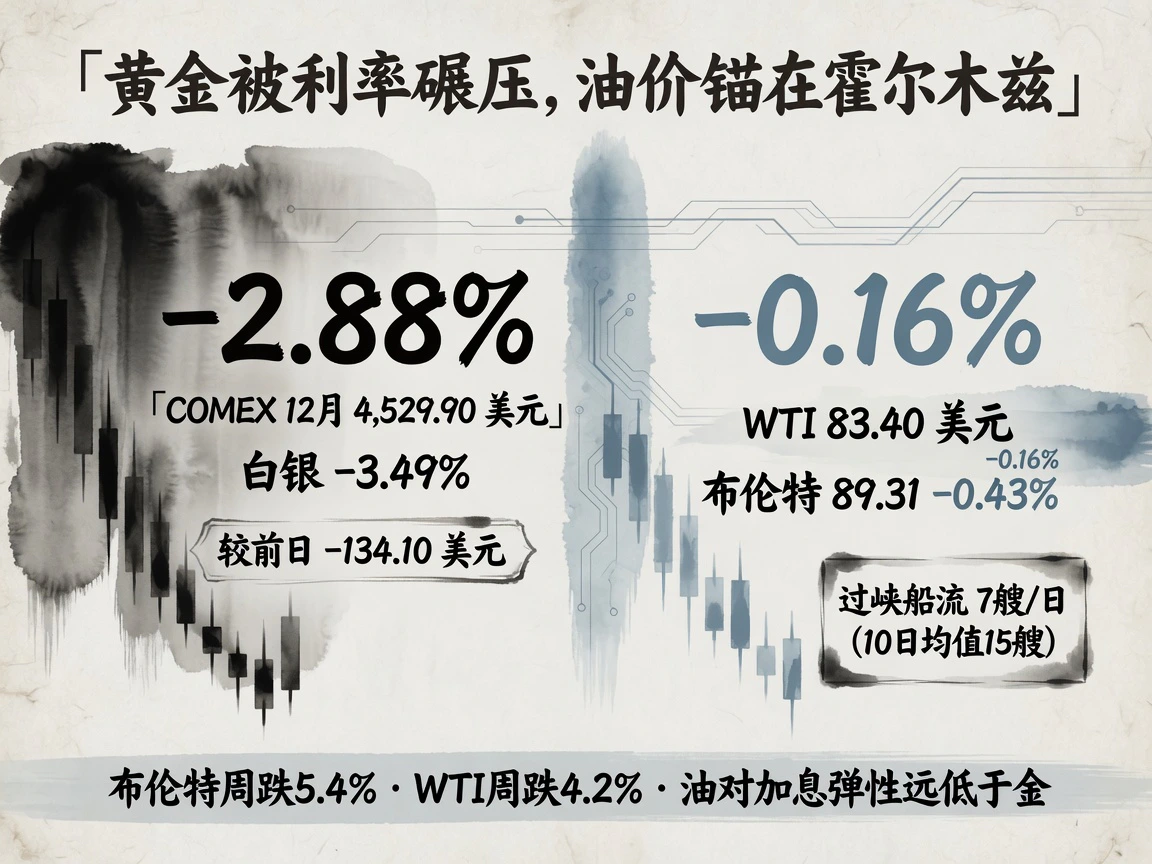
Higher real rates hit gold hardest. December COMEX settled $4,529.90/ounce versus $4,664.00, down $134.10 or 2.88%, the largest decline since late June. Main silver fell 3.49% to $67.786; spot gold ended near $4,455. Before Warsh, spot traded near $4,626, then dropped over $70 within minutes. Hike odds above 50% raised non-yielding assets' opportunity cost, releasing profit-taking and reversing much of August's still-positive gains. Gold returned near its 200-day average. Rate pressure temporarily broke the above-$4,600 contest between fiscal-allocation buying and tightening ceilings. A September hike would test $4,400–$4,450 support; cooler hike bets after data could offer outside investors dip-buying opportunities.
Oil eased only moderately: October WTI $83.40/barrel, -0.16%; Brent $89.31, -0.43%. Oil is less rate-sensitive than gold because current pricing centers on Hormuz reopening. Goldman estimated Gulf exports recovered to 15 million–16 million barrels/day, 5 million–6 million above March lows. Reuters' preliminary tracking counted only 7 Hormuz merchant passages August 27 versus 17 the prior day and a ten-day average of 15. Brent lost 5.4% and WTI 4.2% weekly, first losses in three weeks, mainly on shipping-recovery expectations and rumored weekend arrangements rather than the Fed. Other supply constraints persisted: Ukrainian attacks on Russian refineries/logistics supported tight products; US Iran sanctions hit about 60 entities, ships and people August 24 and added names August 28, with revenue effects still transmitting.
Weekend geopolitics shifted without live pricing. Iran's president said an alternative-route understanding with Oman depended on US implementation of June's memorandum; August 30 he reiterated no transit without Tehran's coordination. Independent monitors put effective passage capacity around 4% of preconflict and war insurance at 40 times normal. Traders viewed route declarations as bargaining rather than actual reopening. Reactions await August 31 European/Asian trading and September 2 EIA inventories.
Equities: mild index losses with sharp internal divergence
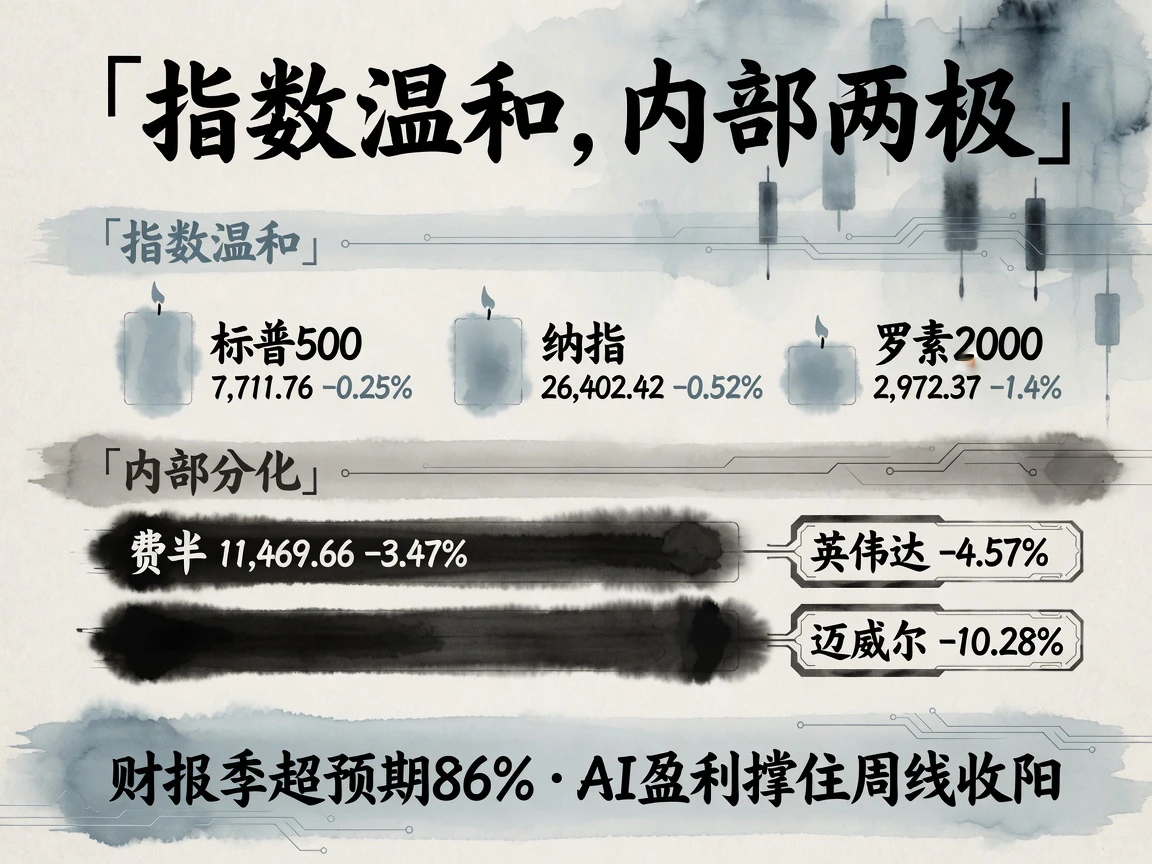
Friday S&P 500 closed 7,711.76, -0.25% but +0.5% weekly; Dow 53,559.99, -0.02%; Nasdaq Composite 26,402.42, -0.52% but +0.8% weekly; Russell 2000 2,972.37, -1.4%; VIX 14.43; Philadelphia Semiconductor Index 11,469.66, -3.47%. Slightly higher opens reversed after Warsh. Rate-sensitive small caps and semiconductors fell more, chips underperforming Nasdaq by nearly 3 percentage points. Earlier major-tech results preserved weekly gains. FactSet counted 96% of S&P Q2 reports complete, 86% beating forecasts with average upside about 27%; solid earnings were the main resilience pillar.
Profit-taking and near-term surprises, rather than fundamental reversal, drove stocks. Nvidia fell 4.57% after the prior day's 8.74% postearnings gain; August 26 after-hours revenue was $96.22 billion, up 106% year on year. Marvell fell 10.28% despite beating results/guidance, as custom-chip revenue shifted to the next fiscal year and raised dilution concerns for near-term margins; the stock was still up about 150% this year. Salesforce gained 1.57% after Thursday's 22.58%, with Agentforce-related ARR up over 210% year on year. CrowdStrike fell 4.19%; PayPal lost 12%–16% after a potential buyer abandoned a deal.
The week's defining combination was strong growth and hawkish central banking, with earnings absorbing rate repricing. VIX above 14 and no credit widening suggest markets viewed Warsh as a tightening-tail scenario rather than rising recession risk. Yet sustained high 2-year yields would embed discount pressure in smaller companies and long-duration growth. Less forward guidance also passively shrinks the policy-backed Fed put. The key is whether implied volatility's baseline rises between September 4 payrolls and September 16's decision, not a single daily index move.
Asia closed before Warsh and reflected only pre-event expectations. Nikkei 225 66,405.56, +0.41%, supported by a weak yen around USD/JPY 159.3; KOSPI 6,788.88, -1.79%, first loss in four sessions, with KRW 1.76 trillion foreign outflows, Samsung -3.38% and SK Hynix -4.45%; Hang Seng 25,584.79, +0.07% but -1.63% weekly. US index futures reopen August 31 at 06:00 Beijing, repricing before Asia's cash markets. Korea and Hong Kong, sensitive to foreign flows, face simultaneous hawkish-rate and currency tests.
Geopolitics and macro: escalating threats with constrained execution
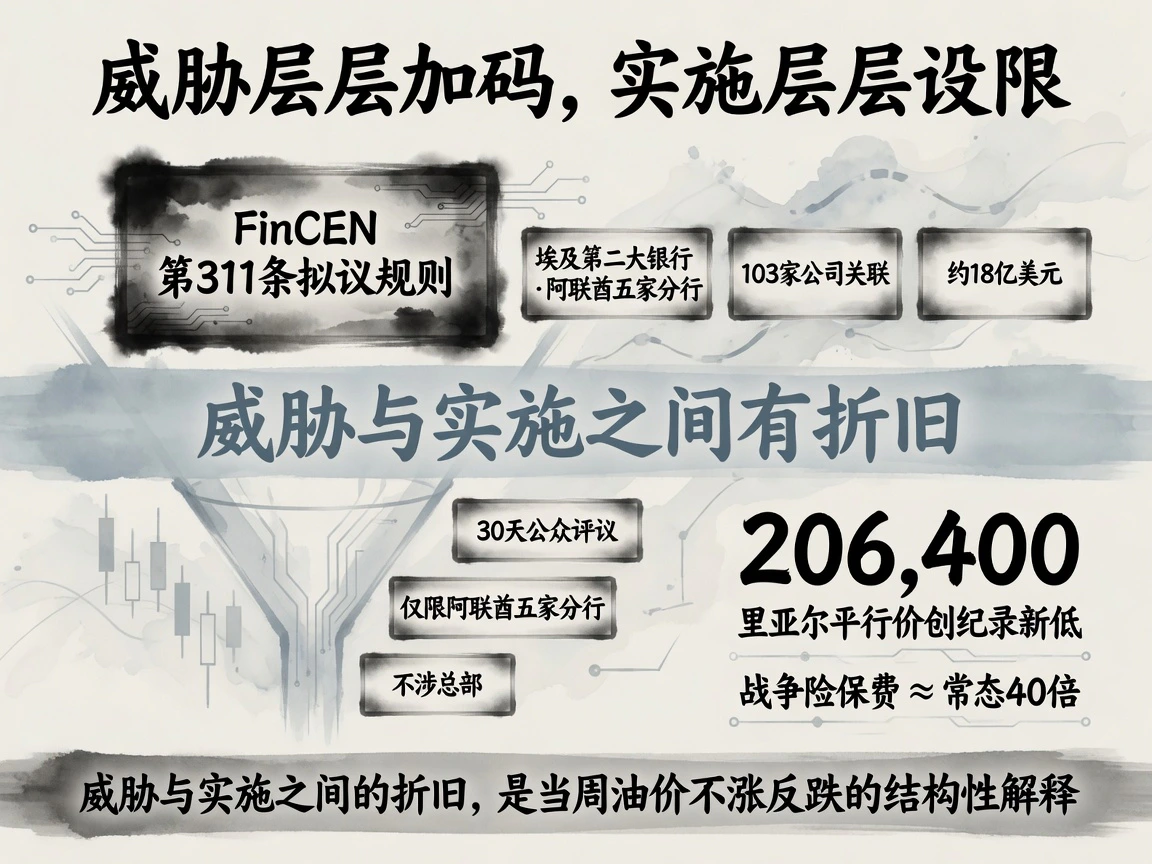
The key sanctions action was targeted pressure on Iranian financial networks. FinCEN proposed under Patriot Act Section 311 designating five UAE branches of Egypt's second-largest bank, Banque Misr, as a primary money-laundering concern, alleging $1.8 billion processed over two and a half years for 103 Iran shadow-banking-linked entities. It remains proposed with 30-day comment, limited to UAE branches and excluding Egypt headquarters, while avoiding direct Chinese-bank friction. Markets saw tighter secondary outflow channels without touching core bilateral finance before September 24 US-China talks. Washington maintained blockade/no-negotiation messaging. Iran's security council confirmed drafting reopening conditions and an initial Omani framework for a transitional route through portions of both countries' waters.
On August 29 the UAE central bank began urgent special compliance reviews of the five branches. Iran's president acknowledged trade down about 25%–35%; the unofficial parallel currency hit another low at 206,400 tomans/dollar. August 30 Pakistani reports of a ten-day ceasefire proposal sent to Washington lacked official confirmation and were treated as noise. Surging prices and depreciation continued eroding Iran's policy endurance.
Geopolitical signals' trading impact is diminishing. US maximal-sanctions/full-blockade rhetoric translated into targeted, bounded proposed rules; Iranian closure rhetoric coexisted with shadow fleets, ship transfers and Omani export corridors. This gap between rhetoric and constrained execution explains oil falling 4%–5% despite escalation expectations and premiums remaining below $90. Actual implementation beyond either side's limits would trigger nonlinear risk repricing. The next sanctions list's scope and official ceasefire statements are the most direct indicators; either could invalidate prior smooth premium compression.


