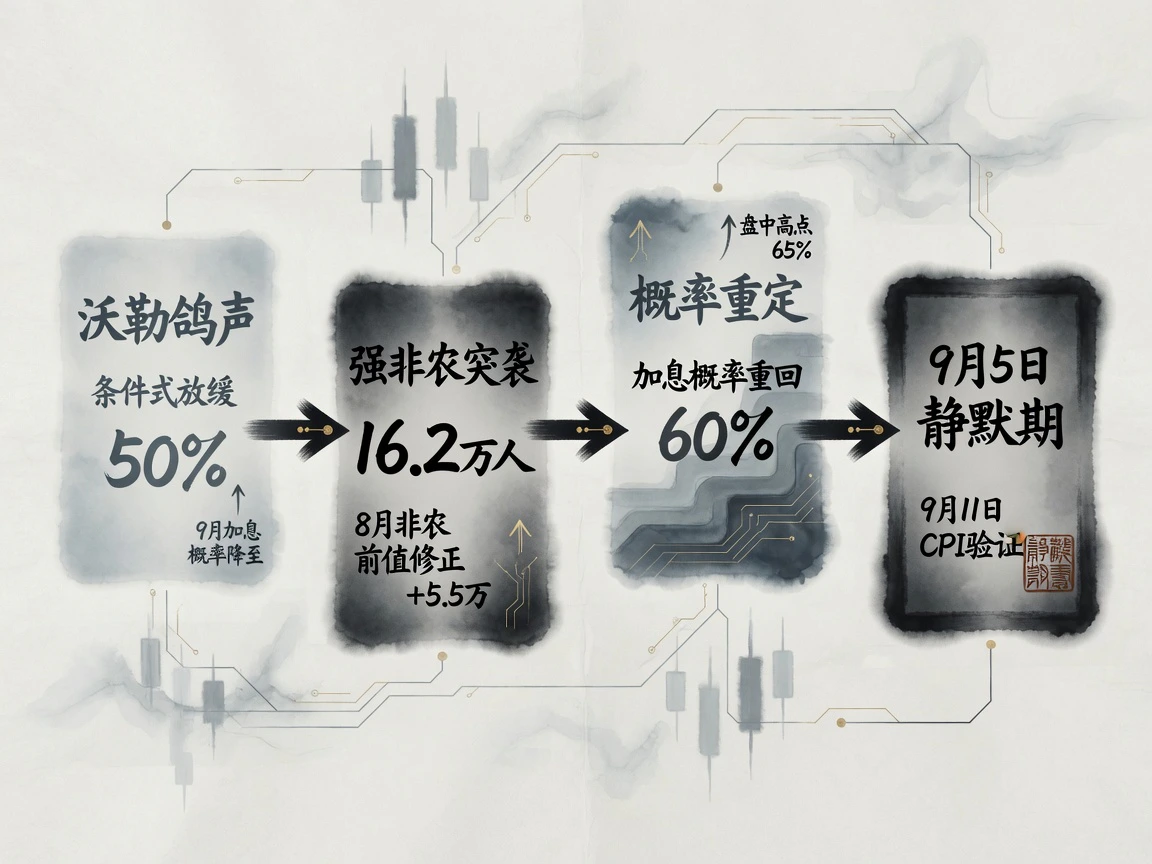
On September 4, 2026, rate expectations completed a sharp two-day reversal. The previous day, Fed Governor Waller's conditional dovish signal brought September hike odds back to 50%, lifting stocks, bonds and gold. Friday evening's August payroll gain of 162,000, almost three times expectations, challenged both rapid labor deterioration and the data premise for postponing a hike.
Hike odds rebounded to around 60%. Treasuries bear-flattened, with the 2-year closing at 4.37%, its highest since January 2025. The three main U.S. indices fell 0.3%–0.5%, masking sharp divergence: AI hardware and semiconductors rose strongly while expensive software and consumer names faced concentrated selling. The Fed entered its blackout September 5, leaving August CPI on September 11 to determine the next pricing surprise.
Policy reset: Strong payrolls meet Waller's dovish signal; tightening odds return near 60%
With just over a week until the September 15–16 FOMC meeting, the contest over rates intensified.
In a September 3 Reuters interview, Waller set explicit conditions: if August inflation kept moving toward 2%, he favored unchanged September rates to allow disinflation more time; only a material rebound would justify a hike. Investors read this as moderation from a central decision-maker. CME FedWatch odds fell from around 63% to even, prompting broad asset gains.
BLS data on September 4 disrupted that pattern. August payrolls rose 162,000, the largest gain since March and far above the 53,000 consensus. June was revised from 20,000 to 31,000 and July from -23,000 to +21,000, a combined upward revision of 55,000. Fears of a summer employment collapse were overturned. Unemployment stayed at 4.1%; participation rose 0.2 percentage point to 61.6%. Average hourly earnings rose 0.3% monthly, with annual growth easing to 3.1%, the lowest since May 2021.
Resilient jobs with moderate wages removed labor weakness as a reason to hold. Implied September 25-basis-point hike odds quickly rebounded from about 50% to 58%–62%, reaching about 65% intraday. The blackout began Saturday September 5; without official commentary, the August CPI release on September 11 became the most decisive premeeting reference.
Fixed income: Front end leads bear flattening; long yields and primary supply test the market
Shifting policy expectations appeared directly in the Treasury curve.
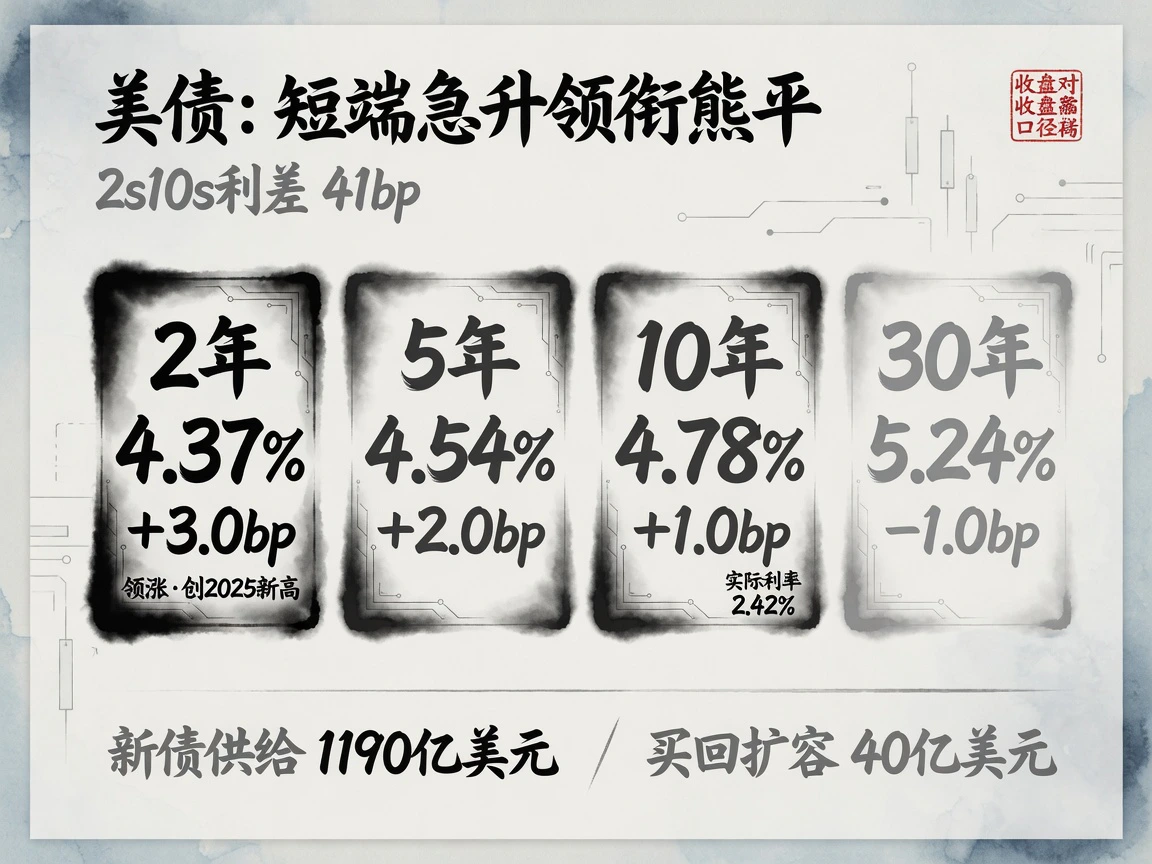
On the Treasury's end-of-day par curve, close-to-close changes were clear:
- 2-year yield 4.37%, up 3.0 basis points, highest close since January 2025;
- 5-year yield 4.54%, up 2.0 basis points;
- 10-year yield 4.78%, up 1.0 basis point;
- 30-year yield 5.24%, down 1.0 basis point.
The front end led the bear flattening while the long end was less responsive. The 2-year/10-year spread narrowed from 43 to 41 basis points. Short rates absorbed renewed hike odds, while growth expectations and liquidity management constrained long rates. Ten-year breakeven inflation stayed near 2.35%; the nominal rise mainly reflected a real-yield increase, with the latest estimate about 2.42%. Pricing centered on resilience and higher equilibrium rates rather than uncontrolled inflation.
Next week's long supply and fiscal offsets were key. Treasury sales September 8–10 would include $58 billion new 3-year notes on September 8, $39 billion reopened 10-years at a 4.625% coupon September 9, and $22 billion reopened 30-years at 5.125% September 10, totaling $119 billion. Expanded long-bond buybacks would take effect September 9, raising the per-operation cap from $2 billion to at least $4 billion, with the first operation September 10. This offered real demand support during peak supply and dampened 30-year volatility.
In Asian dollar credit, investment-grade and high-yield spreads remained historically low. Third-party OAS snapshots were approximately 57 and 327 basis points, with primary issuance still active. If the Fed confirms a hike against high risk-free benchmarks, narrow credit cushions will be tested.
In the early September 5 Beijing-time cutoff snapshot, live 10-year TNX was 4.784% and benchmark 10-year futures ZN 107.5. Intraday U.S. quotes had reached 4.4246% for the 2-year and 4.812% for the 10-year. After-hours moved into the weekend without further trading information.
Commodities: Gold returns to its starting point after a rally; deep prompt oil premiums reflect refining bottlenecks
Commodities diverged between macro rates and physical balances.
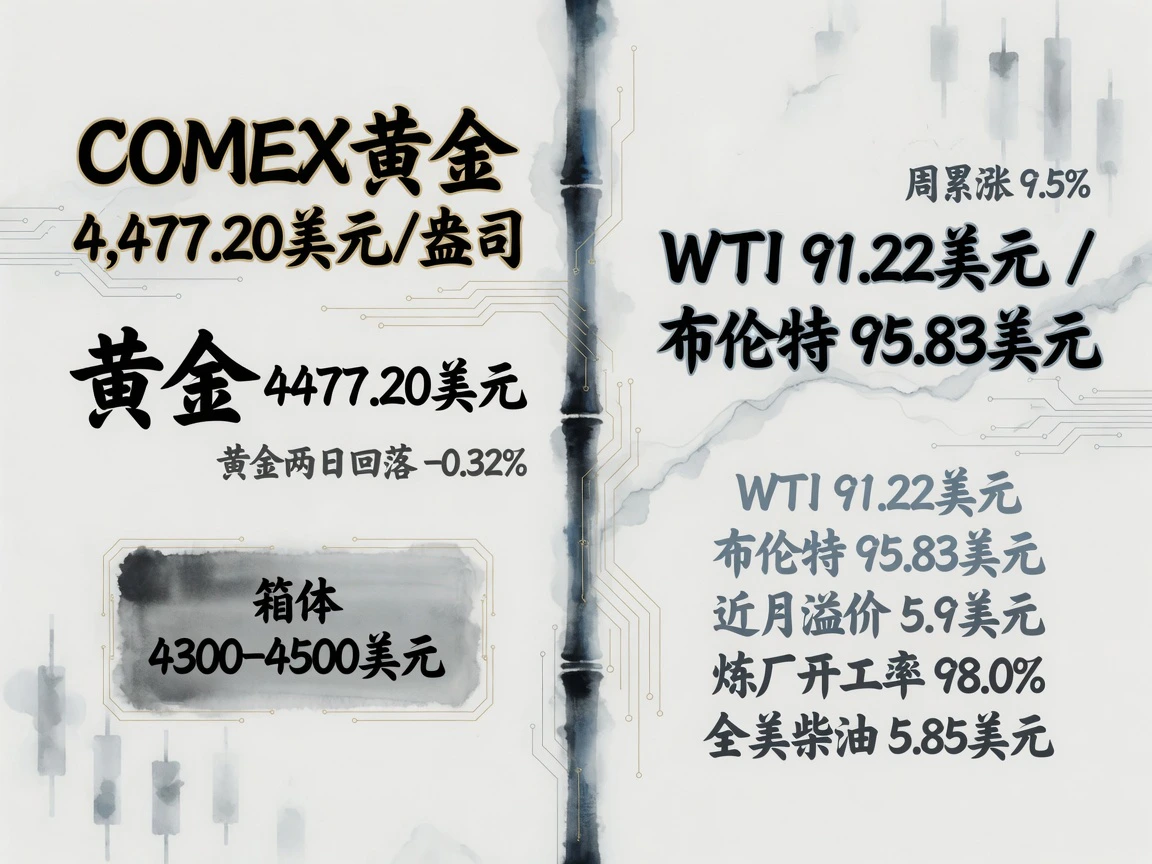
Gold made a rate-driven round trip. Waller's dovish September 3 remarks and a weaker dollar lifted the main COMEX contract 2.87%. Strong September 4 payrolls revived hike expectations and long liquidation; settlement was $4,477.20 an ounce, down 0.32%, with the two-day gains described as fully unwound. Gold returned to a $4,300–$4,500 range, with geopolitics secondary to rates. Elevated September 11 CPI would keep pressure near the $4,450–$4,500 resistance band.
Oil showed firm physical support at high levels. Close to close, nearby WTI slipped 0.09% to $91.22 a barrel and Brent edged up 0.32% to $95.83. Despite small daily moves, geopolitical risks produced the largest weekly gains since mid-July: WTI about 9.5% and Brent about 7.0%.
The curve remained deeply backwardated: prompt WTI exceeded December by $5.9 a barrel and Brent by about $4.0, with flatter deferred curves. This indicated pricing of immediate supply risk over the next 1–3 months rather than a long-term structural shortage. EIA's latest report showed a larger-than-expected 4.5 million-barrel crude draw to 424.5 million, refinery utilization at 98.0%, highest since August 2018, and seasonally tight distillates. September 4 retail diesel averaged a record $5.85 a gallon; ultra-low-sulfur diesel crack spreads reached $108 a barrel intraday. Refining bottlenecks and expensive products directly transmitted inflation. Seven core OPEC+ producers would meet online September 6, with foreign media generally expecting unchanged October policy.
Equities: Strong structural divergence; semiconductor gains offset expensive-asset selling
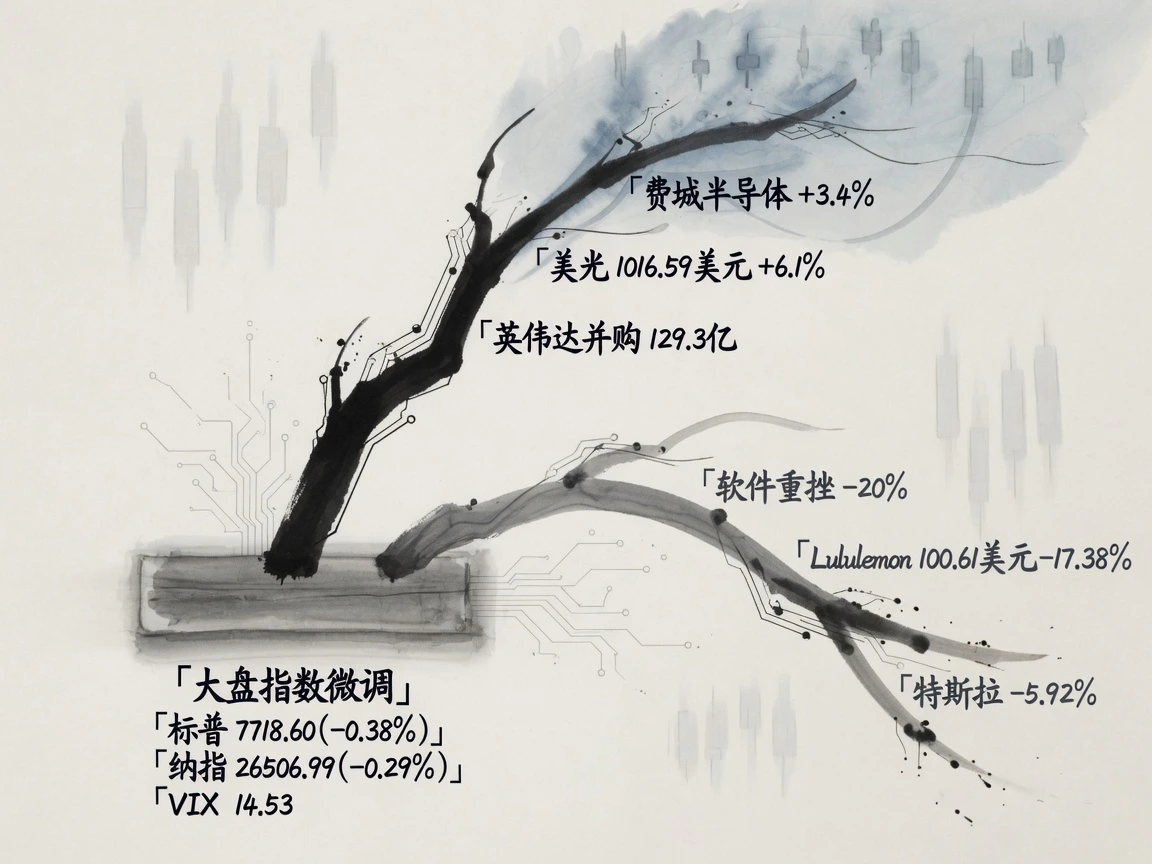
The three main indices fell moderately on payroll day: S&P 500 7,718.60, -0.38%; Dow 53,414.25, -0.51%; Nasdaq Composite 26,506.99, -0.29%. Russell 2000 rose 0.25% to 2,975.65; VIX stayed at 14.53. Mixed weekly returns suggested repricing hike odds rather than panicked recession trading.
Internal divergence was much sharper, mainly reflecting hardware earnings delivery against valuation compression in expensive assets.
Semiconductors and AI hardware rallied independently. Information technology gained 0.78%, Philadelphia semiconductors 3.4%. Memory rose broadly: Micron +6.1% to $1,016.59, back above $1,000 for the first time since mid-August; SanDisk +12%, AMD +4.69%, KLA +7.3%. Specific catalysts included Nvidia's September 3 $12.93 billion acquisition of open-source AI platform Hugging Face, its second-largest deal; OpenAI's launch of flagship GPT-6 Astra; and Dell's record $95 billion AI-server backlog and higher full-year guidance. Tangible hardware profit expectations offset rate-driven valuation pressure.
Expensive software and some consumer shares fell. Guidewire dropped over 20% on weak subscription guidance; UiPath lost 16.7% after third-quarter growth guidance halved; Autodesk fell 8.3%, Adobe 6.7%, and FICO 16.7% as Fannie Mae and Freddie Mac introduced new scoring. Lululemon fell 17.38% to $100.61, an eight-year low, erasing over $2.5 billion value. North American second-quarter comparable sales fell 12%; a second full-year downgrade prompted at least 12 Wall Street target cuts. Tesla fell 5.92% to $354.08, reversing Cybercab launch gains while facing NHTSA self-certification safety audit query AQ26002.
Asia-Pacific mostly rose September 4, digesting Waller's earlier dovish signal. Nikkei 225 +1.26% to 65,020.94, with SoftBank nearly +12%; KOSPI +1.64% to 6,687.21, with Samsung and SK Hynix higher; Hang Seng +1.74% to 25,650.87 and Hang Seng Tech +2.3%, Alibaba +2.4%, Xiaomi +3.6%. Shanghai slipped 0.30% to 3,930.12. Asian closes preceded payrolls. Next Tuesday, September 8, after the U.S. Labor Day closure Monday September 7, Asia would absorb the surprise and higher yields. USD/JPY closed September 4 at 155.66, down 2.05% from the previous close and about 5 yen over two days. Markets strongly expected a 25-basis-point BOJ hike at September 17–18 meetings; same-week Fed and BOJ decisions could reshape differentials and flows.
Macro and geopolitics: Marginal geopolitical premiums fade as growth and inflation regain focus

The past 48 hours showed weaker marginal geopolitical disruption across assets.
Flat oil, gold's reversal and limited equity losses indicated no unexpectedly larger geopolitical premium, with payrolls and rates taking over pricing. Washington played down escalation domestically while retaining deployments abroad and advancing sanctions. OFAC targeted Turkish banks and subsidiaries linked to relevant cross-border channels; near-term Middle East uncertainty was gradually becoming a medium-term background already absorbed by markets.
Despite strong payrolls, macro indicators remained mixed. August ISM services was 55.4, its 26th consecutive expansionary month; new orders were 60.9 and prices 72.6, but employment remained contractionary at 47.8. The previous day's ADP gain was only 38,000. Alongside final second-quarter productivity growth of 1.4% and a record-low 52.8% labor-income share, sticky prices were attributed more to energy-processing bottlenecks, tariffs and AI capital-goods imports than to wages alone.
Atlanta Fed GDPNow forecast third-quarter real growth at 4.7%; Cleveland Fed nowcasts put August headline and core CPI around 3.4% and 2.4% year on year. Resilient growth and plateauing inflation made labor slowing alone insufficient for easing. During blackout, September 11 CPI would directly shape the next move from roughly 60% hike odds.


