From September 7 to September 13, 2026, overseas markets faced rising energy costs and rates. WTI returned above $100 a barrel, the US 2-year yield rose 26 basis points for the week, and all major US equity indexes fell. Friday's oil retreat and stock rebound eased tension without reversing the weekly trend.
The central tension was supply-driven costs alongside slowing demand. Energy gains strengthened hike expectations while confidence weakened and annual core inflation kept falling. Corporate conditions differed: investment-grade spreads were stable and AI infrastructure orders kept growing. Higher financing costs restrained valuations and spending, while resilient orders and earnings in selected industries provided support, sharpening divergence across assets and sectors.
Energy costs spread outward, creating an inflation-consumption dilemma
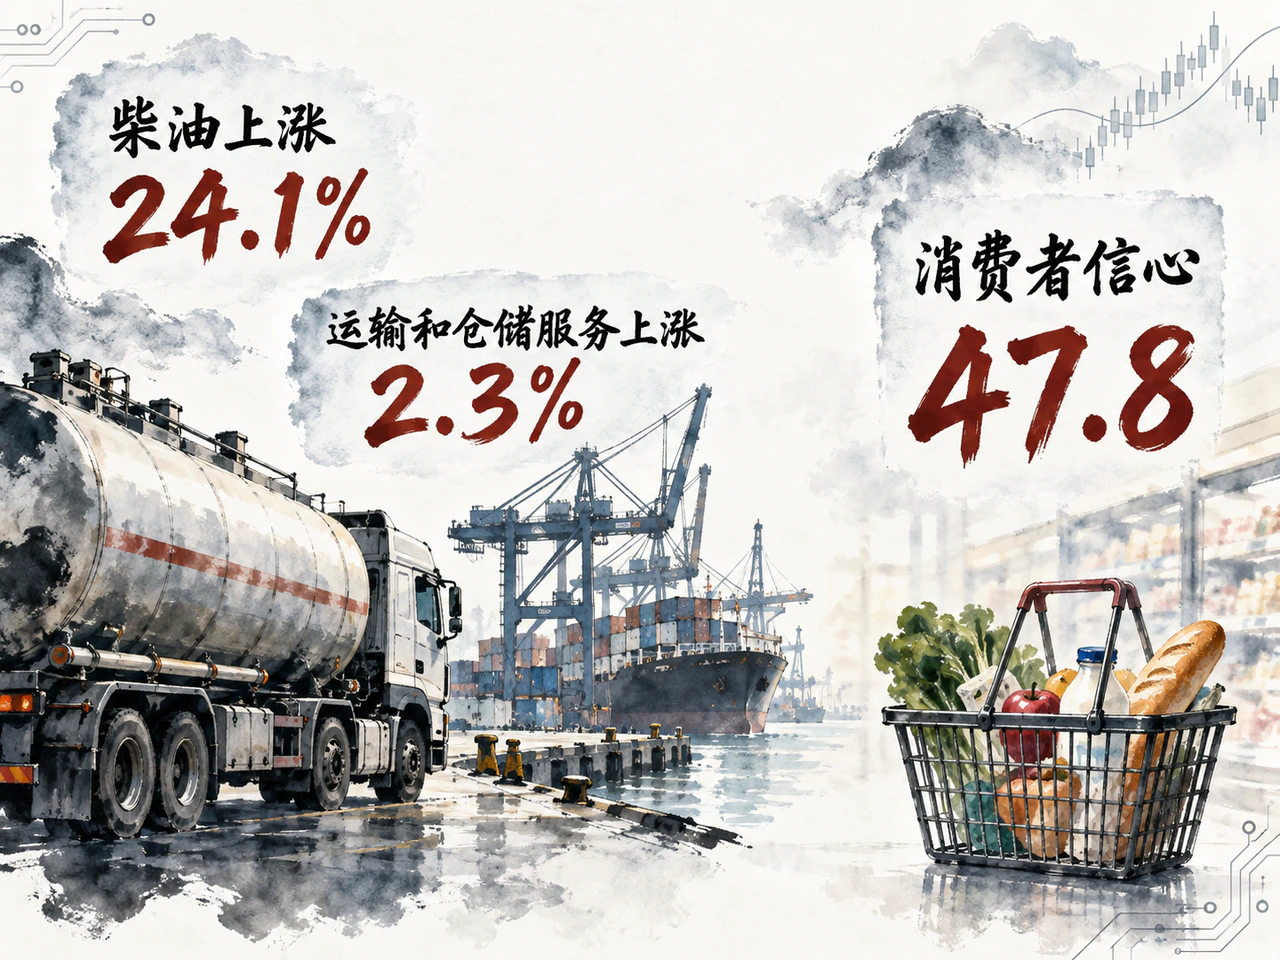
In the four sessions after US Labor Day, Thursday's producer prices materially increased rate pressure. August final-demand PPI, released September 10, rose 0.4% month on month and 5.4% year on year, versus revised July gains of 0.1% and 4.8%. Energy rose 4.2%, diesel 24.1%, and transport/warehousing services 2.3% month on month. Oil inflation was passing through fuel and logistics into business costs.
August CPI released September 11 rose 0.4% monthly versus July's 0.1%, with annual inflation unchanged at 3.4%; both met Reuters' consensus. Gasoline rose 3.9%, contributing more than one-third of monthly headline gains. Core monthly inflation accelerated from 0.2% to 0.3%, but annual core fell from 2.5% to 2.4%; producer services overall rose only 0.1%. Monthly costs strengthened without synchronized acceleration across sectors.
Employment and confidence diverged. Initial claims released September 10 were 206,000 for the week ended September 5, down 1,000, keeping layoffs low. Michigan preliminary September sentiment fell from 51.7 to 47.8, while one-year inflation expectations rose from 4.0% to 4.6%. Jobs supported income, but deepening purchasing-power worries increased pressure on discretionary consumption.
Premeeting pricing therefore tilted further toward a hike. The Federal Home Loan Bank of New York's weekly report recorded about a 74% chance of a 25-basis-point increase Thursday afternoon; Cincinnati Asset Management (CAM) recorded 88% Friday morning. These snapshots capture recent shifts, while subsequent paths remain disputed: Raymond James favored treating a possible hike as a limited adjustment. The September 15–16 Fed meeting and September 16 advance August retail report will further test the balance between prices and consumption resilience.
Short/intermediate Treasuries lead declines as higher benchmarks raise financing costs
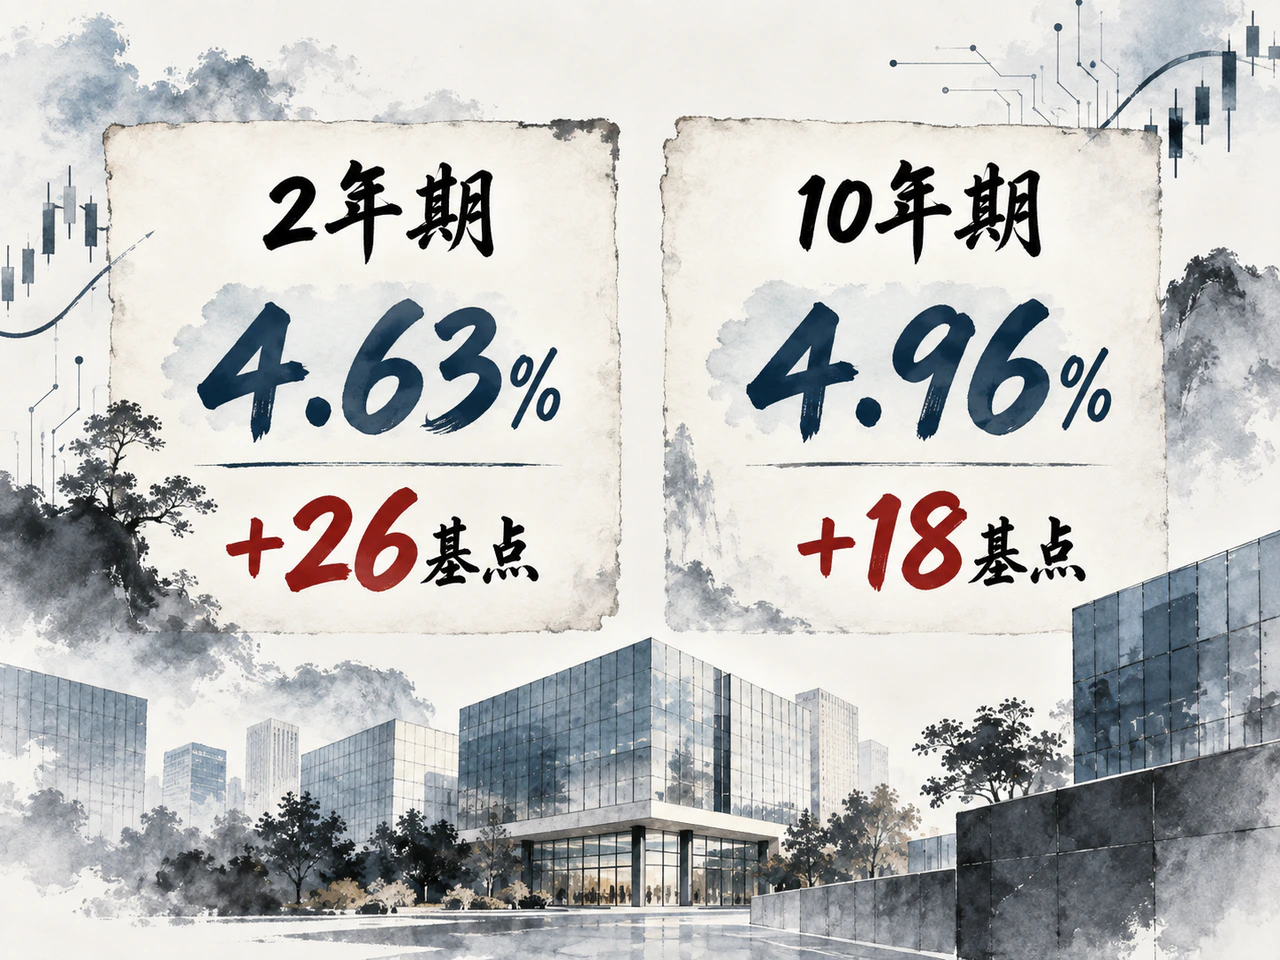
Treasury's consistent daily curve showed yields rising across maturities from September 4 to September 11, led by the short and intermediate sectors.
| Maturity | September 4 | September 11 | Weekly change |
|---|---|---|---|
| 2-year | 4.37% | 4.63% | +26 basis points |
| 5-year | 4.54% | 4.78% | +24 basis points |
| 10-year | 4.78% | 4.96% | +18 basis points |
| 30-year | 5.24% | 5.35% | +11 basis points |
The 2-year/10-year spread narrowed from 41 to 33 basis points as the curve rose and flattened. Thursday's 2-, 5- and 10-year yields rose 13, 14 and 12 basis points; Friday the 2-year added 7 while the 30-year fell 2. Continued pressure on policy-sensitive maturities and partial ultralong stabilization cannot be explained by long-bond supply alone.
Real rates were central. Five-year real yields rose 21 basis points to 2.38% and 10-year real yields 17 to 2.60%. Similar nominal and real 10-year increases indicate higher real discount rates rather than principally wider inflation compensation. Real yields may also reflect resilient growth and investment; this change alone cannot establish deteriorating fiscal credit.
Credit remained relatively stable. CAM's Corporate Index OAS was 78 basis points Thursday, 2 tighter than the previous Friday, while yield to maturity reached 5.71%. Slightly narrower spreads with higher total yields show Treasury benchmarks were the main pressure. US investment-grade borrowers still priced $68 billion that week; short/intermediate investment-grade bond funds received $3.88 billion in the week ended September 9. Funding remained available but became more expensive.
Asian issuance reflected the same distinction. The Edge, citing terms, reported Maybank issuing $700 million in two tranches September 8: 3-year floating at SOFR +60 basis points and 5-year fixed at Treasuries +55, respectively 30 and 25 tighter than initial guidance. Quality issuers can compress spreads through demand, but floating debt reprices with benchmarks and new fixed debt follows the Treasury curve. Existing fixed debt mainly feels the effect gradually at maturity/refinancing.
Supply constraints lift oil while real rates restrain gold
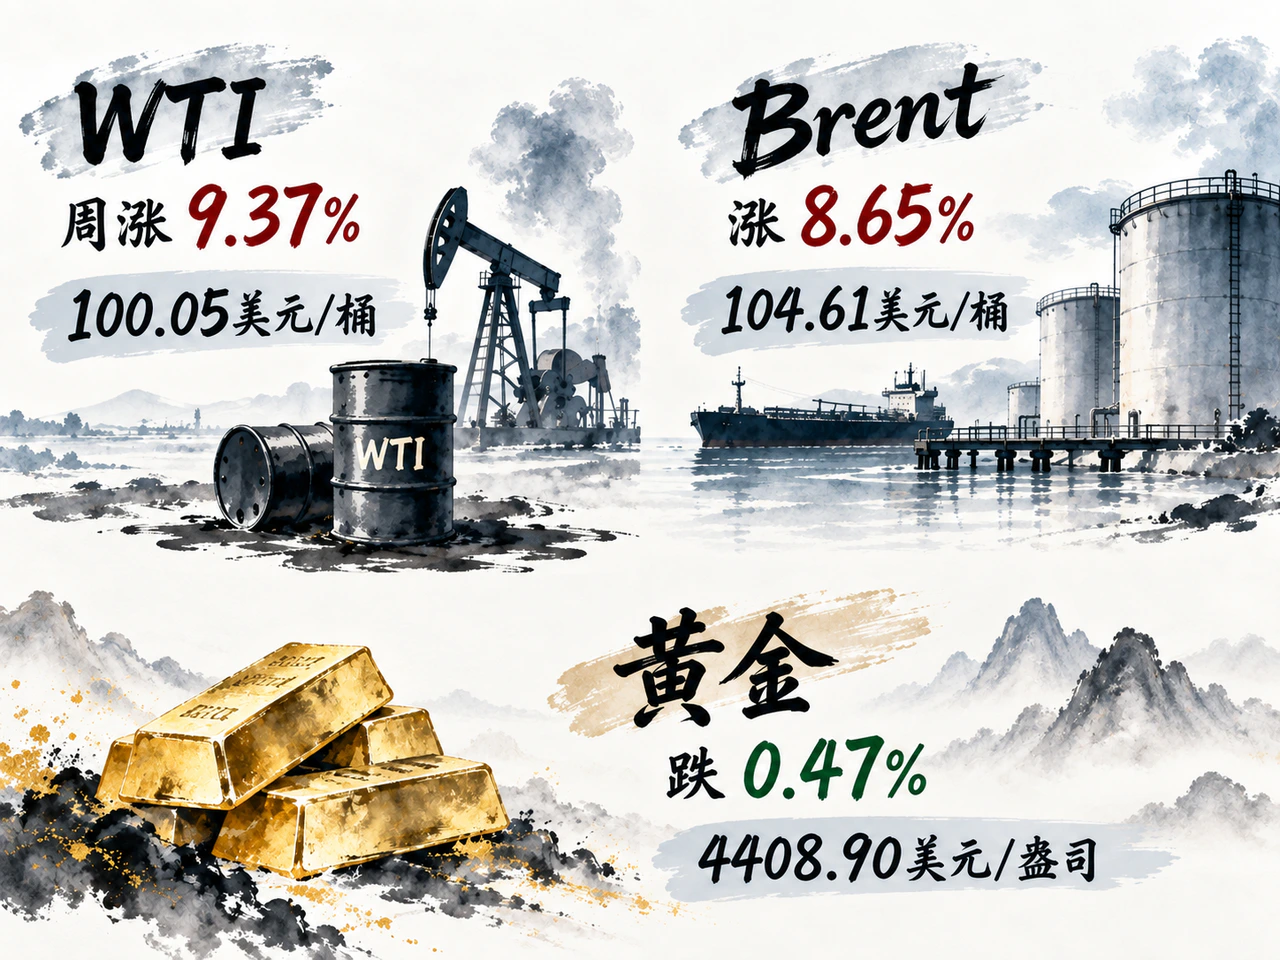
Oil strengthened and gold weakened. On a consistent vendor daily continuous-futures basis, WTI rose 9.37% to $100.05 a barrel, Brent 8.65% to $104.61, while gold fell 0.47% to $4,408.90 an ounce. These continuous quotes differ from exchange settlements for specified months.
Oil gains concentrated midweek: WTI and Brent rose from Tuesday's $93.03/$97.92 to Thursday's $102.48/$107.63. Iranian shipping risks continued affecting Hormuz, extending expected Middle Eastern constraints. Friday reports of temporary shipping-arrangement negotiations unwound some premiums, but actual supply restoration remained pending.
Data also favor a supply-contraction explanation. The IEA's September 11 report estimated August global output down 1.6 million barrels per day and observable stocks down 95 million barrels. Demand forecasts were cut: OPEC lowered this year's growth to 380,000 barrels per day, while the IEA projected an annual decline of 2.5 million. They sharply disagreed on direction but both downgraded. Oil gains reflected supply constraints outweighing slower demand, making them a poor signal of accelerating global growth.
Gold did not share energy's gains. The dollar index fell only 0.04% to 99.12, essentially flat. Higher real rates and tighter policy expectations better explain pressure: non-yielding gold's opportunity cost rose, offsetting some haven and inflation demand. Friday's rebound narrowed the weekly loss, showing alternating influences.
US equities fall for the week; AI orders and capex receive different valuations
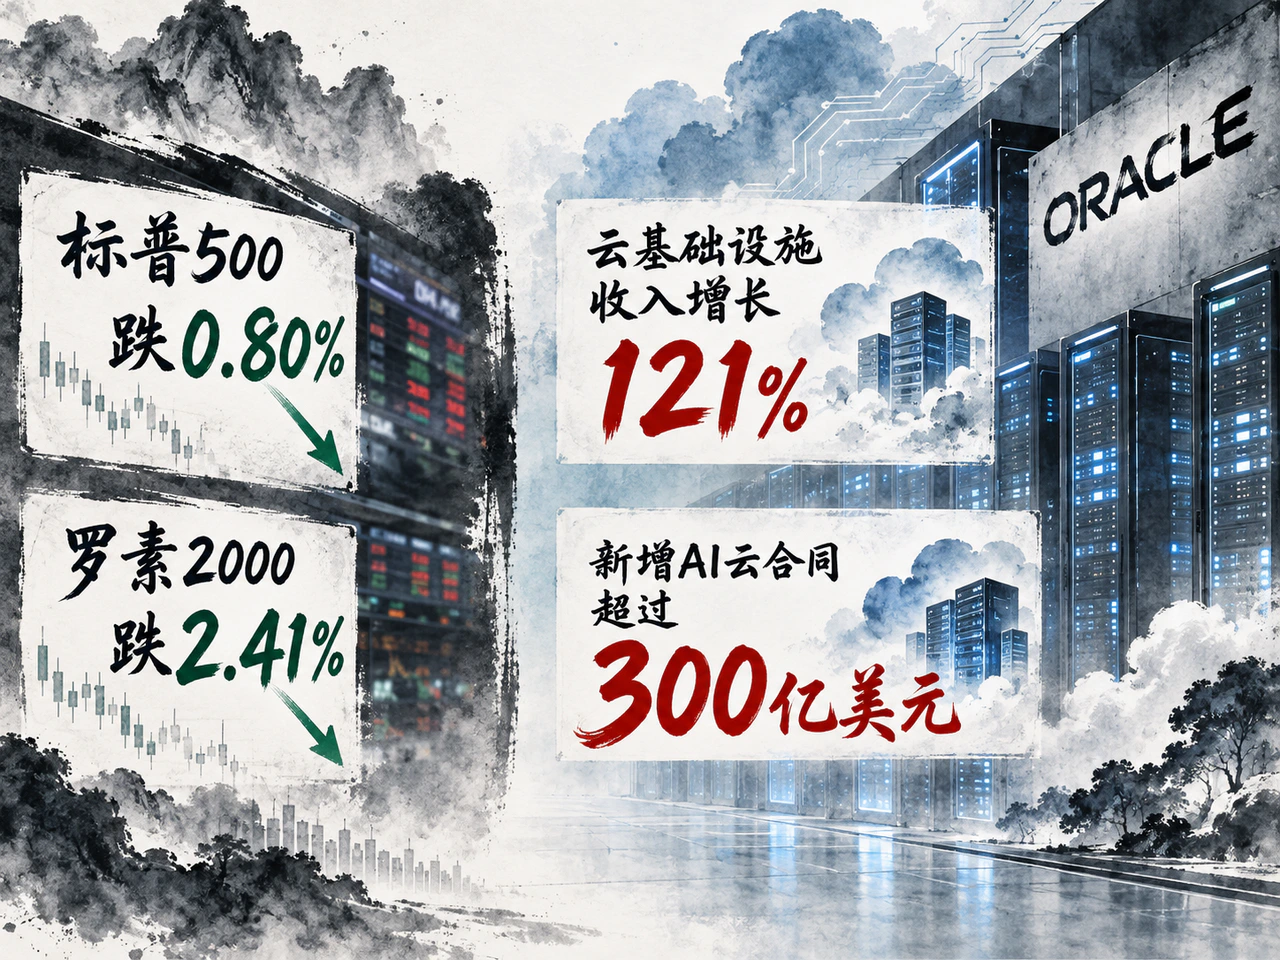
Friday's rebound failed to recover weekly losses. September 11 versus September 4: S&P 500 -0.80% to 7,656.98; Nasdaq 100 -0.59% to 29,368.44; Dow -1.57% to 52,573.29; Russell 2000 -2.41% to 2,903.94. Greater small-cap losses align with higher operating and financing costs, though earnings require company-specific assessment.
Sector differences were sharper. Dollar-priced energy ETF XLE rose 1.69%, technology XLK 0.21%, and financials XLF fell 1.46%; these are ETF price changes, not sector total returns. Energy prices support producers and AI investment supplies hardware orders, partly offsetting rates.
AI itself diverged. Reuters reported Salesforce and Intuit each down around 4% and ServiceNow down 5% September 8 on fears new models would replace specialized software. Intel rose 9% and Qualcomm 3.2%, linked in reports to Amazon custom-AI-chip development deals. One technological shift expands computing demand while potentially eroding some software advantages.
Oracle combined rising orders with funding burdens. Yahoo Finance reported fiscal 2027 Q1 revenue up 30% to about $19.3 billion, cloud infrastructure up 121% to $7.4 billion, and over $30 billion new AI cloud contracts. Backlogs indicate future demand but take time to become revenue and cash, while data centers require huge funding. Dell and HPE each rose about 12% September 11 while Oracle fell around 1.8%, reflecting different pricing of equipment suppliers and construction-financing bearers.
Consumer electronics generated independent moves. Apple unveiled its first folding iPhone Duo September 9, starting at $1,999, for October 23 launch. Shares slipped that day and rose 3.6% the next; actual sales remain to be realized. Retailers were weaker: Macy's and American Eagle fell 4.7% and 14% September 10, indicating demanding earnings expectations.
The preweekend rebound chiefly eased sentiment. VIX rose from the prior Friday's 14.53 to Thursday's 17.84, then fell to 15.84 Friday. Reuters counted gains in 9 of 11 S&P sectors Friday, but US volume near 14 billion shares was below the 20-day 14.9 billion average. Durability still depends on a better financing-cost/earnings combination.
Asian markets diverge as China's investment-stabilization funds begin deployment
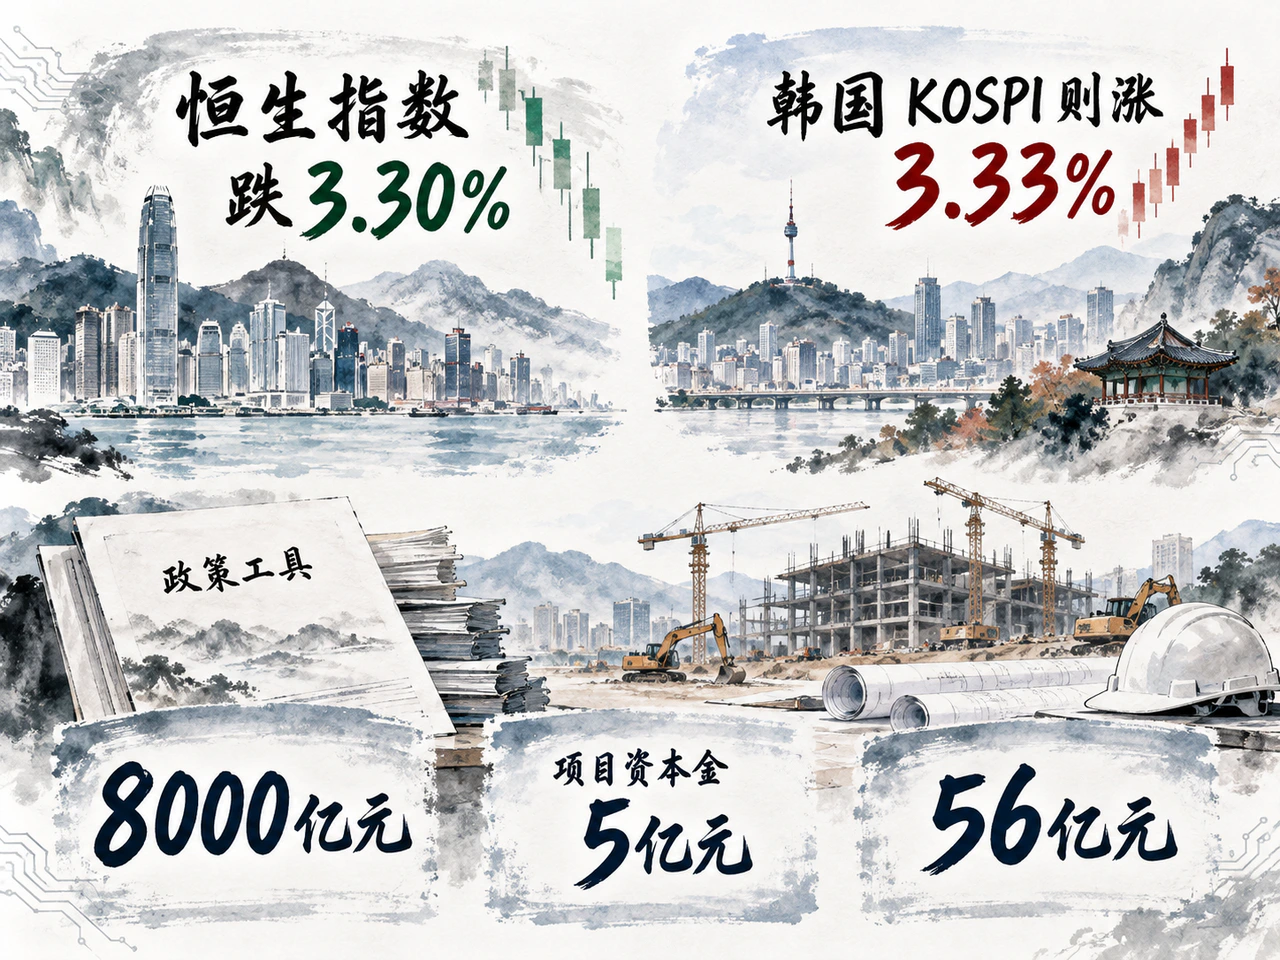
Asia likewise sits between higher global funding costs and better industrial demand. Local September 11 closes versus September 4: Hang Seng -3.30% to 24,805.63; Nikkei 225 -1.55% to 64,011.34; KOSPI +3.33% to 6,909.91.
Korean gains concentrated early. KOSPI rose 4.6% September 7, Samsung 5.7% and SK Hynix 8.3%, supported by AI computing and memory expectations. Later retracement still left weekly gains. Seoul Economic Daily, citing exchange data, said combined net short balances at the two firms fell KRW 670.9 billion from August-end through September 7. This cross-week shift suggests short covering may also have contributed.
Japan benefited early from AI deals before weakening. USD/JPY fell 1.35% for the week; yen appreciation may lower translated overseas earnings while oil increases import costs. Hong Kong also remained under rate and risk-appetite pressure.
China's August data showed different external-demand and domestic-price trends. Dollar exports released September 8 grew 25% annually and imports 28.2%, supported by high-tech and AI infrastructure demand. September 9 CPI showed +0.8% year on year, core +1.0% and PPI +3.8%. Reuters cited NBS attributing roughly 0.28 percentage points of the rise in annual CPI inflation to stronger energy-price gains. Strong exports, recovering upstream prices and low core inflation coexist, with substantial cost pressure in price recovery.
Investment support is moving from quotas to disbursement. China Securities Journal reported September 8 that initial funds from the annual RMB 800 billion new policy-finance instrument were deployed in several areas. Fujian's first 4 transactions totaled RMB 500 million of capital for 4 projects, expected to mobilize RMB 5.6 billion investment. Capital can unlock loans and building, but current growth depends on actual starts and spending; policy quotas and full-project investment are not current-year incremental demand.
Trade costs accumulate as fiscal and weekend news add variables

Trade policy added business costs. Reuters reported Canada's 15%–50% retaliatory tariffs on approximately $20 billion of US goods taking effect September 8. The US announced bans that day on certain Canadian alcohol, motorcycles and dairy, effective September 29. Sapporo's business considered moving limited nonalcoholic beverage production from Canada to the US, without a final decision. Tariffs alter import costs and profit allocation; bans can directly change market access.
Europe considered new safeguards. Reuters September 10 cited sources saying France, Italy and possibly Germany planned applications within weeks for chemicals/plastics measures covering PET, epoxy resins and fiberglass; the Commission had not announced quotas. Implementation could benefit upstream producers but raise downstream material costs.
US fiscal improvement mainly reflected calendars. August's approximately $167 billion deficit was down 52% annually, but Reuters said adjusting for benefits paid early in July and other timing produced about $248 billion, up $7 billion annually; the first 11 months totaled roughly $1.97 trillion. A monthly decline alone does not establish systematic tightening.
Trump proposed September 9 a $5,000 payment to US adults if Republicans retained both houses after the election. Reuters estimated principal costs near $1.2 trillion, but congressional approval was required and party opposition remained; no new appropriation existed. The proposal adds uncertainty to demand and issuance. Treasury's $6 billion longer-bond buyback announcement chiefly serves market functioning alongside continued new issuance; net supply effects require the issuance schedule.
Trade relationships shifted again after Friday's US close. On September 13, Reuters relayed Wall Street Journal reporting that Canada was exploring a not-yet-created EU associate-member relationship and cooperation in energy, AI and defense supply chains. Spokespeople had not responded and no agreement existed. The weekend report suggests further supply-chain adjustment, with real effects dependent on later arrangements while existing trade costs continue falling on firms and consumers.


