After the Fed's September hike, some Wall Street institutions outlined a policy path of one more increase this year, a high-rate hold next year and modest cuts the year after.
This working baseline draws on Fed projections and has support from some mainstream institutions. But a full year of unchanged rates next year still depends on conditions: core inflation must continue easing slowly, geopolitical energy disruption must gradually diminish, and demand from AI infrastructure investment must not persistently and substantially exceed the capacity of productivity improvements to accommodate it.
One more hike this year and a high-rate hold next year is a reasonable working baseline for allocation and macro analysis. It does not provide sufficient evidence that upside rate risk has cleared or next year's policy outcome is settled.
Another common fixed-income mistake confuses a yield cushion with a boundary of principal safety. Today's roughly 5% 10-year Treasury yield provides much greater carry than the low-rate past, but does not establish a very low probability of losses on long Treasuries. How much yield increase coupons can absorb is an approximation under specified assumptions. How far rates actually rise depends on inflation persistence, growth and term premiums, and cannot be mechanically inferred from historical levels.
1. Views converge on this year, but remain far apart on next year
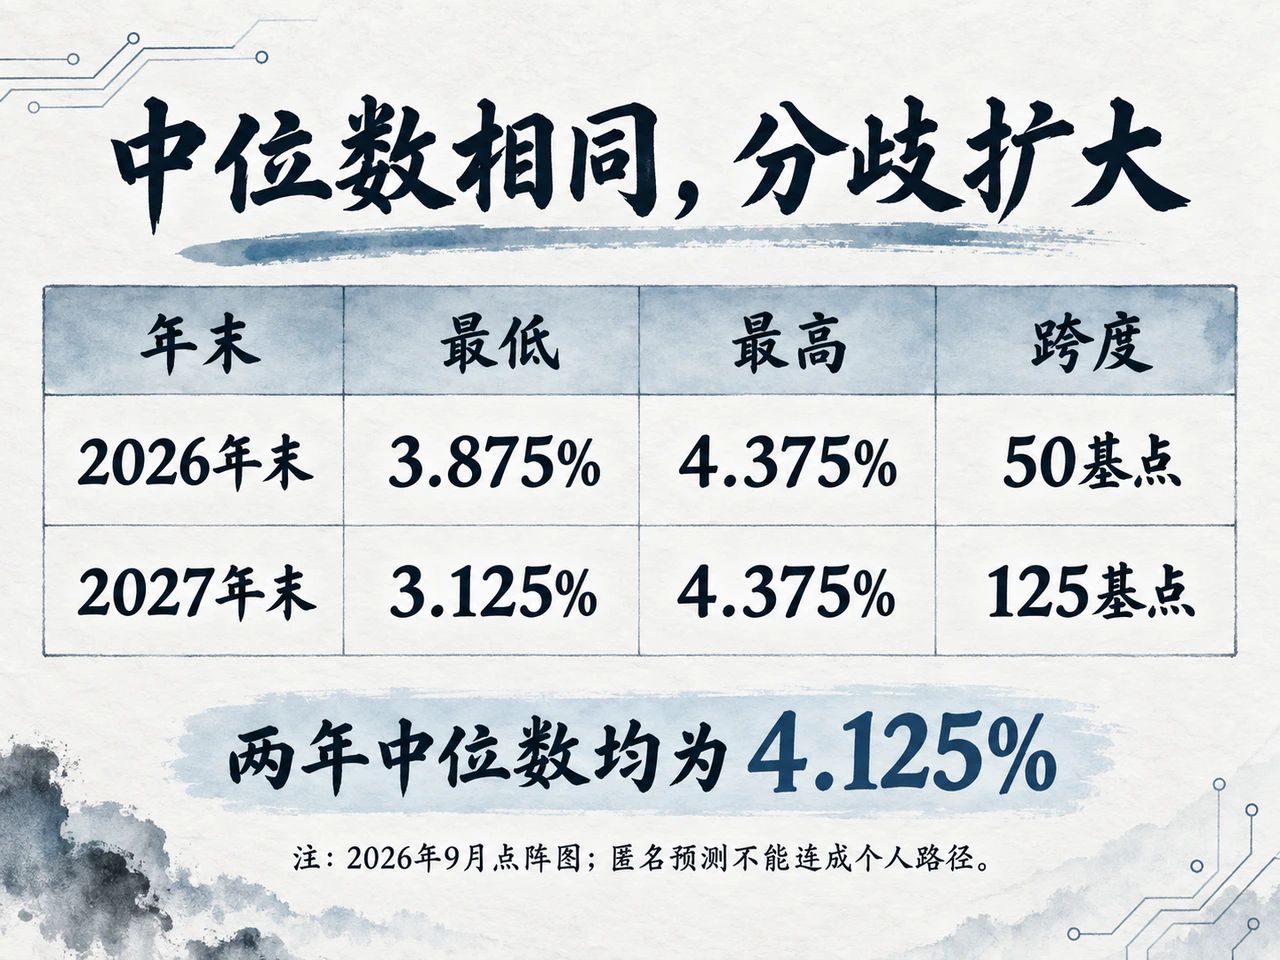
On September 16, the Fed raised its federal funds target range 25 basis points to 3.75%-4.00%. Median year-end policy projections in the updated dots were 4.125% for both 2026 and 2027, declining to 3.875% in 2028 and 3.625% in 2029. The SEP table rounds these to one decimal place: 4.1%, 4.1%, 3.9% and 3.6%.
Relative to the postmeeting range, the 2026 median of 4.125% implies room for one more 25-basis-point hike this year. The identical 2027 median can easily be summarized as no action throughout next year.
That summary overlooks the dots' statistical features. Equal year-end medians mean only that the middle observations at two discrete dates are equal, not that the intervening path must be flat. Anonymous dots also cannot be linked across years into one official's continuous projected actions.
Looking beyond the median to the distribution reveals the actual disagreements.
The 18 projections for 2026 are relatively concentrated: 12 at 4.125%, four at 4.375% and only two at the current midpoint of 3.875%. Thus 16 of 18 policymakers see at least one more hike this year, with only 50 basis points between the highest and lowest forecasts.
For 2027 the distribution widens markedly: eight at 4.375%, six at 4.125%, three at 3.625% and one at 3.125%, expanding the range to 125 basis points. The 4.125% year-end median is merely the middle ranked position of dispersed forecasts. It reflects substantial disagreement over future levels, not overwhelming consensus on unchanged rates.
Postmeeting investment-bank and research views also span further hikes, a hold and renewed cuts. Public research and media disclosures on September 17 showed the following main judgments:
| Institution | View on subsequent policy |
|---|---|
| Goldman Sachs | Revised its previous view of only a September hike this year to another 25-basis-point October increase |
| Bank of America | Expects consecutive October and December hikes, a markedly hawkish remainder of the year |
| JPMorgan | Expects the next hike in December |
| Morgan Stanley | Expects a December hike and another 25 basis points in March 2027 |
| Citi | Expects no further hikes this year and renewed cuts in June 2027 |
| BBVA | Expects another 25 basis points in December, no change in 2027 and cuts beginning in 2028 |
BBVA comes closest to one more hike this year and a hold next year. Morgan Stanley explicitly extends tightening into Q1 2027. Citi argues that modest hiring and declining labor-force participation do not support accelerating labor demand, and subsequent inflation may be milder than the Fed expects.
The differences reflect both differing macro estimates and interpretations of the Fed's reaction function. At similar inflation readings, some institutions believe consecutive action is needed to demonstrate anti-inflation credibility; others favor time to observe delayed transmission of existing restraint.
The baseline can organize research and portfolio risk, but is not a settled market conclusion. Dots are officials' conditional projections, bank views are sell-side reasoning, and rate futures embed risk premiums and positioning. The three cannot be equated.
2. The dots' weak point is their assumption of eventual normalization
The dots and SEP generally follow baseline modeling logic: near-term forecasts address visible tensions, while the distant path assumes shocks fade, policy works smoothly and the economy returns to steady state.
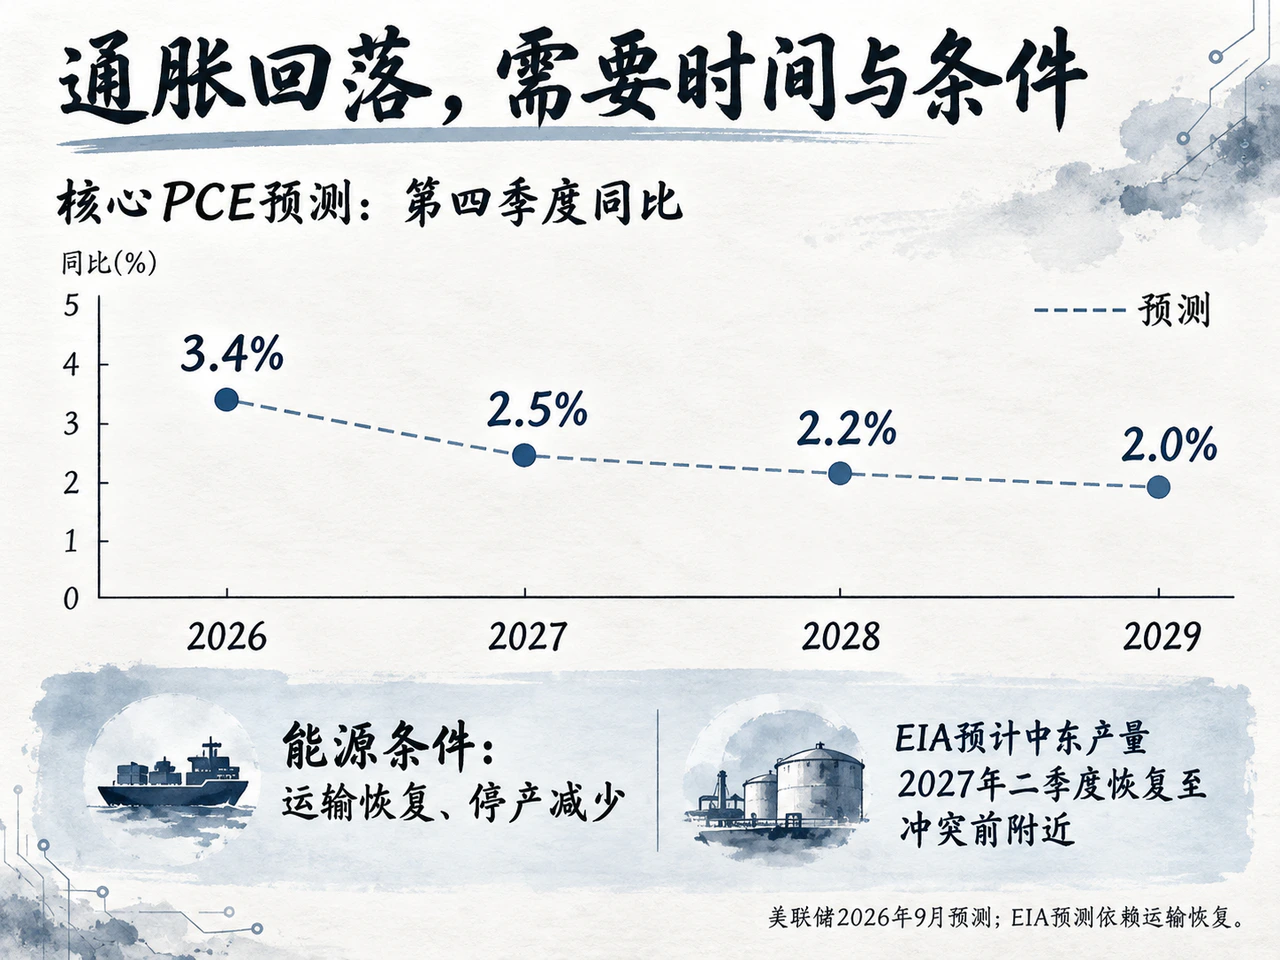
This projection has a typical convergence pattern. Core PCE inflation is expected to fall from 3.4% in 2026 to 2.5% in 2027, 2.2% in 2028 and the 2.0% target in 2029. Real GDP growth is projected at 2.3%, 2.4%, 2.2% and 2.1%, respectively, with unemployment constant at 4.1%. Inflation and GDP use fourth-quarter annual changes; unemployment is the fourth-quarter average.
In this picture, inflation eases steadily, growth remains resilient and full employment is stable. Policy rates accordingly decline gradually after a period at elevated levels.
The baseline has internal logic: returning inflation to target is monetary policy's core mission, and models generally do not put unmaterialized external conflicts, supply interruptions or liquidity shocks into their baseline. The Fed's definition of longer-run projections itself assumes no further unexpected external shocks.
Actual macro developments often disrupt linear convergence. Energy supply may suffer repeated interruptions; sector capital spending may persistently lift aggregate demand; labor supply structures may change. Conversely, accumulated external restraint may cool investment and consumption, with financial conditions tightening before policy rates change.
Inflation returning to 2% in the distant future is an outcome policy seeks, not a law that time naturally fulfills.
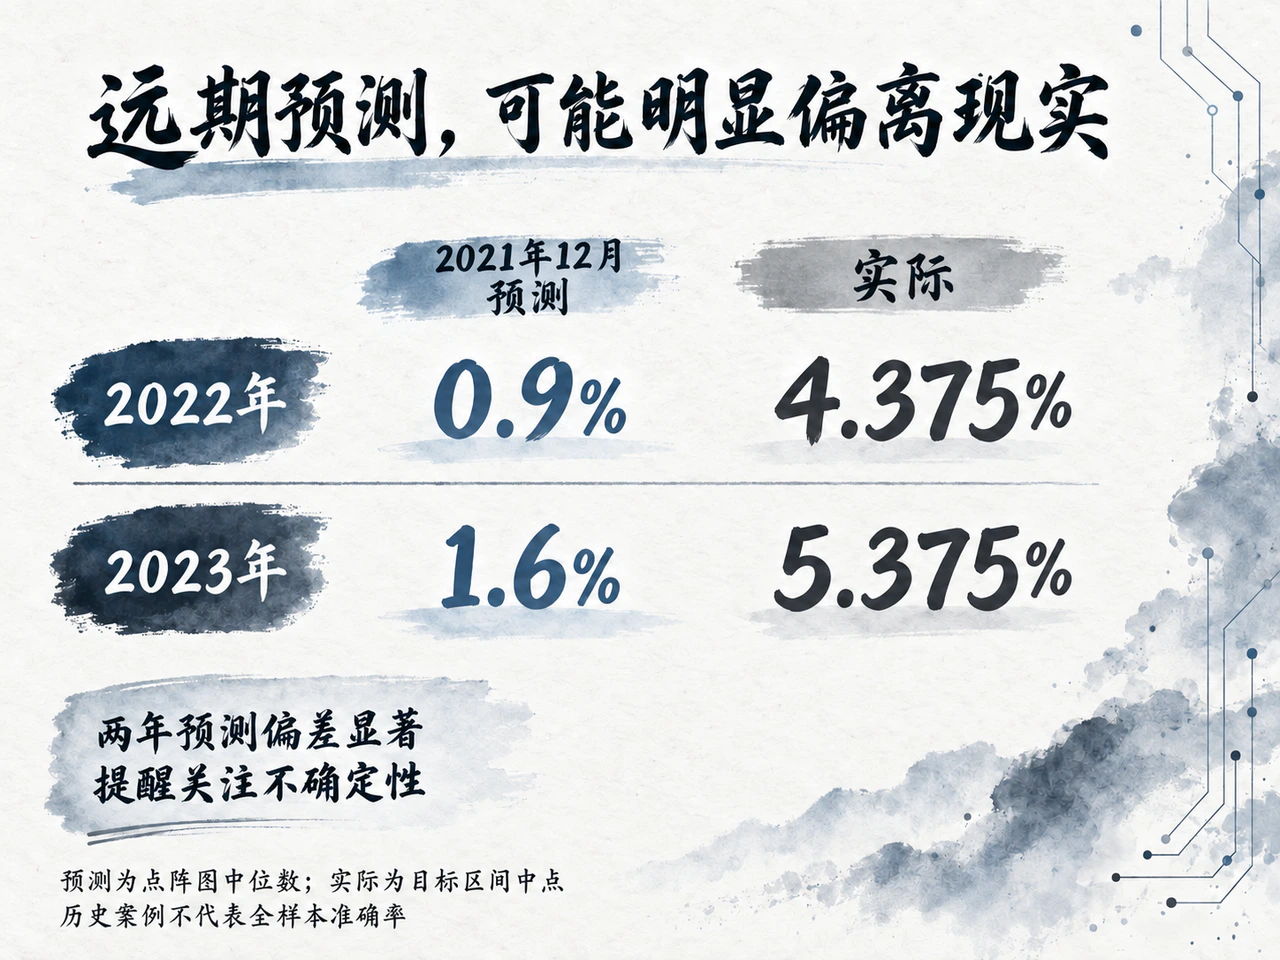
Historical errors show that distant dots are not a fixed roadmap. In December 2021, median projections for year-end 2022 and 2023 were just 0.9% and 1.6%. Actual target ranges reached 4.25%-4.50% and 5.25%-5.50%, with midpoints of 4.375% and 5.375%.
Errors also run the other way. December 2015 dots projected a 1.4% median at end-2016, while the actual year-end range was only 0.50%-0.75%. Normalization proceeded much more slowly than forecast.
These examples show potentially large gaps between conditional projections and reality, not a systematic full-sample accuracy test or empirical proof of a fixed psychological modeling bias. The dots are conditional paths under specific assumptions. Their convergence chiefly reflects goal-oriented policy reasoning, fundamentally different from complex real-world dynamics.
The core value of reading the dots is therefore to infer their underlying macro assumptions and track whether reality invalidates them.
The same applies to the longer-run neutral rate. The SEP's roughly 3.2% longer-run federal funds median is usually interpreted as officials' anchor for the neutral nominal rate, which neither stimulates nor restrains growth.
That equilibrium is not constant: saving preferences, investment appetite, fiscal expansion, demographics and productivity shift it. Recessions often require policy below it, while persistent inflation may require rates above it for a long time. The roughly 3.2% longer-run neutral policy rate must not be equated with the 10-year Treasury yield, which includes both the expected future short-rate path and a term premium demanded for long-duration assets.
3. A 5% yield provides a cushion, not a ceiling on rates
A long historical perspective helps assess current Treasury yields' investment appeal and risks more objectively.
Using daily 10-year constant-maturity yields in the Fed's H.15 report and FRED, representative historical highs are as follows. These are daily readings, not intraday peaks:
| Period | Date | 10-year yield |
|---|---|---|
| 1981 | September 30 | 15.84% |
| 1994 | November 7 | 8.05% |
| 2000 | January 20 and 21 | 6.79% |
| 2007 | June 12 | 5.26% |
| 2018 | November 8 | 3.24% |
| 2023 | October 19 | 4.98% |
| 2024 | April 25 | 4.70% |
| 2025 | January 13 | 4.79% |
In this cycle, the September 16, 2026 daily yield of 5.01% exceeded the 2023-2025 peaks and approached 2007's 5.26% cyclical high. Relative to most of the past nearly two decades, nominal yields are indeed in a high historical percentile.
But 1981, 1994 and 2000 also show that 5% is no absolute historical ceiling. Inflation trends, real natural rates, sovereign financing and term-premium structures vary greatly by cycle. Declaring today's level the cycle's endpoint based simply on the last two decades is not sufficient macroeconomic reasoning.
Higher yields' most direct value is greater coupon income during the holding period, creating a buffer against volatility. A simplified example quantifies this:
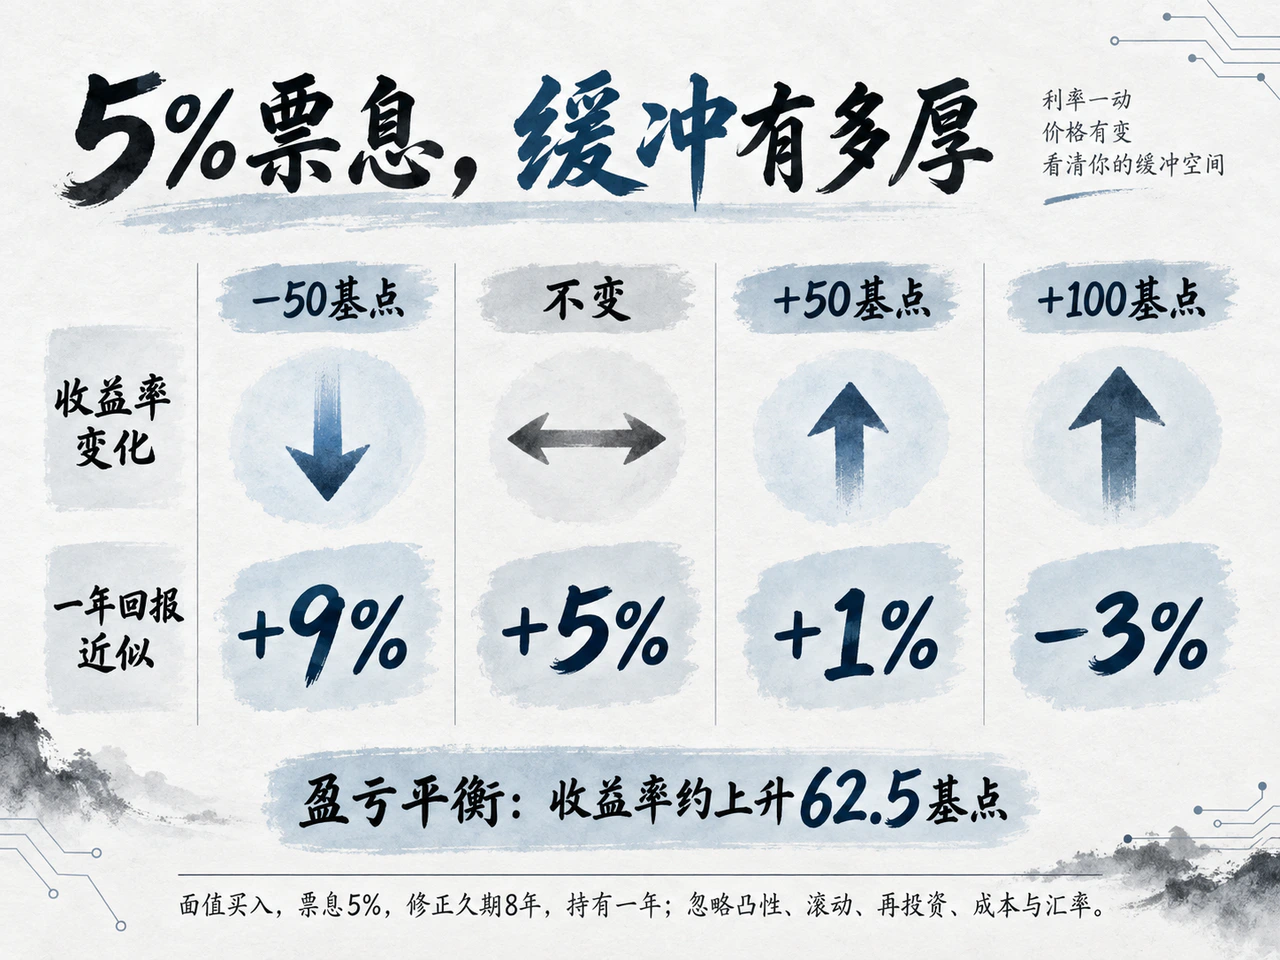
Assume a bond bought at par with a 5% coupon and yield to maturity, modified duration of about 8 years and a one-year holding period. Ignoring convexity, roll-down, interest reinvestment, trading frictions and exchange rates, the approximate annual return is 5% minus 8 times the yield change, expressed as a decimal:
| Yield change over one year | Approximate price change | Approximate return including coupon |
|---|---|---|
| Down 50 basis points | +4% | +9% |
| Unchanged | 0% | +5% |
| Up 50 basis points | -4% | +1% |
| Up 100 basis points | -8% | -3% |
The calculation suggests a 5% annual coupon can absorb roughly 62.5 basis points of yield increase. Compared with the extremely low-rate era's meager coupons, investors' capacity to withstand moderate volatility has improved materially.
A coupon cushion and a low probability of principal loss are different propositions. The former is an approximate coupon-duration sensitivity calculation under specified assumptions; the latter depends on the actual future path and probability distribution of yields. Renewed inflation and increased Treasury supply could lift term premiums and long yields by more than 100 basis points, overwhelming a 5% coupon and producing a net market-value loss. Leverage or longer duration can greatly amplify volatility. For unhedged positions measured in a non-dollar currency, exchange moves may worsen drawdowns or offset them in a favorable direction; they cannot simply be assumed to increase losses in one direction.
A Fed hold next year likewise does not guarantee unchanged long yields. Persistent federal issuance pressure and higher compensation for term risk can still push long Treasury prices lower while policy rates remain unchanged.
If more investors find current levels attractive, buying directly supports bond prices and lowers yields. Only if lower long rates then improve equity valuations, narrow credit spreads and broadly ease financial conditions enough to stimulate aggregate demand could a second-round effect pressure the Fed to keep rates high. Numerous intermediate steps separate the two; bullish long-bond buying cannot directly be inferred to push yields higher.
4. Whether oil falls determines the timing of inflation normalization
Current inflation data support neither rapid, established control of inflation nor disorderly acceleration across all prices.
July PCE inflation was 3.7% year on year and core PCE 3.3%, both up 0.2% month on month. August CPI was 3.4% annually and 0.4% monthly; core CPI was 2.4% annually and 0.3% monthly. PCE and CPI have different weights and coverage, so their differing absolute readings do not establish decisive overall disinflation.
Energy was central to August's price jump: energy rose 16.3% year on year and gasoline 27.4%. Gasoline increased 3.9% in one month and directly contributed more than one-third of the overall monthly CPI rise.
The monetary-policy impact of Middle Eastern conflict depends on the duration of crude disruption and whether upstream energy costs spread to transport, manufacturing, final services and wages, rather than oil reaching a psychologically salient round number on a particular day.
The EIA's September Short-Term Energy Outlook estimated geopolitically disrupted Middle Eastern crude output at about 6.72 million barrels a day in August, up from 4.98 million in July. Global inventories had drawn about 400 million barrels during the year. August spot Brent averaged $91 a barrel, up $7 from July.
The EIA baseline expected Hormuz and major alternative transport routes to recover gradually, with Middle Eastern output returning to preconflict conditions in Q2 2027. Average spot Brent was expected to ease from about $90 a barrel in the second half of 2026 to roughly $74 over full-year 2027.
This outlook describes gradually easing energy inflation next year, but depends on demanding assumptions: transport capacity returns on time, shut-in output continues narrowing and global inventories rebuild. Its model input window ended September 3 and could not fully incorporate subsequent geopolitics. Further damage to critical shipping nodes or energy infrastructure could delay recovery.
High absolute oil prices do not mean annual inflation stays high forever. Following a one-off price jump, if oil stops rising in successive steps, its annual contribution naturally fades as the comparison base increases. Moderate inflation does not require every price to return to preconflict levels.
The serious policy test is second-round transmission: firms embed high logistics and energy bills in long-term contracts, workers demand higher nominal pay to offset living costs, and businesses and households develop expectations of persistent inflation. Once complete, that chain creates stickiness beyond simple energy supply-demand arithmetic.
The New York Fed's August Survey of Consumer Expectations, released September 8, showed one-year expected inflation of 3.6% and five-year expectations of 3.0%, both unchanged, while the three-year measure fell to 3.2%. Household expectations and the Fed's 2% longer-term headline PCE target differ conceptually and statistically and cannot be equated. One survey showed no broad rise across horizons but could not establish that systemic long-run deanchoring risk had been fully eliminated.
A cautious characterization is therefore appropriate: energy supply shocks are extending the return to normal inflation and exposure to sticky-inflation risk remains substantial. Whether this has become broad pressure forcing a renewed aggressive Fed hiking cycle still requires close tracking of core prices, wages and long-term expectations.
Even the Fed does not expect core inflation fully normalized next year: its SEP projects core PCE of 2.5% in 2027 and 2.2% in 2028, showing that returning to 2% is a prolonged task. This strongly supports higher for longer, but not an unsupported bet on rapid cuts based solely on assumed oil declines.
5. AI investment creates demand first; productivity returns may arrive later
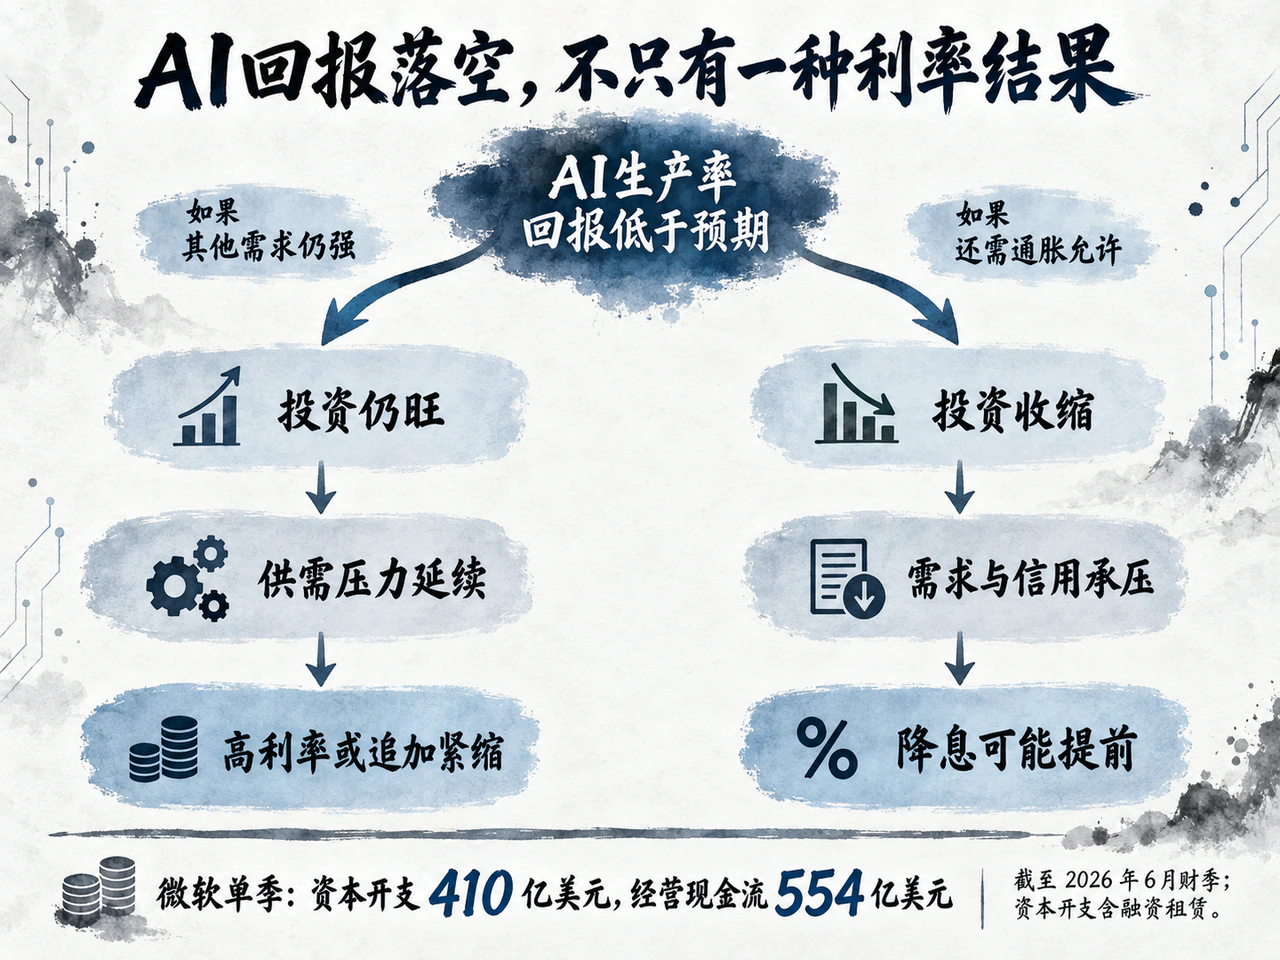
Even if Middle Eastern geopolitical risks fade, 2027 rates remain constrained by a major domestic variable: whether AI infrastructure spending momentum persists and the associated productivity returns arrive on schedule.
AI input and output have a significant timing mismatch. Large computing centers, server and advanced-chip procurement, and power-grid upgrades immediately create equipment orders, electrical load and capital demand. Applying AI to traditional businesses, reorganizing processes, lowering costs and expanding output require complex implementation, adoption and organizational change. The two sides do not advance symmetrically through time.
Governor Cook highlighted this tension in a July 15 speech. She said AI infrastructure capital spending had already raised prices of chips, precision high-tech hardware, software and utilities. Publicly disclosed data-center plans exceeded $1.5 trillion, with only a small share implemented then. This was multiyear investment intent, not actual cash outflow in one fiscal year, and could not simply be counted at face value in current U.S. GDP.
Technology leaders' finances help explain funding sources. In Microsoft's quarter ended June 2026, capital spending was $41 billion including finance leases, cash purchases of property and equipment $35.8 billion, operating cash flow $55.4 billion and free cash flow still $19.6 billion. One firm's ample cash does not represent all leaders. High rates raise capital costs, but well-funded leading platforms may be relatively less rate-sensitive during strategic competition. This possibility does not mean high rates cannot constrain AI spending or that core infrastructure investment cannot cool.
Energy and power bottlenecks also matter. The IEA forecasts global data-center electricity use rising from 485 terawatt-hours in 2025 to 950 in 2030, around 3% of global demand. The global share understates local stress: concentrated hubs may face longer transformer lead times, restricted grid connections and tight generation capacity.
These microeconomic conditions do not directly establish that the Fed must raise rates to suppress AI overheating. Policy concerns aggregate supply and demand. Technology spending offset by lower property or manufacturing investment need not overheat the economy, and imported components do not all count as U.S. domestic value added.
The least favorable macro combination is continued expansion in real investment demand while expected economy-wide productivity gains remain delayed. Large current demand is activated without matching effective supply, confronting the economy with supply ceilings and inflation pressure.
A simplified cost model clarifies the mechanism. With nominal hourly wages growing 4% and labor productivity 3%, unit labor costs rise only about 1%. If productivity grows just 1%, unit labor costs rise nearly 3%. This does not mechanically imply a 2-percentage-point increase in consumer inflation, but shows how identical wage growth has different cost and inflation implications under different productivity outcomes.
Aggregate data do not establish that AI's macro productivity benefits have failed. In Q2 2026, U.S. nonfarm business productivity rose 2.2% year on year and unit labor costs only 1.4%. Annual average productivity growth from Q4 2019 to Q2 2026 was 2.1%, clearly above the previous Q4 2007-Q4 2019 cycle's roughly 1.5%. These are positive signals, but cannot attribute the improvement entirely to AI, and current aggregate statistics cannot isolate AI's independent spillover effect.
If productivity conversion later disappoints, policy still depends on how firms respond:
First, if market-share competition, contracts and construction commitments sustain large spending while other sectors' demand remains resilient, supply improvement lagging demand would extend restraint and potentially increase pressure for further tightening. This does not require renewed Middle Eastern escalation.
Second, if disappointing returns lead firms to cut budgets or slow new projects, related supply-chain credit could come under pressure and aggregate demand weaken. Such slowing need not become economy-wide credit contraction or rapidly trigger widespread defaults. With inflation and policy constraints still present, policy need not automatically or quickly shift to consecutive cuts.
Business-model profit realization must also be distinguished from macro productivity spillovers. Competition may make platforms pass technology benefits to users through price cuts, allowing volatile platform profits alongside improving macro productivity. Conversely, strong upstream chip and computing-hardware earnings do not alone prove a substantial downstream productivity leap.
For bonds, the AI narrative cuts both ways. Strong spending with slow productivity increases demand-overheating and tightening pressure without necessarily raising the long-term equilibrium rate. A significant spending contraction could lower long yields through safe-haven demand or revised expectations, but inflation still matters and a bond rally is not guaranteed; related credit may face valuation and spread pressure. Different assets may follow opposite pricing logics.
6. Keep the baseline, but prepare for deviations in both directions
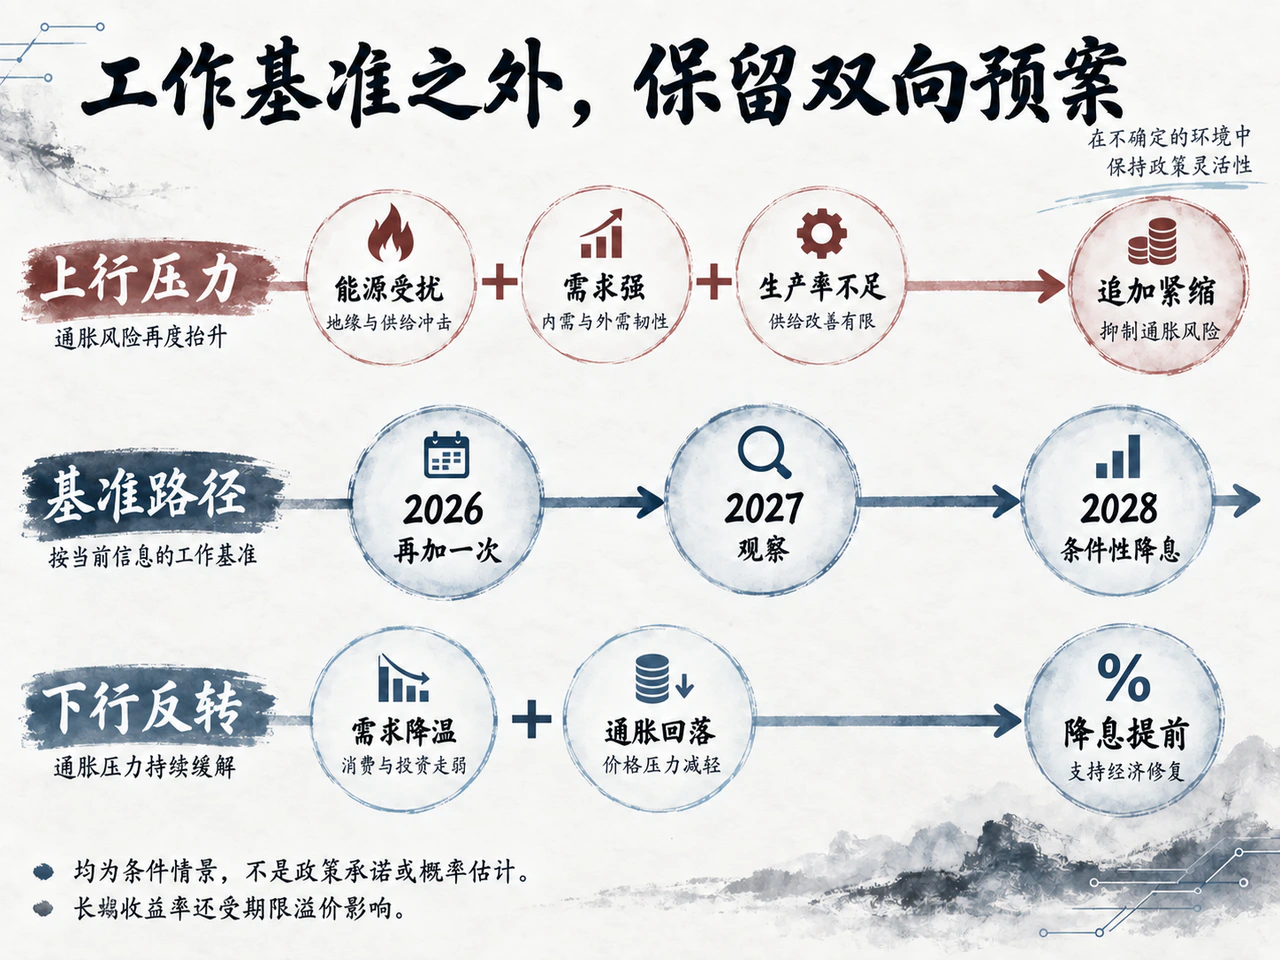
One more hike this year and high rates next year has fundamental support. Inflation remains above the Fed's 2% longer-run target, substantially constraining rapid, large easing, though not making it impossible. At the same time, marginal demand and cost data do not show universal uncontrolled overheating, so another dramatic tightening cycle also lacks sufficient justification.
August payrolls rose 162,000, a relatively firm headline. After June was revised up to 31,000 and July to 21,000, with a combined upward revision of 55,000, the three-month average was still a modest roughly 71,000. Unemployment held at 4.1%, but participation had fallen 0.5 percentage points from January. Policy analysis should not accept only the optimistic interpretation of low unemployment: it may reflect demand resilience or structural supply contraction.
July real personal consumption expenditures (PCE) were almost unchanged month on month, Q2 unit labor-cost growth remained moderate at 1.4% annually, and surveyed expectations did not rise broadly across horizons. These facts suggest no clear current prerequisites for aggressive hiking next year.
A limited additional tightening followed by observation is therefore an appropriate working macro baseline. Its strength depends on continuing confirmation in high-frequency data, and investment frameworks need plans for different directions:
Scenario 1, baseline: inflation eases gradually and high rates persist. Inflation continues slowly lower, shipping routes improve and crude disruption eases. AI capital spending expands moderately without aggregate overheating. The Fed raises once more this year, observes in 2027 and gradually begins cuts in 2028 after further disinflation. This is a conditional path, not a policy commitment, and resembles current median dots and views such as BBVA's.
Scenario 2, upside pressure: inflation becomes entrenched again and further tightening extends into next year. Geopolitics prolong energy disruptions, AI infrastructure and nonresidential investment make private demand more persistent, and productivity improvement remains elusive. If all three reinforce one another, the impetus for renewed hikes rises substantially.
For risk management, this article sets an illustrative stress test: Brent stays at $100-$120 for more than two quarters, core PCE rises 0.3%-0.4% monthly for several months, and aggregate demand remains firm. Under such stress, investors may need to consider pressure for another cumulative 75-100 basis points of tightening in 2027.
This is only an illustrative exercise to reveal potential exposure, not an official Fed trigger or statistically calibrated tail probability. Minor adjustments next year and a renewed deep tightening cycle require fundamentally different macro conditions. Renewed tightening cannot be ruled out while geopolitical and external disruption remain unclear, but without quantitative modeling it should not be assigned a definite subjective probability.
Scenario 3, downside reversal: real demand cools more than expected and easing begins earlier. Labor weakness spreads rapidly to core consumption, or AI computing investment contracts materially after disappointing monetization, while supply-chain recovery accelerates core disinflation. The reason to delay easing diminishes, potentially bringing cuts forward into 2027, as Citi currently expects.
An independent asset-price divergence warning is also needed: long Treasury yields may rise under massive supply and term-premium repricing even without further policy hikes. Allocation teams must separate policy analysis from long-end term-premium pricing and avoid equating benchmark-rate tracking with long-bond holding returns.
Macro reviews should focus on indicators capable of changing scenario weights: core PCE monthly momentum and inflation breadth; changes in real consumption and hiring; medium- and long-term expectations; energy shipping and commercial-stock rebuilding; and actual AI project funding, power allocation, downstream monetization and productivity spillovers. One month's data can trigger vigilance, but sustained confirmation usually overturns the baseline; major shocks can change the path quickly.
The dots show how policymakers understand current constraints and their assumed response mechanism; they cannot remove future uncertainty for markets. Relatively high bond yields offer coupon income and some volatility cushion. Actual returns nevertheless depend on macro developments and markets, as well as preparation for deviations from the baseline, liquidity management and response strategies.


