After the Federal Reserve raised rates on September 16, U.S. Treasury yields continued to climb, with the 10-year rising from 5.01% to 5.24% by September 28. The adjustment reflected a deeper macroeconomic reassessment. Despite elevated financing costs, the private sector retained its willingness to expand spending and investment, prompting markets to reconsider how high real rates must be to restore supply-demand balance and how long they must stay there. Persistent government financing needs and greater investor demands for compensation on long-term bonds provided additional upward pressure at the long end.
Current demand was supported by capital spending and income expectations, while new capacity and productivity improvements would take time. Large stocks of fixed-rate debt delayed transmission of tightening to the real economy, and cost shocks made disinflation harder. In that setting, a single 25-basis-point hike was far from enough to remove uncertainty over subsequent tightening. Recent stability in long-term inflation compensation alongside a substantial rise in real yields reflected repricing toward greater restraint and a longer policy cycle.
1. Policy rates have risen, but market repricing continues
On September 16, the Fed raised its federal funds target range to 3.75%-4.00%. By September 28, 2-, 5-, 10- and 30-year Treasury yields had reached 4.92%, 5.06%, 5.24% and 5.56%, respectively. From the day of the hike, the entire curve shifted upward, with the long end slightly ahead.
| Maturity | September 16 | September 28 | Change over period |
|---|---|---|---|
| 2-year | 4.74% | 4.92% | +18 basis points |
| 5-year | 4.86% | 5.06% | +20 basis points |
| 10-year | 5.01% | 5.24% | +23 basis points |
| 30-year | 5.35% | 5.56% | +21 basis points |
This was not a one-way rise. On September 17, both 2- and 10-year yields fell 7 basis points. As late as September 22, the 10-year was 4.96%, still below its level on the hike date. The decisive jump came on September 23, when 2- and 10-year yields rose 14 and 15 basis points in a single session. The purchasing managers' surveys (PMIs) released that day showed strengthening private-sector activity, while a 5-year Treasury auction required a notable price concession.
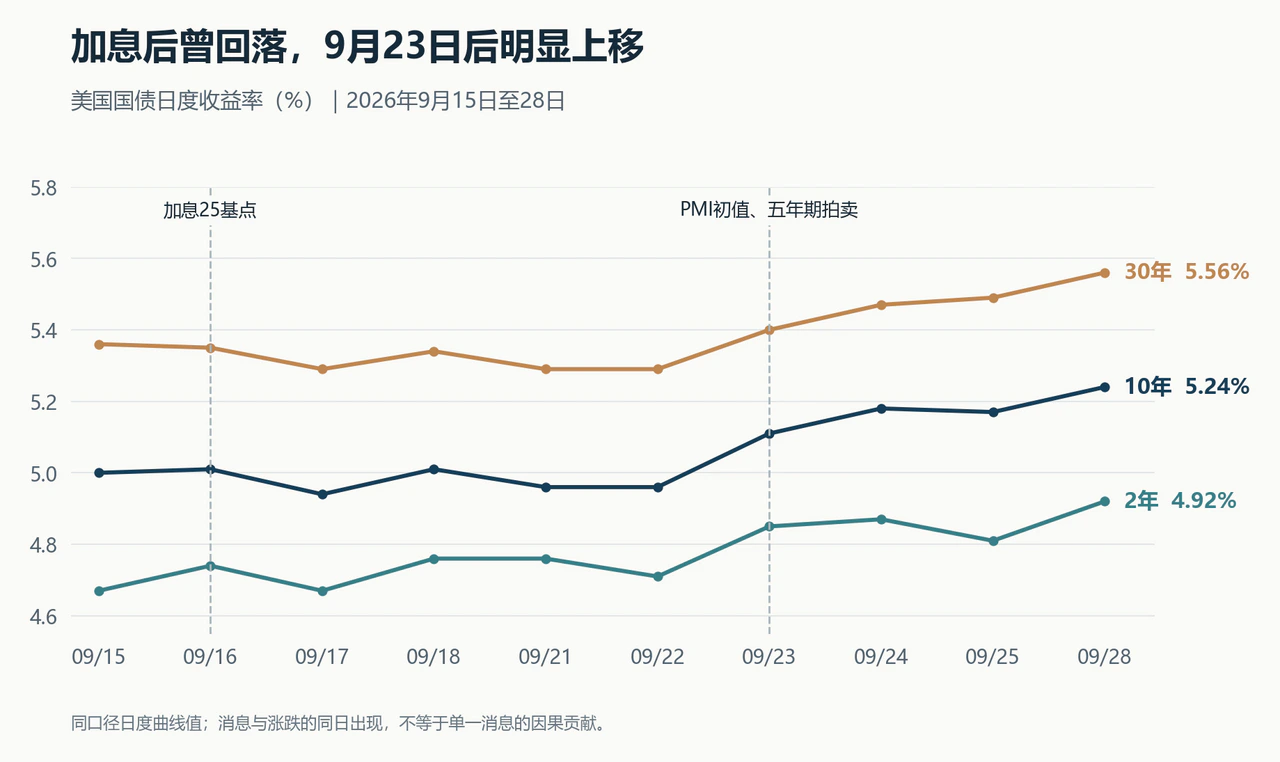
This sequence shows that absorbing an already announced rate decision and reassessing new economic information are distinct processes. Information fully priced on the hike date cannot explain concentrated selling a week later. Daily trading data cannot precisely attribute the respective contributions of surveys, official remarks and auctions.
The curve's shape narrows the search for explanations. From September 16 to 28, the 10-year/2-year spread widened only slightly, from 27 to 32 basis points; measured from the day before the meeting, it even narrowed slightly. An explanation based solely on increased long-term Treasury supply cannot account for the simultaneous rise in short yields. Expectations for the future policy path had also changed.
More significantly, most of the increase was in real yields. Over the period, the 10-year Treasury inflation-protected security (TIPS) real yield rose 22 basis points, from 2.68% to 2.90%, while the gap between nominal and real yields—inflation compensation—edged up only from 2.33% to 2.34%. The 5- and 30-year maturities showed similar patterns. Even moving the starting date back to the day before the meeting, the 10-year real yield rose 28 basis points while inflation compensation narrowed 4 basis points, further corroborating this assessment.
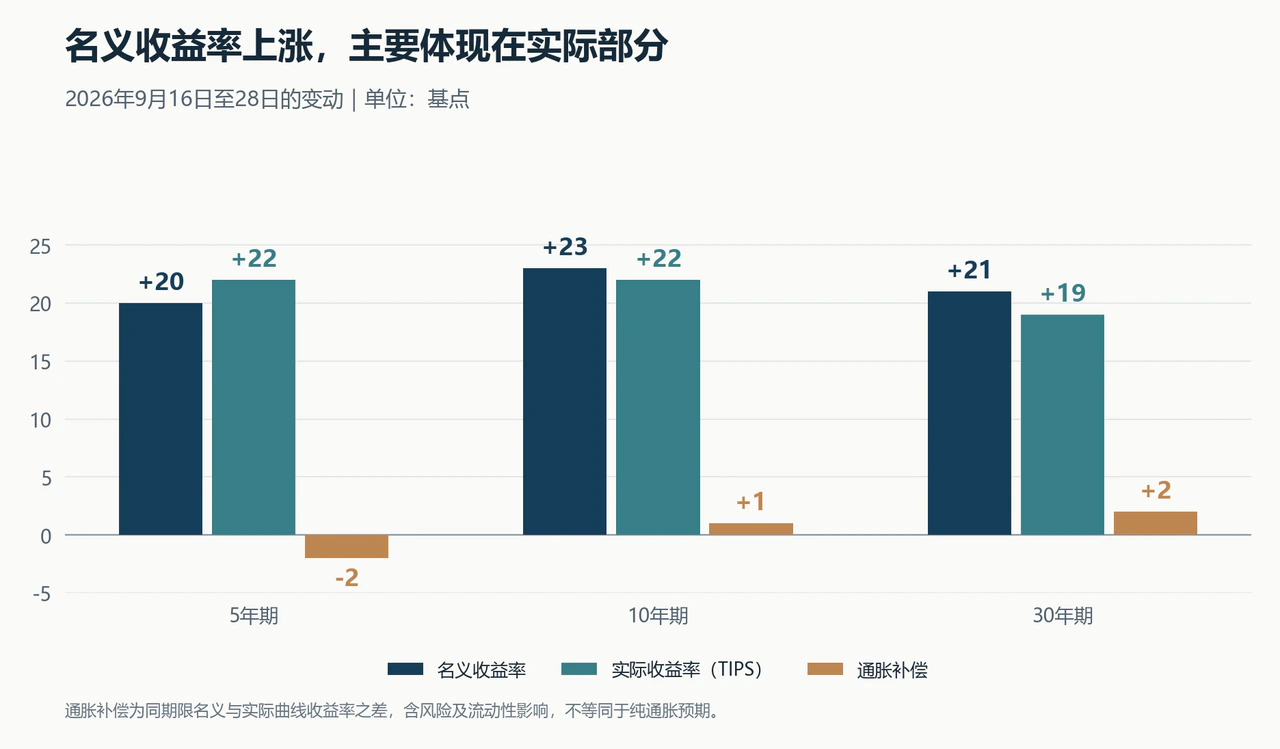
Inflation compensation combines inflation expectations, risk premiums and liquidity effects, so it is not a pure measure of expected inflation. Real Treasury yields likewise contain term risk and cannot be equated directly with the natural rate. These price changes nevertheless show that long-term inflation compensation did not expand sharply. What rose substantially was the real return demanded for holding long-term dollar assets.
From another perspective, long-term yields comprise average expected future short rates and a term premium. For September 16-25, the San Francisco Fed's CR model attributed the 10-year rise to 7.6 basis points of higher expected short rates and 7.6 basis points of higher term premium. The New York Fed's ACM decomposition assigned 4.7 and 10.5 basis points, respectively. Although the models estimated different weights, both pointed to the same fact: the two components were pushing yields up together.
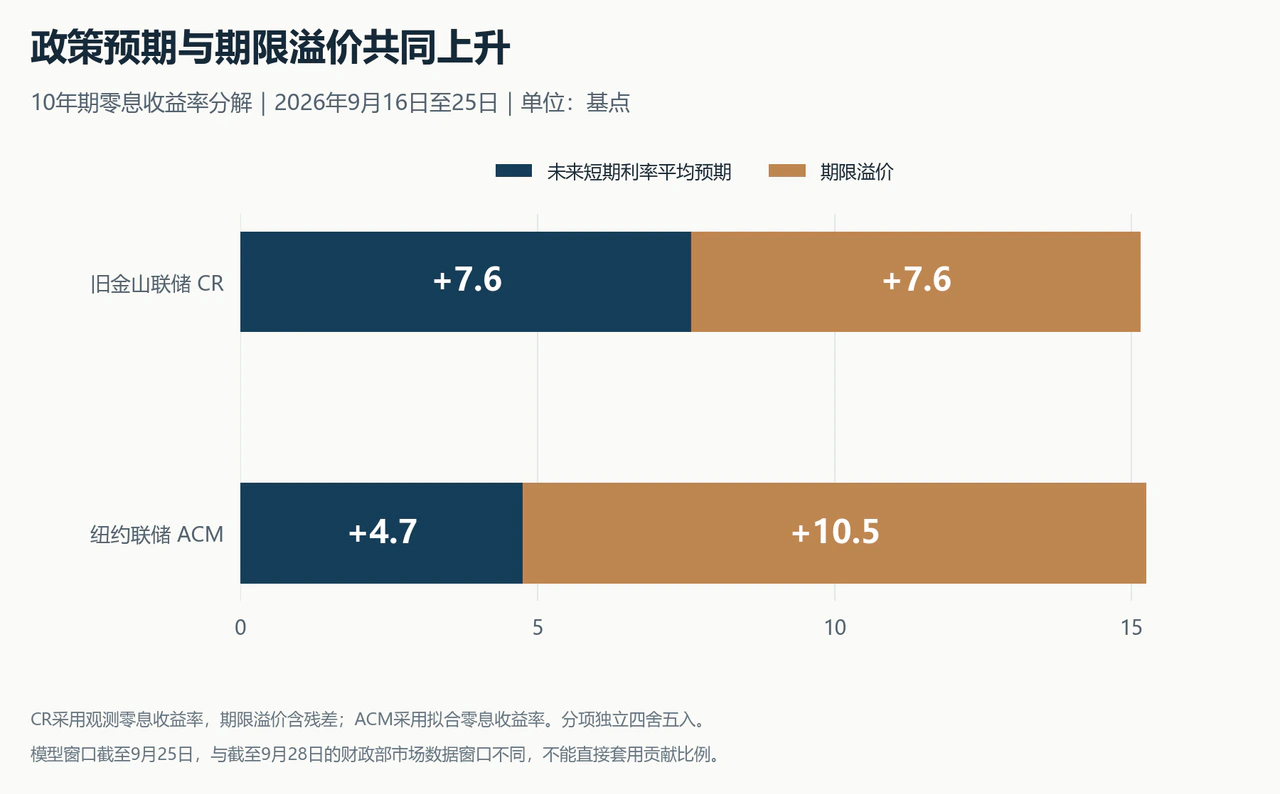
These model data end on September 25 and use zero-coupon yields, so the proportions cannot be mechanically applied to the Treasury curve's change through September 28. Real yields and term premiums also cannot simply be added, because real yields already include some long-term risk compensation. Existing evidence points to both reassessment of future real policy restraint and changes in long-term risk pricing. Neither an explanation solely of runaway inflation nor one solely of a Treasury supply shock provides a complete account.
The central questions follow: with long-term inflation compensation broadly stable and the Fed already raising policy rates, why does the market still believe the real economy requires higher real rates for longer? Why do investors still demand a larger premium to hold long-term bonds?
2. Resilient demand delays expected cuts; long Treasuries require more compensation
Interest rates connect current spending with future income. Companies borrow to build capacity in advance, households plan consumption around expected income, governments borrow to sustain public spending, and savers evaluate returns before deferring consumption and taking risk. When society's willingness to spend rises but available resources, willingness to save and capacity to bear risk do not keep pace, the real rate needed to balance supply and demand rises. Bond markets detect this shifting balance and discount it into higher expected policy rates and risk compensation.
(1) Private investment remains strong; higher rates have yet to restrain demand
Private spending resilience is the starting point for examining this repricing. U.S. real GDP grew only 1.5% at a seasonally adjusted annualized quarterly rate in Q2, but final sales to private domestic purchasers—consumption plus private fixed investment, a clearer measure of underlying momentum—grew a strong 4.2%. The figures are not contradictory: inventories, government spending and net exports affect total GDP, and imports satisfied some private demand. Moderate headline GDP growth alone therefore does not establish that private spending has been sufficiently restrained.
September's preliminary U.S. composite PMI rose from 56.0 to 58.4, reinforcing this observation. Broad strengthening in orders, hiring and backlogs indicated companies were still actively securing resources for potential future demand. Survey indicators are not actual output, but they weakened expectations of rapid cooling and reduced the need for near-term Fed easing.
The technology investment wave led by artificial intelligence (AI) gives this capital demand a distinctly intertemporal character. New data centers and related power infrastructure require current spending on equipment, materials, land and labor, while meaningful productivity gains depend on lengthy commissioning, business reorganization and technology diffusion. Large expenditures come first; capacity that increases effective supply and lowers unit costs comes later. During construction, the economy initially experiences rising demand for physical resources rather than lower costs from greater efficiency.
Whether firms expand or reduce investment depends on expected project returns relative to all-in capital costs. If technological innovation promises returns sufficient to cover higher financing costs, many projects retain strong incentives to proceed even at high rates. Optimism about future income and asset appreciation also supports current household consumption. High interest rates can thus coexist with strong real demand. Their coexistence does not by itself mean rate increases have failed.
Even cash-rich technology giants investing internal funds consume physical resources and change the allocation of cash among financial investment, shareholder distributions and capital spending. Internal surpluses are nevertheless different from new market borrowing, and prominently announced investment plans are not immediate cash expenditure. The AI boom can explain strong capital demand well, but cannot alone explain the full rise in long-term yields.
Governor Cook highlighted this timing gap in her September 28 speech: AI productivity gains might modestly reduce inflation over coming years but may not promptly offset construction-related price pressure. The deeper implication is that even if technology ultimately lowers unit production costs, high expected capital returns can still sustain elevated real rates. Falling inflation can coexist with rising real rates, because more efficient goods production does not necessarily reduce the price of using capital.
(2) Existing low-rate debt buffers tightening, extending expectations for high rates
The maturity structure of existing debt provides a major buffer supporting private spending. Data cited by Barr on September 23 showed roughly half of outstanding U.S. mortgages carried rates no higher than 4%, and nearly 80% were below 6%. Higher market rates initially hit new buyers, households refinancing and floating-rate borrowers. The large stock of fixed-rate loans does not immediately suffer repricing.
The same tightening therefore affects individual borrowers very differently. Marginal borrowers urgently needing funds face high financing hurdles, while households and firms that locked in long-term low rates see little immediate change in interest payments. Spending cuts by marginal borrowers spread through a long chain of slower transactions, weaker corporate orders, lower employee income and eventually higher unemployment before reaching broader groups. Aggregate resilience contains this transmission lag; it certainly does not mean every sector is comfortable at current high rates.
This imbalance also means monetary restraint cannot be assessed solely by the absolute nominal rate. A better measure compares the real policy rate, after expected inflation, with the real natural rate needed to balance current supply and demand. If capital spending, fiscal deficits and strong risk appetite have raised the short-term equilibrium rate, unchanged inflation expectations imply that existing policy rates exert much less real restraint.
Short-term equilibrium must be distinguished from the long-term central level. Current spending strength can temporarily raise the rate needed for balance without permanently increasing the long-term natural rate. Similarly, the Fed dot plot's longer-run projection cannot directly measure current restraint. September's higher real Treasury yields do not establish an equal-sized jump in the natural rate.
As old debt matures and refinancing proceeds, this buffer will eventually be depleted. Borrowers temporarily insulated may later need to refinance at higher rates, while high-return fashionable projects' continuing absorption of funds and resources crowds more rate-sensitive housing, traditional business investment and small firms. Interest is a burden for debtors but income for creditors. The net aggregate-demand effect ultimately depends on their different propensities to consume and financing constraints; higher economy-wide interest payments cannot simply be equated with an irreversible contraction in total consumption. Bond markets' higher-for-longer view explains current repricing, while signaling accumulating delayed tightening effects and distributional pressures.
(3) Strong demand and cost shocks lift expected future policy rates
Private-demand resilience determines whether energy volatility and supply bottlenecks fade or become persistent inflation. Surging energy prices both raise some final prices directly and restrain nonenergy consumption by eroding real household purchasing power. When demand is already weak, this erosion often interrupts broad price increases. With employment stable and consumption and capital spending well supported, however, firms have more scope to pass costs to customers. Local supply shocks can more readily spread into broader goods and services.
Rate increases cannot create crude oil, but the Fed can cool aggregate demand, restrain wage spirals and alter firms' pricing expectations to prevent cost pressures spreading. When external supply disruption meets resilient domestic demand, the central bank often needs more persistent real-rate restraint to meet its inflation target. Monetary policy's task is to extinguish broad inflation that is spreading and becoming entrenched, rather than focus solely on short-term energy-price swings.
Existing evidence is still insufficient to conclude that the entire U.S. economy is overheating. August industrial capacity utilization was 76.3%, 3.1 percentage points below its long-run average. September PMIs signaled rising input-cost pressure, but output-price increases remained moderate and below March-July levels. Some services firms acknowledged that intense competition limited price increases. Industrial data cannot fully represent services conditions, but they remind us that local bottlenecks do not imply nationwide exhaustion of capacity.
Strong data must therefore feed into policy through a careful sequence. First, resilient demand reduces the need for near-term cuts. Second, persistently strong hiring, ample orders and rising costs justify holding rates high longer. Only when those pressures clearly become broad, stubborn increases in core inflation does further tightening gain justification and urgency. One strong monthly survey is not enough to jump directly to that final step.
The Fed's September Summary of Economic Projections (SEP) already clearly reflected policymakers' reassessment of the tightening cycle.
| Median year-end federal funds rate | June projection | September projection |
|---|---|---|
| 2026 | 3.8% | 4.1% |
| 2027 | 3.6% | 4.1% |
| 2028 | 3.4% | 3.9% |
| Longer run | 3.1% | 3.2% |
Against a 0.1-percentage-point adjustment in the longer-run median, the 2027 and 2028 medians rose a full 0.5 percentage points. The strong signal was that officials saw a need for more persistent restraint over the coming years, rather than an equivalent structural change in long-term equilibrium. Both 2026 and 2027 year-end medians stood at 4.1%, meaning this hike came with no expectation of a rapid return to cuts. The dots are individual conditional judgments, rounded to one decimal place; using them to calculate precise probabilities for individual meetings would overinterpret them.
Recent official remarks reinforced that expectation. At the September 16 press conference, Warsh described the hike as removing some accommodation and said overall financial conditions could hardly be called restrictive. Barr later indicated further adjustments were needed under the baseline. The meeting's stance was followed by strong data. The mutual reinforcement of official views and new economic facts shattered the market's hope that current rates were already sufficient to restrain demand.
Stable long-term inflation compensation does not weaken this logic. On the contrary, confidence that the Fed will use higher real rates decisively to contain potential demand and cost pressures can anchor average long-term inflation expectations while raising the expected future short-rate path. Trust in the Fed's price-stability credibility can coexist with higher long yields. A nominal-yield rise driven largely by real rates does not mean inflation has disappeared from pricing.
(4) Persistent issuance needs buyers, and marginal demand requires higher yields
As private investment accelerates, unyielding fiscal spending leaves monetary tightening facing a more resilient base of aggregate demand. Other things equal, large fiscal deficits reduce public saving. If households and businesses do not increase saving sufficiently while private investment expands, the gap must be closed through higher real rates, additional foreign inflows or an adjustment in private spending. The greater the rigid, rate-insensitive portion of public expenditure, the more spending adjustment from rising financing costs concentrates in rate-sensitive private sectors.
As an open economy, the U.S. can cover domestic saving gaps with foreign funds. This is not a zero-sum contest over a fixed pool, nor does each additional dollar of government borrowing mechanically reduce private investment by a dollar. Foreign investors' willingness to save, demand for safe dollar assets, exchange-rate expectations and currency-hedging costs jointly determine the price of financing. International demand for dollar assets provides a valuable buffer, but cannot guarantee that bonds of any size or maturity can always be sold at previous low yields.
On August 3, the U.S. Treasury projected Q3 privately held net marketable borrowing of $739 billion, $68 billion above May's estimate. Bond markets therefore needed to keep allocating funds. Because borrowing needs included technical factors such as cash-balance management, the amount was not all new fiscal stimulus. The August 5 refunding statement then expected regular nominal coupon and floating-rate note auction sizes to remain unchanged for at least several quarters. These announcements provided no evidence of issuance suddenly expanding after the hike to explain late-September long yields.
Even fully anticipated supply can push rates higher. On September 23, the Treasury issued $70 billion of 5-year notes, unchanged from the previous auction. The bid-to-cover ratio nevertheless fell from 2.37 to 2.21, and the auction yield of 5.033% was 3.1 basis points above the 5.002% when-issued yield at the bidding deadline. The relatively difficult sale showed that, given information and positioning at the time, the same issuance size required lower bond prices and higher yields to attract buyers.
Shifts in macro expectations change how much intermediate- and long-term debt investors want to hold. Continuing new supply must be absorbed, while caution about rates staying high raises buyers' return requirements. Supply and pricing expectations interact. One auction cannot establish lasting demand exhaustion or identify withdrawal by a particular buyer group, but it does show more demanding marginal financing conditions.
Ample banking liquidity does not eliminate long-duration risk in bond markets. The September 16 implementation document said the Fed would fully roll over maturing Treasuries, reinvest agency principal into Treasury bills and could purchase short Treasuries to maintain ample reserves. There was no continuing balance-sheet runoff, so these operations were not an additional tightening force. Arrangements centered on short assets did not mean the central bank was absorbing long-duration price risk for markets. Ample reserves can coexist with the need for higher long yields to attract buyers.
(5) Weaker long-bond hedging value may require a higher term premium
Long yields can keep rising even if average expected future policy rates stop changing. Locking in years of cash flows necessarily exposes investors to inflation, interest-rate and price risks. Required compensation depends on the economic circumstances in which those risks arise and investors' capacity to withstand drawdowns.
When the main macro risk is contracting demand, earnings and equities tend to weaken while expectations of cuts support Treasuries, making long bonds useful hedges. If the primary risk shifts to costs and supply shocks, profits may suffer while inflation limits the central bank's ability to cut, leaving equities and long bonds under pressure together. If long bonds offer less protection precisely when investors need it most, the required term premium may increase.
Higher risk compensation is therefore more than simply greater pessimism. What matters is the correlation of bond returns with the economy and losses on other assets, and how much duration intermediaries will bear. With both private investment and government financing active, portfolio reallocation and dealers' inventory costs may rise, amplifying long-term risk pricing. Model estimates of higher term premiums fit these mechanisms, but do not permit precise attribution to any single risk.
Several forces behind this Treasury-yield rise are clear. The gap between willingness to spend and the arrival of new supply led markets to raise their assessment of the restraint needed for balance. Persistent fiscal issuance added absorption pressure. Cost disruption and uncertain rates led investors to demand more risk compensation for long fixed cash flows. These forces transmit through expected short rates and term premiums, interacting and reinforcing one another rather than operating independently.
3. Historical comparisons and the outlook: the turning point depends on how rebalancing occurs
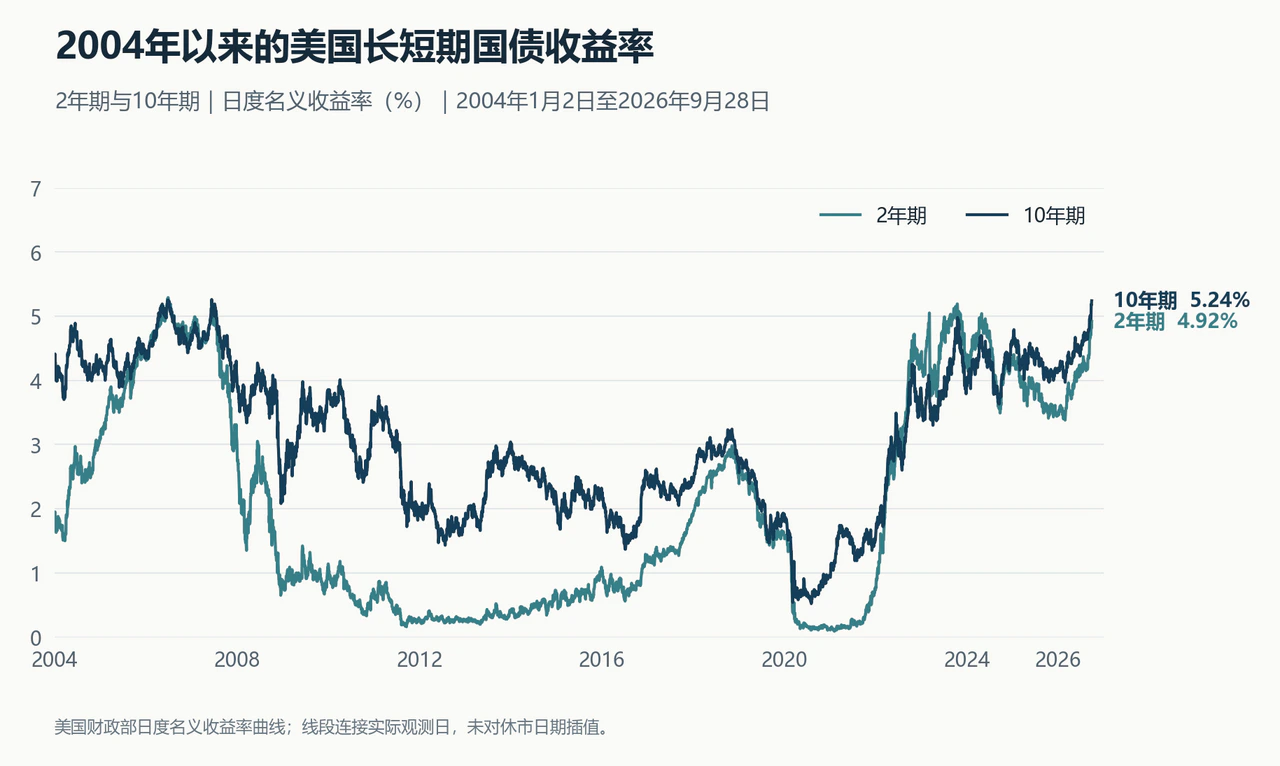
2004-2005 offers a historical comparison in the opposite direction. In February 2005, then-Chair Greenspan noted that long rates had fallen over preceding months despite 150 basis points of cumulative Fed hikes. Bernanke's global-saving-glut explanation that year emphasized that foreign saving and inflows could depress long-term U.S. real rates. It was not a sole explanation of every price move, but highlighted a condition: policy hikes can coexist with lower long yields when capital demand is supported by abundant saving and asset demand.
This history limits the crude inference that hikes must raise long yields and offers a test for current judgments. If private capital spending keeps strengthening without a corresponding rise in global saving and demand for long dollar bonds, real rates and term premiums face more upward pressure. Sufficient foreign inflows could instead ease yield pressure. Today's rising yields alone do not prove a permanent reversal in global saving structures.
2023 shows that stopping hikes does not automatically end upward momentum in long rates. The final hike in that cycle came on July 26. From then to October 19, the 10-year yield rose 112 basis points from 3.86% to 4.98%, while the 2-year rose only 32 basis points and the curve steepened sharply. Subsequent Fed research found that several models attributed much of the rise to surging term premiums, against a background of large Treasury issuance, quantitative tightening and economic uncertainty.
By the end of 2023, however, the 10-year yield had fallen back to 3.88%. Slowing economic and inflation data, revised issuance expectations and changing policy communication accompanied the reversal, showing that falling long rates require more than a decision to stop hiking. In the current episode, short and long yields rose more nearly together and balance-sheet arrangements differed. The observation windows also differ in length, preventing mechanical comparisons of magnitude, pace or reversal timing. The lesson is to track both the policy-rate path and long-term risk compensation, rather than wait for only one to fade.
The outlook depends on how demand expansion, supply improvement and financing constraints interact. Three main potential rebalancing paths follow from the economic mechanisms, each implying a different interest-rate trajectory:
| Rebalancing path | Key change | Implications for policy and bonds |
|---|---|---|
| Demand cools gradually | Consumption, hiring and investment slow, with sustained moderation in core prices | Less need for further hikes allows the expected policy path to move lower; the size of any long-yield decline still depends on term premiums |
| Productivity and capacity improve | Investment becomes effective supply, unit costs fall and demand no longer continues to outgrow supply | Inflation can decline while growth stays resilient; less additional restraint is needed, but high capital returns may still sustain elevated real rates |
| Financing constraints emerge faster | Refinancing costs rise, project returns disappoint, and credit and capital spending contract | High rates become a clearer growth burden; short yields may price a policy shift first, while long yields remain influenced by risk compensation |
The first path requires demand and core prices to cool together. A one-off oil-price decline or weak survey can temporarily relieve pressure without reversing pricing of the policy path over future years. Even if upward revisions to rate expectations pause, continued fiscal issuance and compensation for long-bond risk may keep long yields from falling quickly.
The second path is more favorable for the economy and easiest to misread. If AI investment gradually generates productivity gains and new capacity eases price pressures, the Fed can reduce the additional restraint needed to contain excess demand. But if expected capital returns remain high and investment opportunities abundant, the real rate balancing saving and investment need not return to past lows. Inflation returning to target does not require a simultaneous sharp fall in long-term real rates.
The third path reveals vulnerabilities beneath current resilience. Old fixed-rate liabilities delay tightening's effects but cannot remove concentrated refinancing pressures. High expected project returns support current spending but depend heavily on promised future revenue materializing. Once all-in financing costs approach or erode the minimum acceptable return, businesses delay investment and reduce hiring, and households cut rate-sensitive spending. In the worst case, if growth stalls while aversion to long-bond risk stays elevated, actual financial tightening in the real economy will be much harsher than the benchmark rate alone suggests.
For the Fed, distinguishing the source of rising yields is essential. A rise driven by stronger demand often accompanies a higher short-term equilibrium rate and does not necessarily mean existing restraint is sufficient. A rise independently driven by risk compensation raises financing costs without stronger demand and is more likely to substitute for some future tightening. Converting every long-yield increase mechanically into an equivalent number of hikes overlooks their different effects on growth and inflation.
Assessing these constraints requires tracking the total financing costs actually paid by firms and households, debt maturities, bank lending standards and subsequent investment and hiring. Temporarily stable credit spreads do not mean real-economy financing costs are unchanged: higher risk-free benchmarks can directly lift new bond and loan pricing. This transmission chain connects asset-market performance with actual cash flows.
The better-supported current judgment is that bond markets have systematically raised the required pricing of policy restraint over coming years and of long-term risk compensation. Declaring a permanent high-rate era would require sustained delivery of capital spending, significant gains in productivity and capital returns, changes in saving and more persistent shifts in long-bond demand. A higher short-term equilibrium rate, transmission lags and a higher long-term potential natural rate can produce similar prices for a time, while having very different long-term consequences.
Whether rates peak ultimately depends on whether the demand and risks to which high rates respond begin to fade. If private spending keeps outpacing supply expansion, high rates retain an economic foundation. If productivity allows supply to catch demand, inflation can fall smoothly while real rates remain relatively high. If financing costs erode investment returns first, downgrades to growth expectations will reverse policy expectations. September's bond market raised its requirements for capital returns and risk bearing. The next stage must establish how the real economy completes its adjustment.


