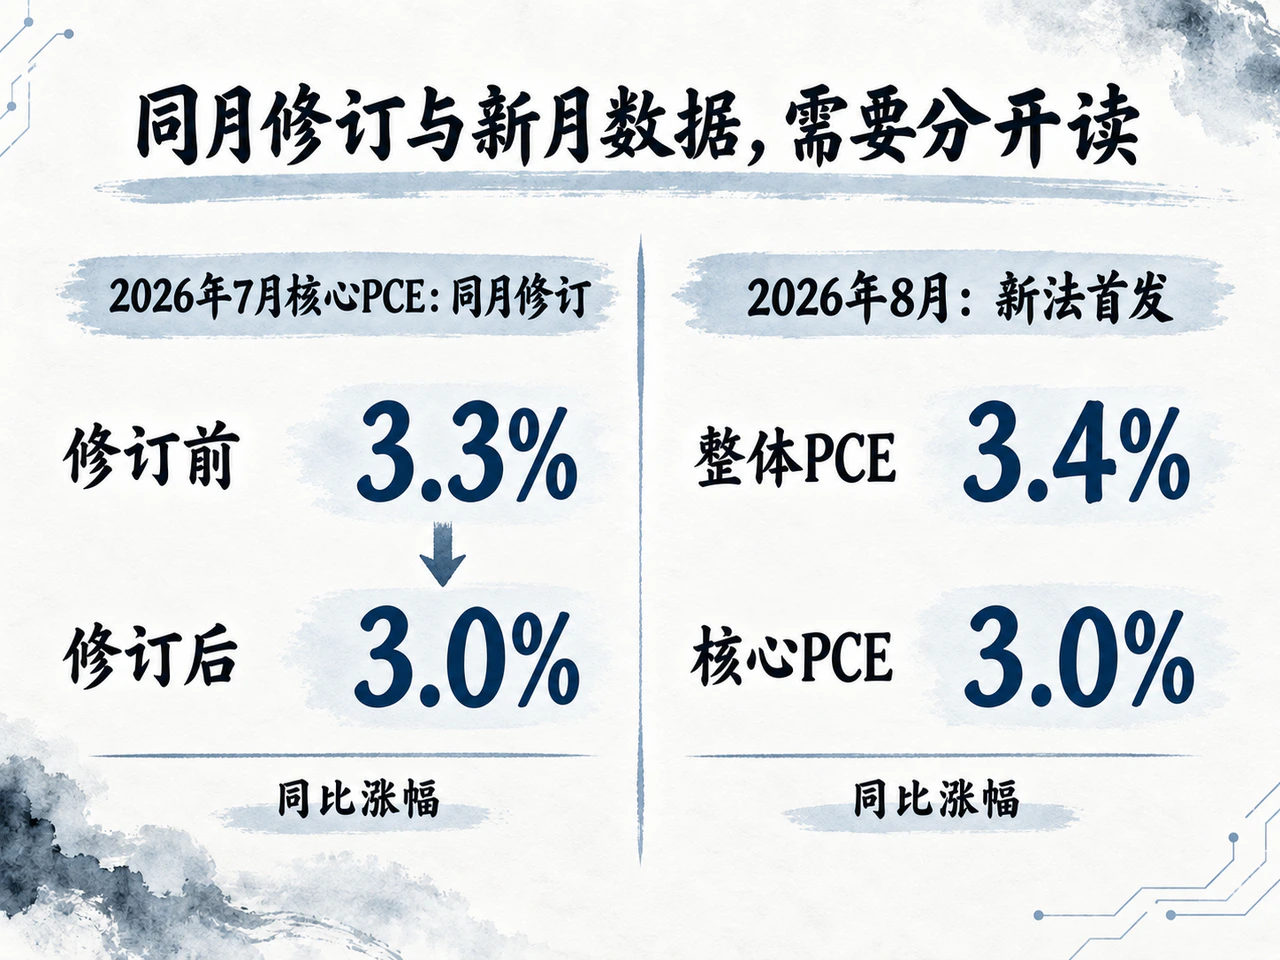
US inflation readings were materially recalibrated in the September 30 annual statistical revision. Data released by the Bureau of Economic Analysis (BEA), part of the Commerce Department, lowered July's year-on-year core personal consumption expenditures (PCE) price increase from the previously reported 3.3% to 3.0%. August core PCE, released for the first time that day, was also 3.0% year on year and 0.2% month on month; headline PCE was 3.4% and 0.3%, respectively. These data primarily reshaped the market's understanding of historical inflation, rather than indicating a sudden disappearance of August price pressure.
BEA implemented the changes, while the Federal Reserve is a data user, research participant and monetary policymaker. Clarifying these roles is essential to assessing objectively how much actual policy space the revisions create and what they mean for the central bank's ongoing framework reforms.
The central judgment is that more accurate inflation measurement can meaningfully reduce the risk of excessive Fed tightening, but a one-time downward revision is far from sufficient to establish that prices have returned to sustained disinflation. Policy still depends on the durability of the revised medium-term trend, marginal labor-market changes and the anchoring of inflation expectations. The true value of statistical and framework reforms depends on whether the new methods withstand a full macroeconomic cycle.
1. Three component methodologies rebuilt: the 2% inflation anchor is unchanged; core revisions correct measurement
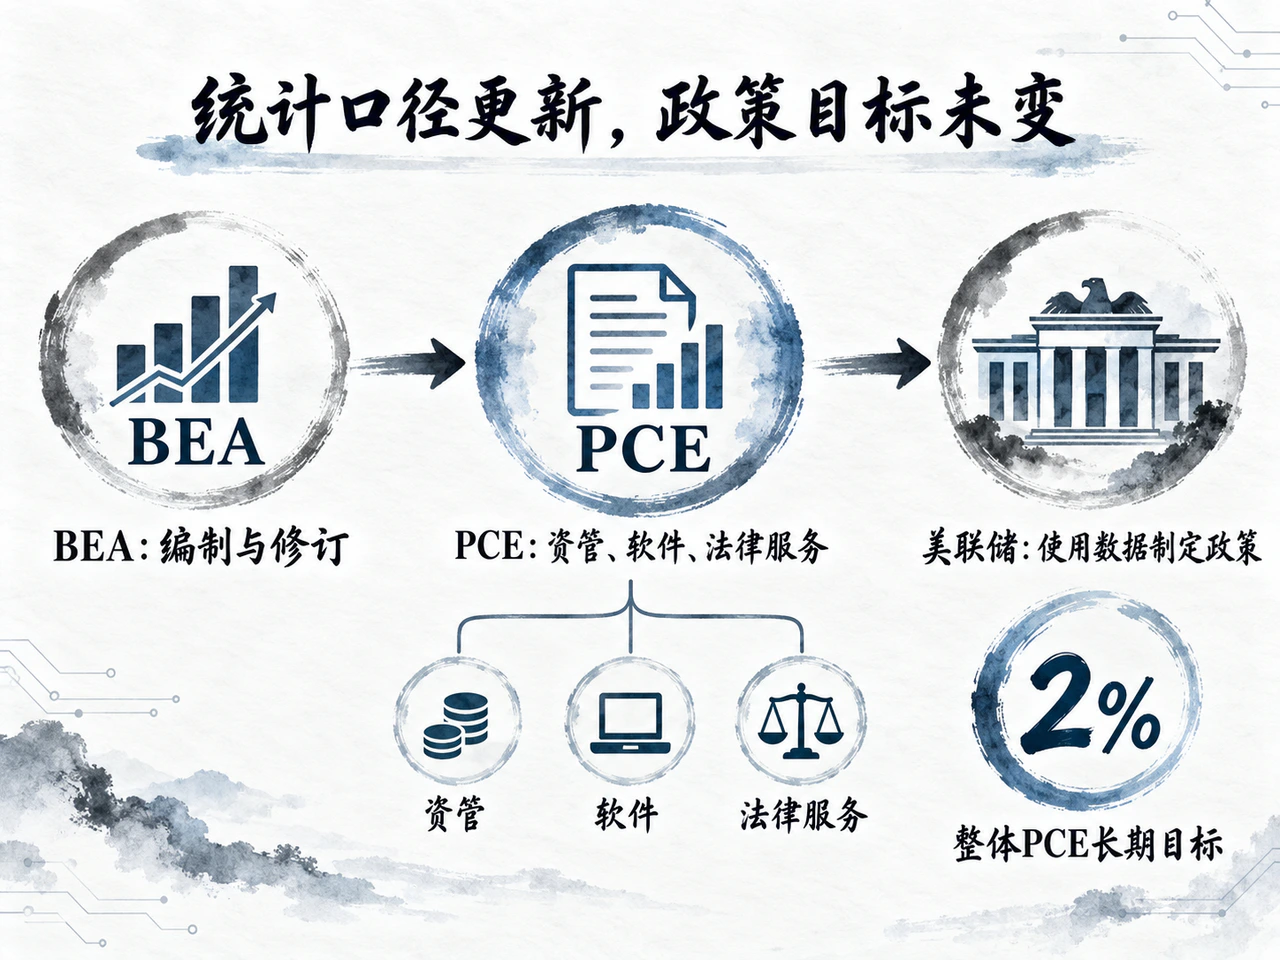
BEA's revisions mainly changed price or quantity estimation methods for asset management and investment advice, legal services, and computer software and accessories. The statistical agency neither removed these expenditures from the basket nor changed the accounting objective of aggregate PCE. Core PCE remains a measure for tracking underlying trends after excluding food and energy.
The annual update also incorporated new underlying information, including personal-income and service-sector surveys, and comprehensively recalculated seasonal adjustment factors. Monthly income and expenditure revisions extended back to January 2021. Differences between old and new readings therefore reflect a systematic re-estimation, rather than a change to a single formula.
In accounting terms, PCE measures price changes in household consumption and consumption paid on households' behalf, including third-party payments for health care. Detailed components rely heavily on weighted aggregation of external measures such as the consumer price index (CPI) and producer price index (PPI). The reform's central task was to correct mismatches between those external price measures and the consumption being measured.
The Fed's long-run 2% inflation target applies to the annual change in headline PCE. Core PCE filters short-term disturbances to identify medium-term trends. Equating a single downward revision in core PCE with a precisely quantified narrowing of the policy-target gap conflates two separate distinctions: headline versus core, and a point-in-time reading versus a medium-term trend.
2. Asset-management prices are inferred from hours worked, smoothing excessive volatility but retaining input-method limitations
Asset-management services lack a standard physical unit of measurement. Management fees reflect assets under management, fee structures and customer segments. In a bull market, asset values and total fees often rise together without a proportional increase in the work actually delivered by investment advisers. The measurement challenge is to divide nominal fee growth appropriately between a rise in real services and a pure increase in service prices.
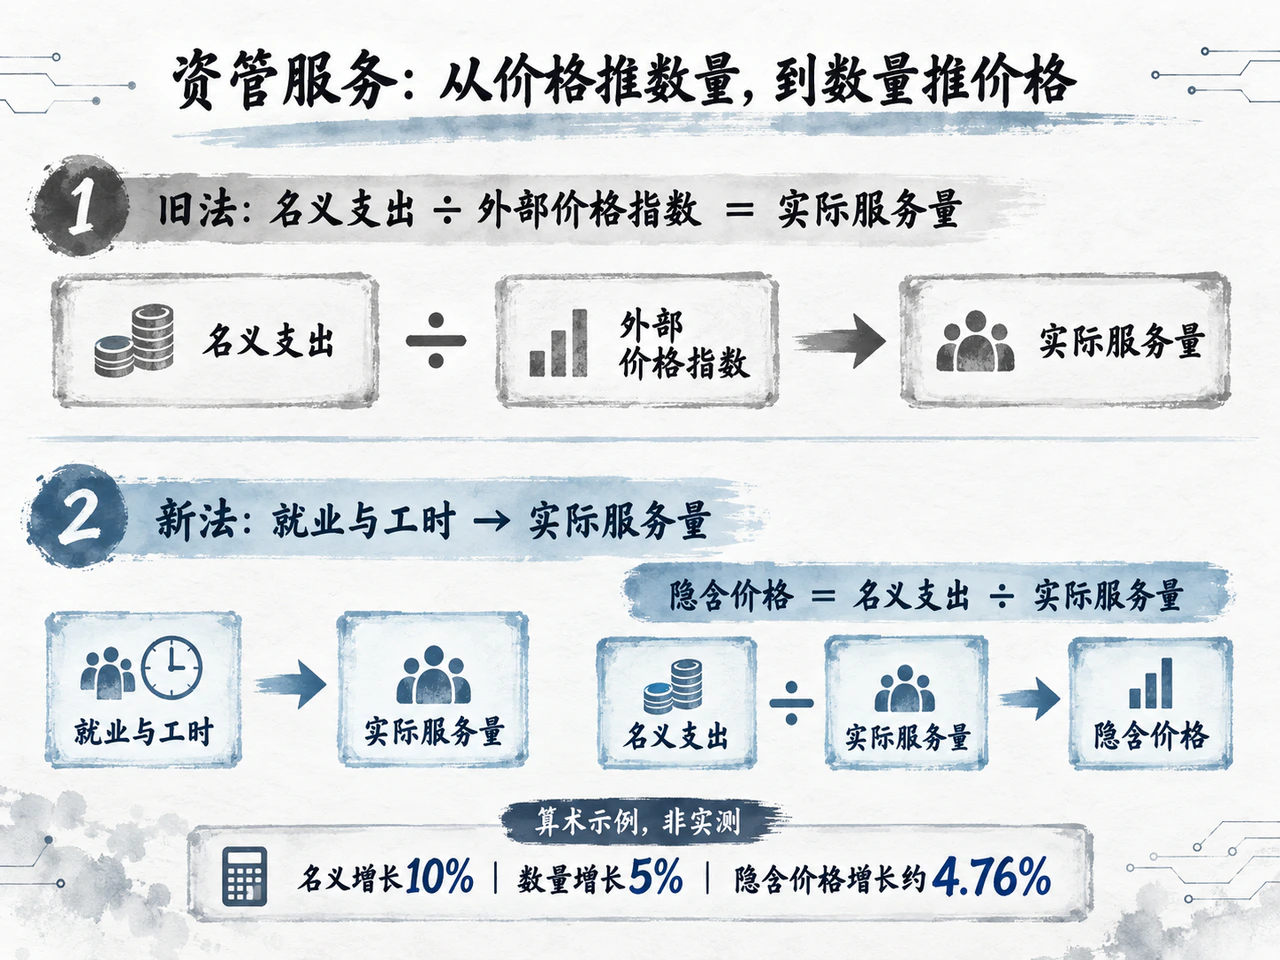
The old method used price deflation: nominal expenditure was estimated from Census Bureau industry revenue data, then deflated by the asset-management and investment-advice PPI to derive real consumption:
Old method: real service volume = nominal expenditure ÷ external price index.
BEA's technical explanation said revenue and that PPI should theoretically both reflect net asset values and fee trends. In practice, however, they often diverged, producing large fluctuations in inferred real service volumes that were disconnected from industry fundamentals.
The new method infers prices from quantities. Industry employment and hours in the Bureau of Labor Statistics (BLS) Current Employment Statistics (CES) are used to extrapolate real service volume directly. Nominal consumption still relies on Census data, and the price index is derived from the two:
New method: first estimate real service volume from employment and hours, then derive the implicit price = nominal expenditure ÷ real service volume.
An arithmetic example illustrates the approach. If nominal expenditure on a service grows 10% and the new quantity indicator shows hours and service volume growing 5%, the implicit price increase is approximately 4.76% (1.10 ÷ 1.05 − 1). Independently estimating service volume identifies how much of a nominal fee change corresponds to actual work delivered, allowing the pure price movement to be inferred.
This does not mean rising equity markets are now disconnected from PCE. If fee growth driven by asset appreciation exceeds growth in service hours, implicit prices will still rise. The new method addresses technical distortion in separating quantities and prices; it does not impose low financial-services inflation by design.
The new method has methodological limits of its own. Employment and hours are inputs, not fully equivalent to final output. If financial technology and automation allow the same staff to serve more assets and clients, and the input model fails to capture total-factor-productivity gains adequately, real service volume may still be understated and implicit prices overstated. Conversely, hiring without effective output growth would overstate service volume and understate inflation. Initial estimates also still rely on market models until final Census data arrive, so the new algorithm cannot eliminate subsequent revisions to monthly preliminary readings.
3. Correcting software basket mismatch and replacing legal-services CPI with PPI improve representativeness
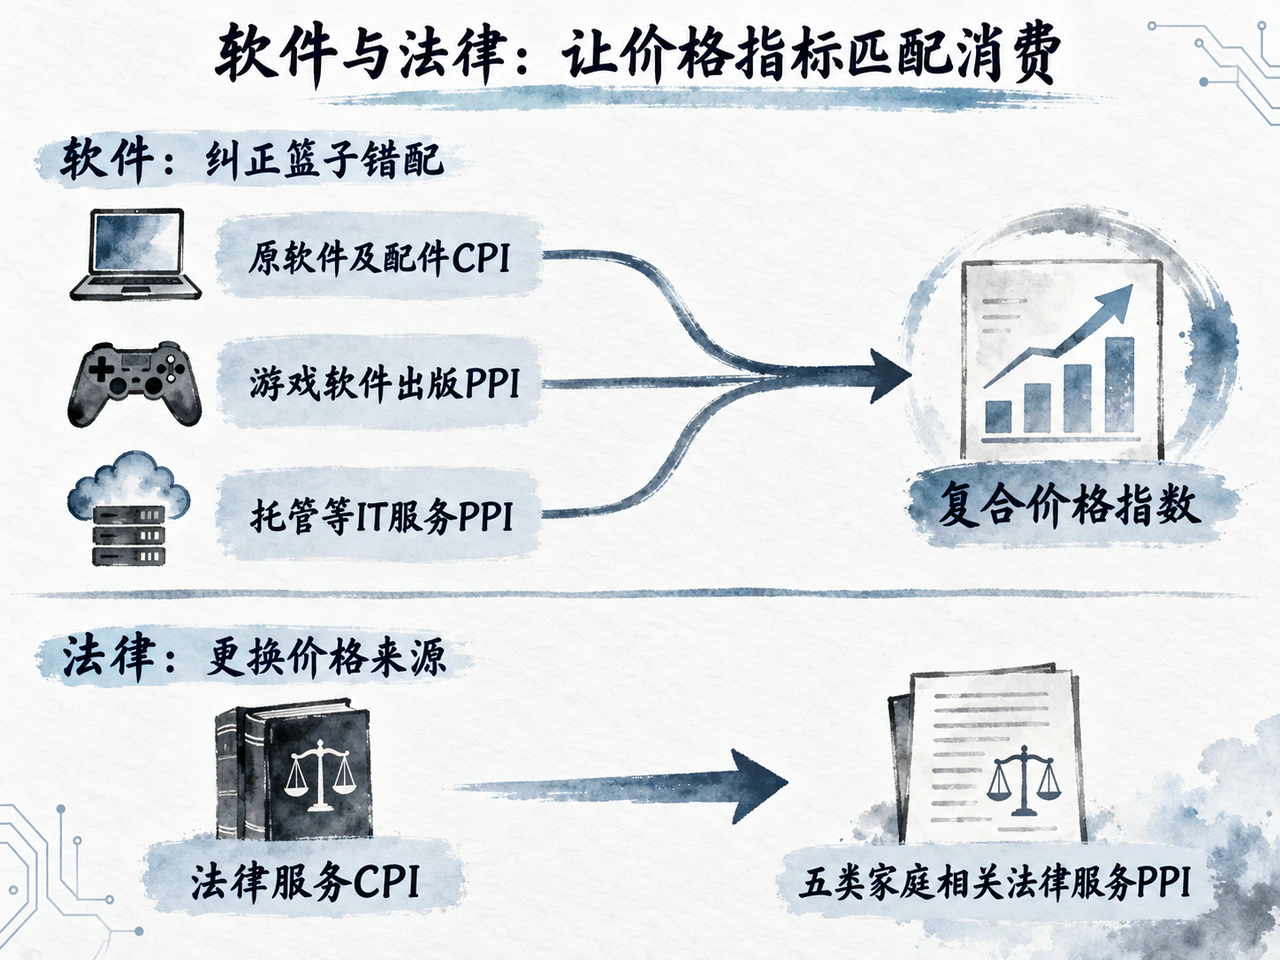
The key software problem was a mismatch between the price index and the consumption basket. The computer software and accessories CPI, previously used as the sole deflator, included physical accessories such as flash drives and blank media that were absent from the corresponding PCE category. At the same time, it inadequately represented the modern software and cloud-application services covered by PCE.
When physical storage-media prices moved unusually because of factors such as rising storage demand, applying the old CPI alone imported unrelated accessory-price fluctuations into software consumption. BEA has upgraded price tracking to a composite weighted index: retaining the original computer software and accessories CPI while adding the game-software publishing PPI and a PPI combination covering hosting, application provision and other IT infrastructure services. Weights are assigned from benchmark input-output tables to correct the basket mismatch and improve representation.
This is a precise measurement correction, not evidence that software price pressure was merely a statistical mistake. Higher software subscription charges, surging compute costs and changes in industry competition remain real sources of price pressure.
A Fed simulation study dated May 22 offers a sense of scale. Over the four-month annualized period from November 2025 to March 2026, software contributed approximately 0.66 percentage points to core PCE inflation. Correcting the basket mismatch alone could reduce that estimated contribution to 0.50 percentage points, lowering annualized core PCE inflation from 4.38% to 4.22%. This was a model scenario for a specific period, not a direct estimate of the September annual update's reduction in year-on-year inflation. BEA's implemented composite index is also a different level of reform from the study's discussion of AI functionality, evolving subscription models and quality adjustment, which discounts quality premiums.
The legal-services change was more straightforward. The old CPI had not been publicly released for most of the period since 2023, with its last public release in September 2024. The unpublished figures BEA subsequently used failed BLS publication-quality standards and recently showed anomalous moves that could not be verified.
BEA therefore adopted a composite of five household-related legal-services PPIs, covering civil negligence, wills and estate planning, real estate, labor and employment, and other legal services, applied retrospectively from 2024. The aim is to restore source-data compliance and representativeness. The direction of revision depends on the data and does not inherently imply lower inflation.
4. Component weights and base effects combine: core PCE falls about 36 basis points, while real consumption levels are re-estimated at given nominal spending
Price changes in the three components feed into the aggregate index through their consumption weights. As a first-order approximation, a component's contribution to the inflation revision equals its weight multiplied by its own revision. For example, a 10-percentage-point downward revision to a component with a 2% weight lowers the aggregate reading by about 0.2 percentage points. In actual accounting, PCE uses a chain-weighted index, so changing weights also affect true contributions.
Year-on-year readings are also subject to base effects: the current index is compared with the same period a year earlier. If the historical base and current index are lowered by the same proportion, annual inflation is unchanged. Only different proportional adjustments at the two endpoints shift year-on-year inflation. A lower absolute price level, a downward revision to annual growth, and cooling recent monthly inflation are therefore distinct.
The published data show the following:
- July core PCE year-on-year inflation was revised from 3.3% to 3.0%, a revision to the same month across two data vintages. August core PCE of 3.0% year on year and 0.2% month on month was the first reading under the new methodology. Directly subtracting July's old 3.3% from August's new 3.0% and calling it monthly contraction is a classic error of mixing measurement bases.
- Reuters estimated that methodology changes cumulatively reduced core PCE inflation by about 36 basis points, more than the previously expected 20–30 basis points. Official readings are rounded to one decimal place, so their differences need not precisely equal such estimates. Without official component-by-component bridging data, the estimate should not be mechanically allocated across components or treated as a proven total measurement error.
- Over a longer horizon, BEA reported average annual headline PCE inflation of 4.0%, unchanged, from the fourth quarter of 2020 through the first quarter of 2026, and core inflation of 3.8%, revised down just 0.1 percentage points. Large revisions to particular recent months therefore cannot be extrapolated into a major reduction in the medium- and long-term inflation norm.
The revised August data still showed headline PCE inflation at 3.4% year on year, core at 3.0%, and real personal consumption expenditures up 0.6% month on month. Final demand remained resilient and headline inflation had not returned to the 2% target. Assessments should focus on successive monthly changes measured on a consistent basis.
National accounts also have a mirror effect: given nominal expenditure, a lower deflator mechanically raises the estimated level of real consumption. Whether real consumption growth rises depends on whether the comparison base is revised proportionally. This accounting change from statistical re-estimation does not mean households suddenly bought more on the release date. Treating it and lower inflation as two separate new positives would double-count the same information.
5. The threshold for Fed cuts is unchanged: revisions reduce the urge to hike, but a pivot still requires trend confirmation
If earlier statistics overstated inflation persistence, recalibration under the new methods is valuable for policy. A mechanically narrower inflation gap can reduce the urgency of further catch-up hikes and give the Fed more room to observe.
Monetary policy, however, rests on the balance between prospective inflation and employment risks, not a mechanical offset to historical statistical revisions. A downward revision of several dozen basis points does not translate into the same amount of room for rate cuts. An ex-post real rate calculated by subtracting revised inflation from the nominal rate cannot replace assessments of forward-looking real rates and overall financial conditions.
An important practical example is the September 16 FOMC meeting, after BEA announced its revision plan but before the revised data were released. The Fed still unanimously raised rates by 25 basis points to a 3.75%–4.00% target range. Sensible statistical improvements can clearly coexist with a firm tightening stance; a measurement change cannot be read directly as dovish central-bank endorsement.
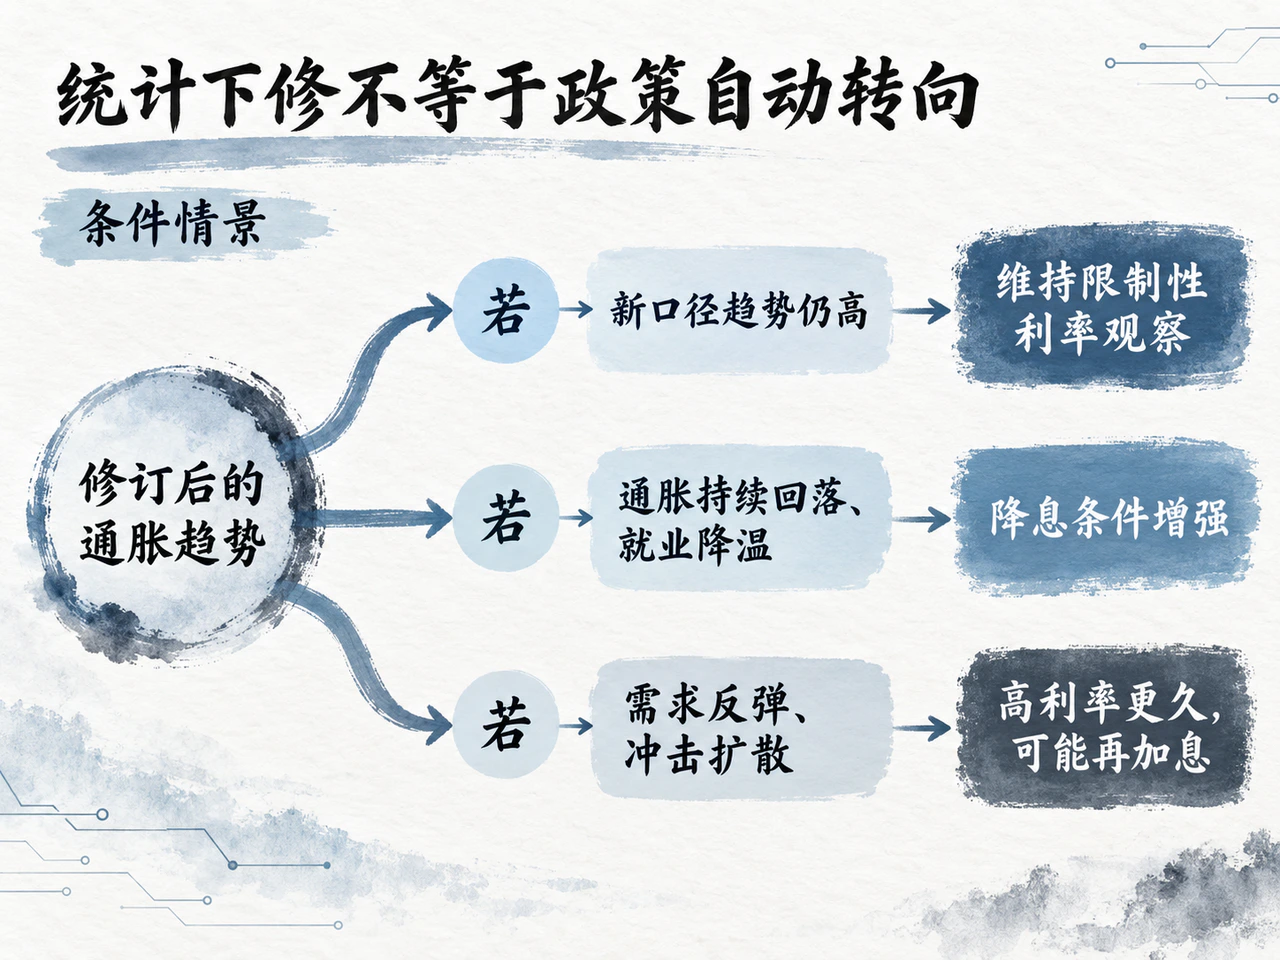
The future policy-rate path can be considered under three scenarios:
- Scenario 1: historical data fall, but monthly inflation under the new method remains high. If revisions mainly correct historical measurement while recent three- and six-month annualized inflation still deviate from 2%, policymakers are more likely to slow their actions and hold restrictive rates while observing. A hiking pause buys time to confirm the trend; it does not itself begin a cutting cycle.
- Scenario 2: revisions coincide with cooling fundamentals. If revised inflation shows sustained, stable downward momentum, alongside a narrowing wage–productivity gap, easing nonhousing core-services price pressure and marginal cooling in labor demand, statistical recalibration and actual disinflation corroborate each other. Only then do the conditions for ending hikes, or even beginning cuts, truly mature.
- Scenario 3: inflation reverses or external shocks spread. If final consumption strengthens again, or energy and commodity fluctuations spread into a broader range of goods, services and inflation expectations, the Fed will keep rates high for longer despite lower historical readings, and may retain the option of another hike. Statistical revisions cannot erase new supply-demand imbalances.
Subsequent monitoring should focus on the breadth of price declines on a consistent measurement basis and the alignment of labor costs with inflation expectations. Isolated volatility in asset management, software and other components should not dominate the macroeconomic narrative guiding policy judgments.
6. Deepening statistical reform: move from inputs toward output identification while maintaining credible two-way testing
The PCE methodology changes intersect closely with the Fed's own institutional reform agenda, but statistical improvement and policy governance are parallel processes without administrative subordination. At his June 17 press conference, Fed Chair Warsh announced five working groups covering communication, the balance sheet, data, productivity and employment, and the inflation framework. He reiterated that the 2% long-run inflation target was outside the review's scope.
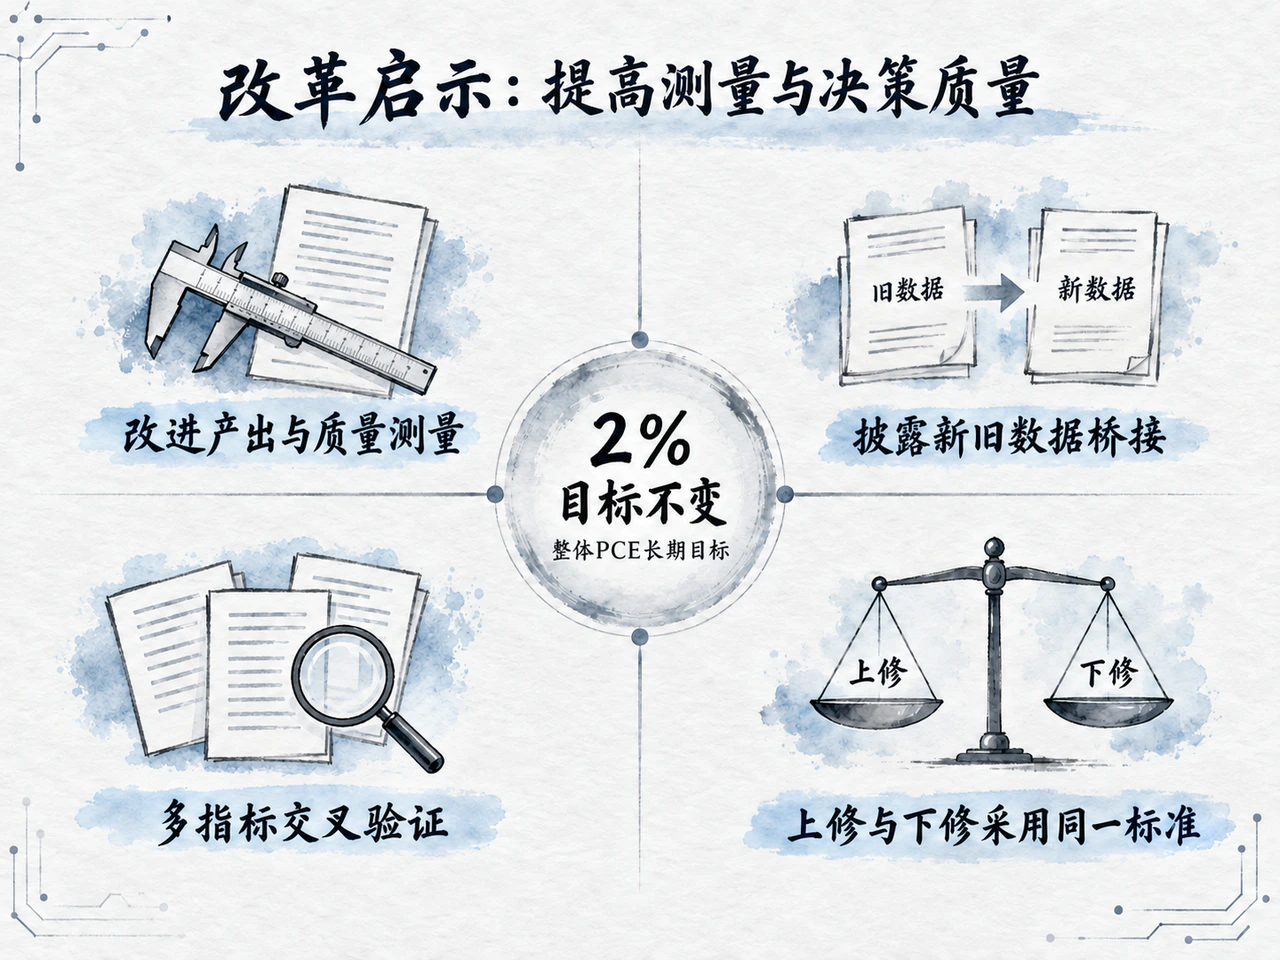
The reforms therefore concern how the central bank observes economic change and supports its decisions. As the economy shifts toward deeper financial intermediation, software subscriptions and AI applications, traditional statistics increasingly struggle to distinguish nominal fees, real output and better service quality. The PCE revisions offer four institutional lessons:
- Deepen the identification of output and quality beyond input measures. Extrapolating asset-management services from hours and employment smooths anomalies, but ultimately needs micro-level output data such as client numbers, transaction frequency and functionality tiers. Similarly, assessments of AI across industries cannot simply translate model benchmark scores into economy-wide productivity dividends or lower inflation.
- Improve disclosure bridging old and new data vintages. An ideal official release would provide more than revised final figures. It would separate contributions from replacement price sources, quantity extrapolation, updated surveys, seasonal adjustment and weights. Greater transparency around measurement changes enables markets and researchers to distinguish statistical noise from macroeconomic trends and helps avoid abrupt shifts in policy communication.
- Cross-check multiple indicators to prevent reliance on one measure. The framework should anchor its long-term objective in headline PCE, identify momentum using core PCE, trimmed-mean measures and diffusion indices, and use labor-market conditions and inflation expectations as additional boundaries. A multi-indicator system means explaining disagreements publicly and guiding trade-offs, rather than selecting convenient data.
- Preserve neutrality and symmetry in statistical recalibration. Statistical improvements must apply the same standards to upward and downward revisions. BEA and BLS uphold data-compilation standards, while the Fed conducts research, testing and policy responses. Methodological redesign must serve objectively better measurement, never become an expedient tool for a preferred rate decision.
PCE revisions give the Fed a better tool for separating measurement error and calibrating tightening. The deeper lesson is that decision quality and long-term credibility can be fundamentally strengthened only by bringing data closer to economic reality, recognizing measurement uncertainty in policy, and subjecting methodological improvements to continuous, transparent and symmetric testing across the cycle.


