In the third quarter of 2026, Treasury yields and U.S. stocks rose together in a seemingly counterintuitive move. The 10-year yield climbed 85 basis points from 4.44% to 5.29%, lowering existing bond prices, while the S&P 500 rose from 7,499.36 to 7,651.54, a 2.03% price gain. Risk-free rates above 5% normally intensify gravity on equity valuations, yet the market proved unusually resilient. This can create the impression that the negative relationship between risk-free rates and stock valuations has stopped working.
The discounted-cash-flow model has not failed. More precisely, the macro forces raising long yields are also strengthening expectations for corporate earnings in the numerator. Strong end demand and large AI infrastructure investment directly lift key supply-chain profit expectations while expanding demand for credit and savings capital, raising its opportunity cost. Bonds and stocks respond to different variables within that expansion: fixed income requires higher nominal and real returns, while equities share growing nominal cash flows.
The earnings offset already shows fragile limits. In September the S&P 500 price index fell 0.45% as the 10-year yield jumped 54 basis points, suggesting the speed of rate increases was beginning to restrain stocks. Recent JPMorgan Private Bank, BlackRock and UBS research identifies resilient growth and earnings as a key cushion, without implying equities can escape high funding costs indefinitely.
1. Discount rates versus cash flow: Why rates rise matters more than the rise alone
Understanding jointly rising yields and share prices starts with their fundamentally different claims on income.
Ordinary government bonds promise fixed nominal cash flows. Stronger growth cannot increase an outstanding bond's coupon, but can raise investors' required opportunity return, lowering its price and lifting its yield. Equities instead represent residual claims after wages, procurement, debt interest and taxes. If growth raises revenue and free cash flow, shareholders' potential returns increase.
In asset-pricing models, intrinsic equity value equals discounted future cash flows. The required return combines the risk-free rate and equity risk premium (ERP). Higher Treasury yields mechanically raise the risk-free component, but do not alone determine stock-price direction.
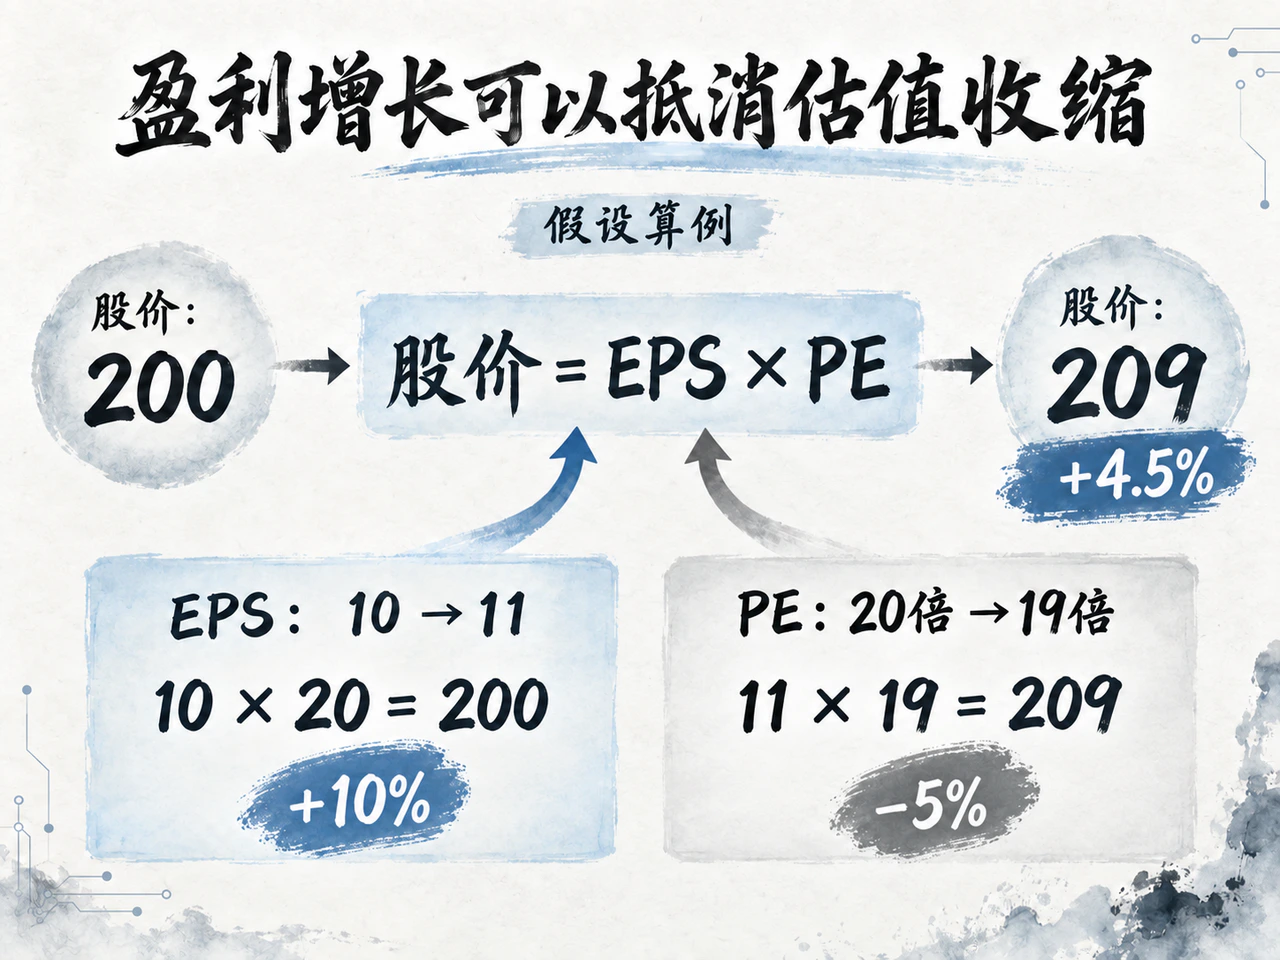
A simple example illustrates the offset. If expected EPS rises 10% from 10 currency units to 11 while forward PE falls 5% from 20 times to 19 because of rates, the share price still rises from 200 to 209, or 4.5%. Faster earnings growth can absorb multiple compression.
More fundamentally, market interest rates are endogenous to the economy rather than an isolated external shock. Stronger aggregate demand and expected capital returns can lift both profit forecasts and medium-term policy-rate pricing. Rates rising with stocks therefore need not mean high rates stimulate stocks: a resilient economy and industrial investment cycle are their common upstream drivers.
Risk premiums also adjust the offset. If improvement reduces extreme recession and default fears, investors accept lower ERP; the total discount rate need not rise proportionately with risk-free rates. Conversely, harmful inflation from supply shocks or fiscal deterioration can raise both the risk-free rate and ERP. The macro cause of rising rates thus explains more than the isolated observation that rates are rising.
2. FactSet third-quarter EPS estimates rise 1.4%, absorbing valuation pressure
The clearest recent micro evidence of equity resilience is the divergence between fundamentals and valuation multiples.
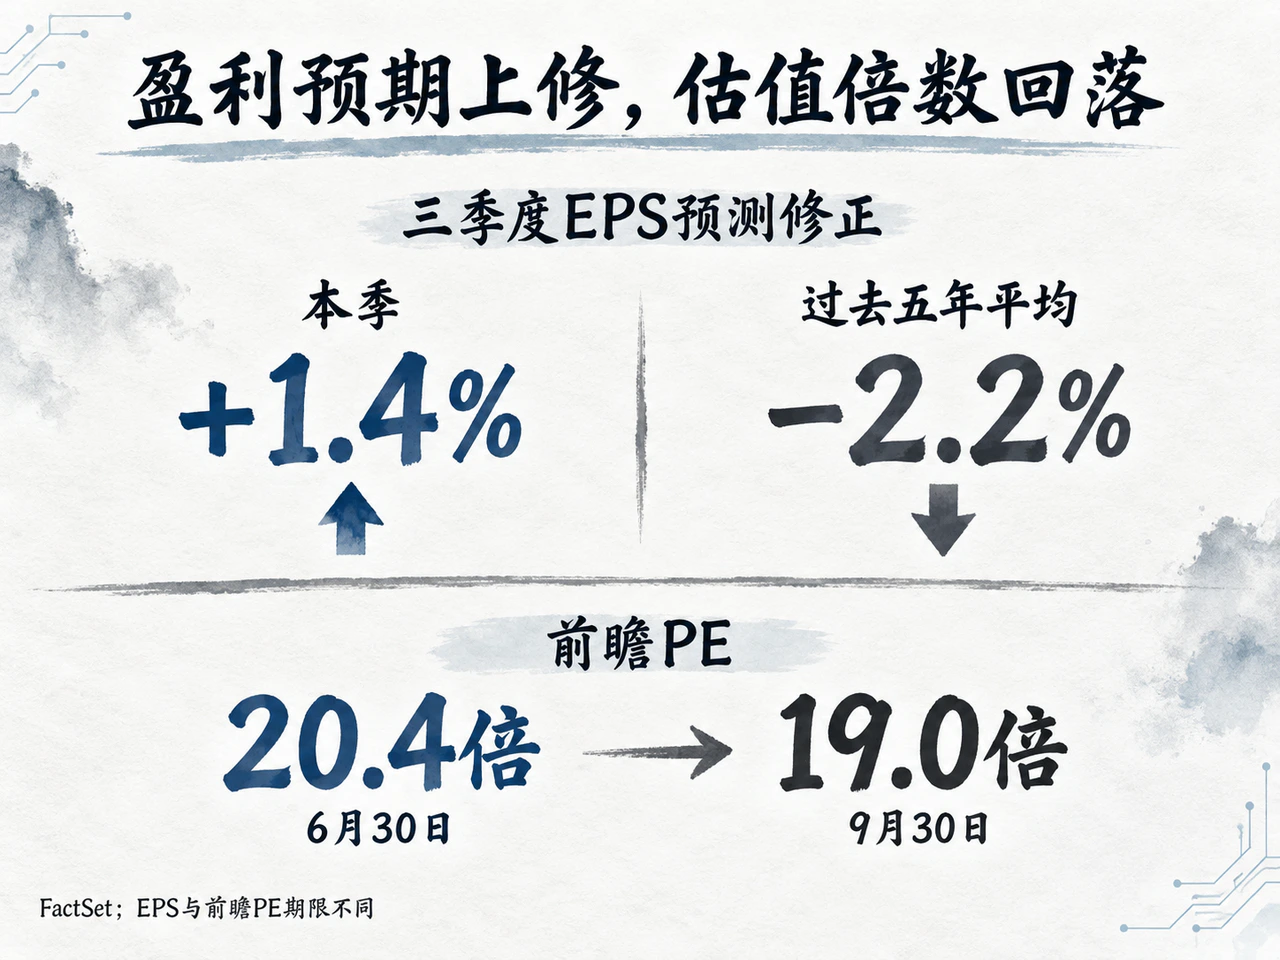
FactSet's October 2 third-quarter earnings preview showed analysts raising S&P 500 third-quarter EPS estimates 1.4% between June 30 and September 30. The five-year average was a 2.2% in-quarter cut, making the upgrade substantively meaningful. Meanwhile, next-12-month forward PE fell from 20.4 at June-end to 19.0 at September-end.
| Core measure | June 30, 2026 | Latest observation | Nature of change |
|---|---|---|---|
| Expected S&P 500 third-quarter earnings growth, year on year | 26.7% | 29.5% (October 2) | Upgraded 2.8 percentage points against the usual pattern |
| Expected S&P 500 third-quarter revenue growth, year on year | 10.9% | 12.3% (October 2) | Upgraded 1.4 percentage points, indicating firm demand |
| S&P 500 next-12-month forward PE | 20.4 times | 19.0 times (September 30) | Valuation compresses by 1.4 multiple points |
The data show resilience grounded in earnings upgrades offsetting valuation declines. Investors were using stronger revenue and profit expectations to bridge valuation discounts rather than blindly ignoring rate risk. Single-quarter EPS forecasts and rolling-12-month PE cover different periods and cannot be multiplied for an exact decomposition; multiple pressure also cannot be attributed solely to rates, though the macro directions align.
JPMorgan Private Bank's September 18 report said rising real yields continued pressuring valuations, but strong profit momentum supplied a crucial cushion. UBS's October 2 commentary argued equities can absorb moderate rate rises while the economy is resilient; a sharp growth slowdown, however, would quickly make today's high absolute rates damaging.
Profit quality is also crucial. FactSet previously noted investment valuation gains boosting second-quarter reported profits at some large technology weights, so the 29.5% third-quarter growth forecast still needs rigorous operating-cash-flow validation.
For example, in Microsoft's quarter ending June 30, 2026, revenue grew 18% year on year to $90 billion, operating profit 18% to $40.6 billion, and operating cash flow 30% to $55.4 billion. Such leaders have real cash backing rather than depending entirely on distant discounted expectations. A few giants do not represent all business, but their market-cap weight provides a substantial index anchor.
3. Ten-year TIPS rises 73 basis points: Observed real rates and capital investment
Earnings upgrades explain how equities withstand high rates; the deeper question is why both rose during the third quarter.
The theoretical natural real rate, r*, balances intended savings and investment. Assuming available savings and external inflows do not increase correspondingly, many projects with high expected returns—computing data centers, power infrastructure, chipmaking and grid expansion—tend to raise the equilibrium capital price. High funding prices then screen and allocate resources. This theoretical investment-return mechanism is distinct from observed real yields, which also reflect term compensation, liquidity premiums and expectations.
The 10-year Treasury yield can be decomposed as follows:
| Core 10-year Treasury measure | June 30, 2026 | September 30, 2026 | Third-quarter change |
|---|---|---|---|
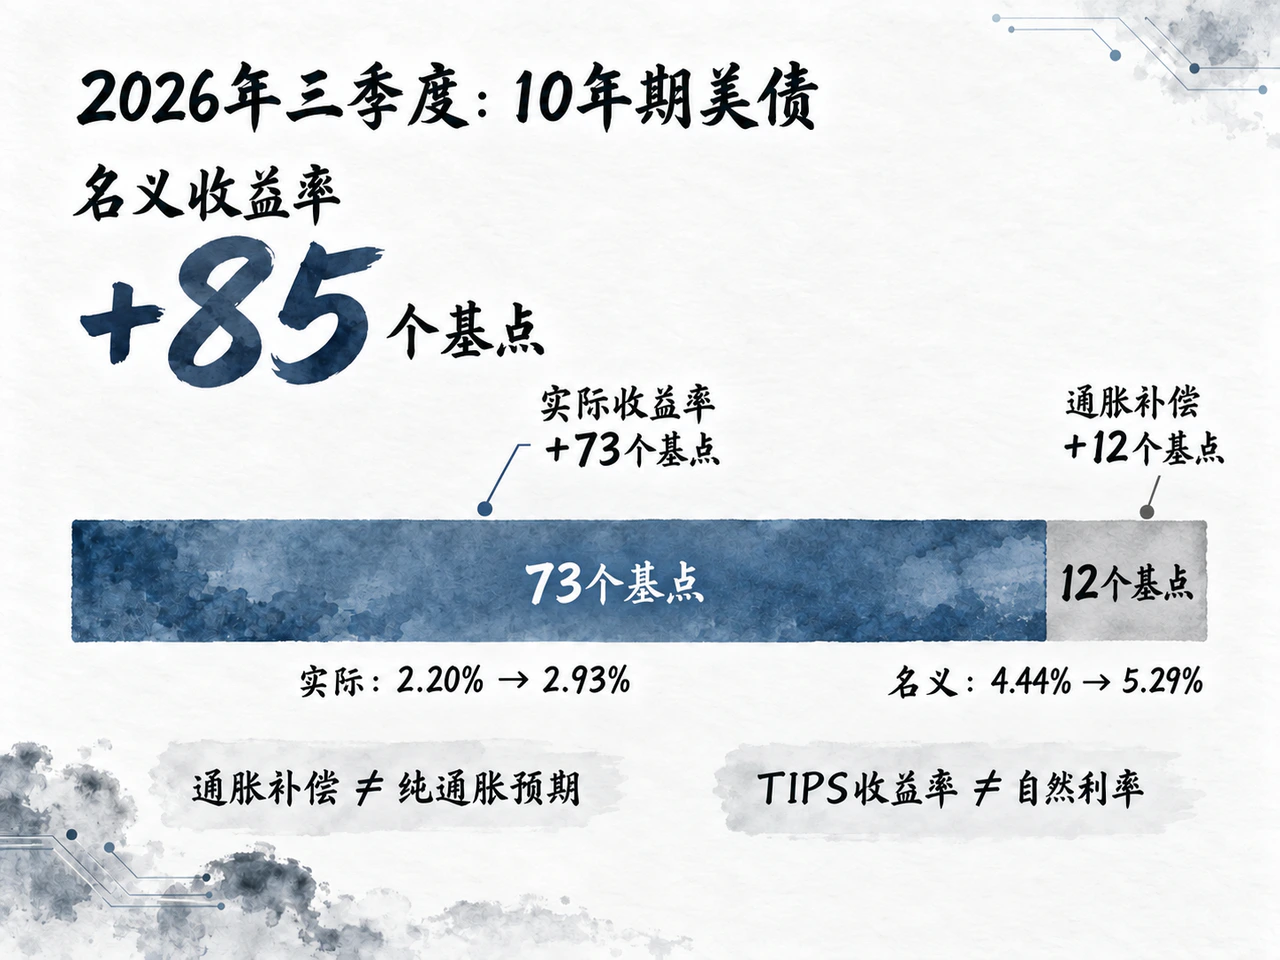
| Nominal Treasury yield | 4.44% | 5.29% | +85 basis points |
| Real yield (TIPS) | 2.20% | 2.93% | +73 basis points |
| Inflation compensation (nominal-real spread) | 2.24% | 2.36% | +12 basis points |
Of the 85-basis-point increase in the 10-year nominal Treasury yield, TIPS real yields rose 73 and inflation compensation widened only 12. TIPS embeds expected future real short rates and real term compensation; the spread includes inflation expectations, inflation risk and liquidity premiums. The increase therefore mainly appears in observed real rates rather than dramatically unanchored inflation compensation. Some institutions attribute it to real investment and AI financing demand, but that is an important macro hypothesis, not a causal contribution independently identified by these data.
BlackRock's September 15 fourth-quarter outlook highlighted AI investment's dual macro role: it generates upstream and downstream orders and profits while consuming capital, power, raw materials and balance-sheet capacity. Spending becomes profit for hardware and infrastructure providers, but larger borrowing demand for the financial system.
Macro data support this observation. BEA revisions on September 30 put second-quarter real GDP growth at a 2.2% annualized quarterly rate, while real final sales to private domestic purchasers (PDFP), excluding volatile components, grew 4.6%. The latter more directly captures private consumption and fixed investment, demonstrating resilient underlying demand and weakening the fundamental case for aggressive easing solely on weak demand. The policy path still depends on labor markets and financial conditions together.
Institutions remain cautiously divided on attribution. Goldman Sachs's September 9 research pointed to deficits, issuance and energy volatility as additional long-yield pressures. PIMCO's September 21 study cautioned against equating AI investment demand with AI debt crowding out Treasuries. Across 6 surprise mega AI-debt announcements, its short windows from the prior close to the following day's close detected no statistically significant systematic response in the 10-year yield or term premium. This event study warns against assigning rate moves to a particular industry's issuance without sufficient evidence.
Productivity's disinflationary effects also take time. BLS figures released September 3 showed second-quarter nonfarm-business productivity up 2.2% year on year, hourly compensation 3.7% and unit labor costs only 1.4%. Efficiency currently offsets some wage pressure, but does not establish a permanent rise in neutral rates or potential growth.
4. Only 43% of constituents above their 200-day average: Capital weighting masks weak breadth
High rates affect firms unevenly, depending strongly on free cash flow and the maturity structure of existing liabilities.
Companies that previously locked in long, low fixed coupons retain protection on existing interest expense, delaying higher overall costs. Those relying on floating-rate debt, near-term refinancing or limited free cash flow feel high benchmark rates sooner.
Microsoft's $55.4 billion quarterly operating cash flow fully covered $35.8 billion cash capex, leaving $19.6 billion free cash flow. Capex had risen sharply from roughly $17.1 billion a year earlier, but strong cash generation meant it did not wholly depend on new borrowing. That does not imply no other financing needs, including buybacks, dividends or liquidity management. Expanding capex also consumes more cash and requires future returns to keep exceeding funding costs.
Capital weighting allows a steady S&P 500 to mask widespread pain beneath the surface:
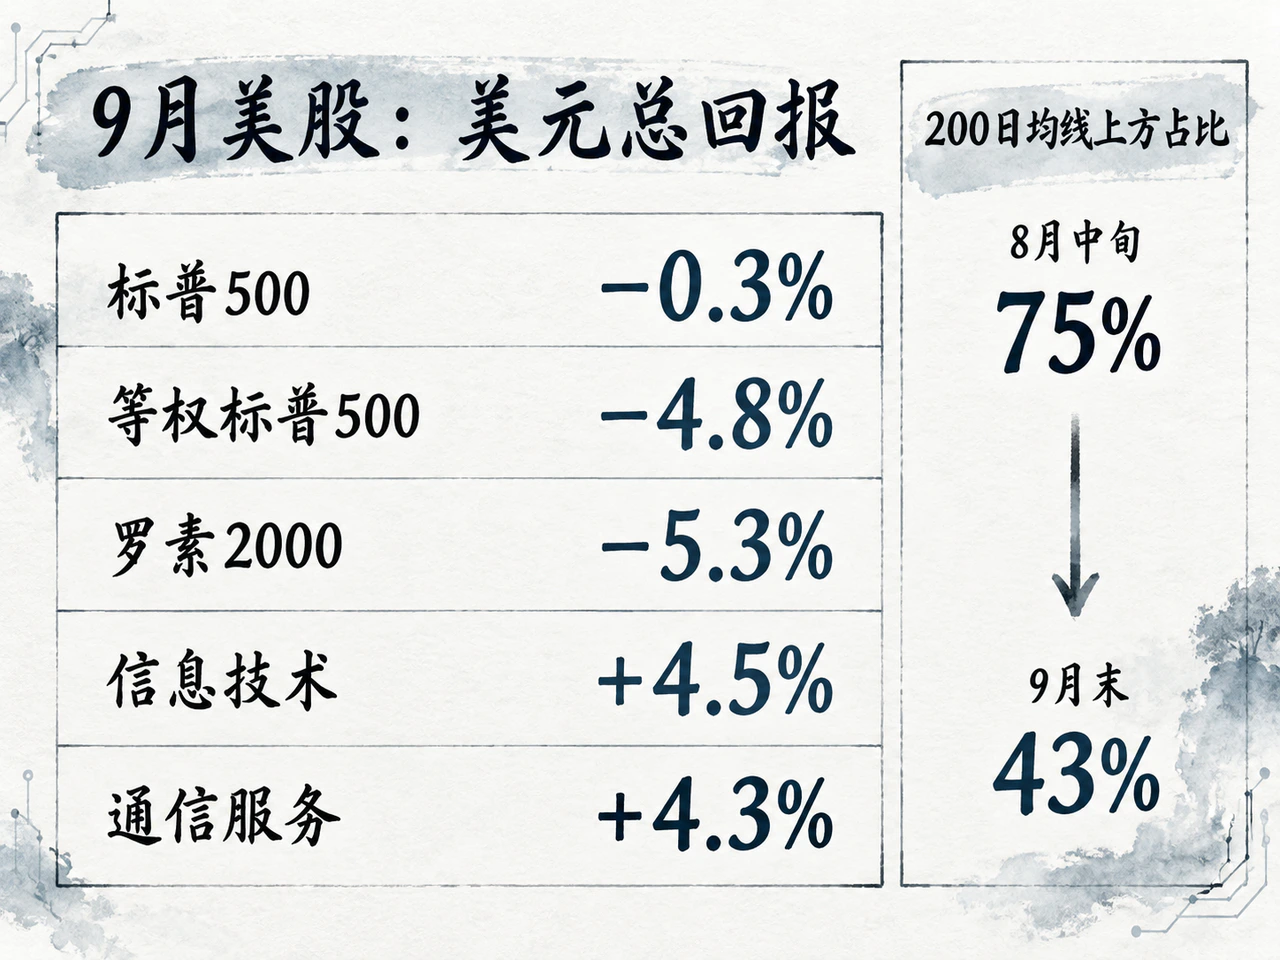
September divergence gave a particularly clear signal. Janus Henderson's monthly report, using U.S.-dollar total returns including dividends, showed:
- S&P 500 total return -0.3%, slightly different in definition from the earlier -0.45% price return;
- The S&P 500 Equal Weight Index fell 4.8%, stripping out the giants' weighting effect;
- The small-cap Russell 2000 fell 5.3%;
- In sharp contrast, capital-intensive technology giants helped information technology gain 4.5%, while communication services gained 4.3%.
JPMorgan Private Bank's October 2 figures showed only about 43% of S&P 500 constituents above their 200-day moving averages at September-end, versus 75% in mid-August, nearly halving. Deteriorating breadth shows stable headline indices do not represent most stocks. Most did not benefit equally, while a few earnings-rich giants masked valuation and price pressure across the broader membership.
5. Looking back at 2022 and 2024: Different policy and growth settings
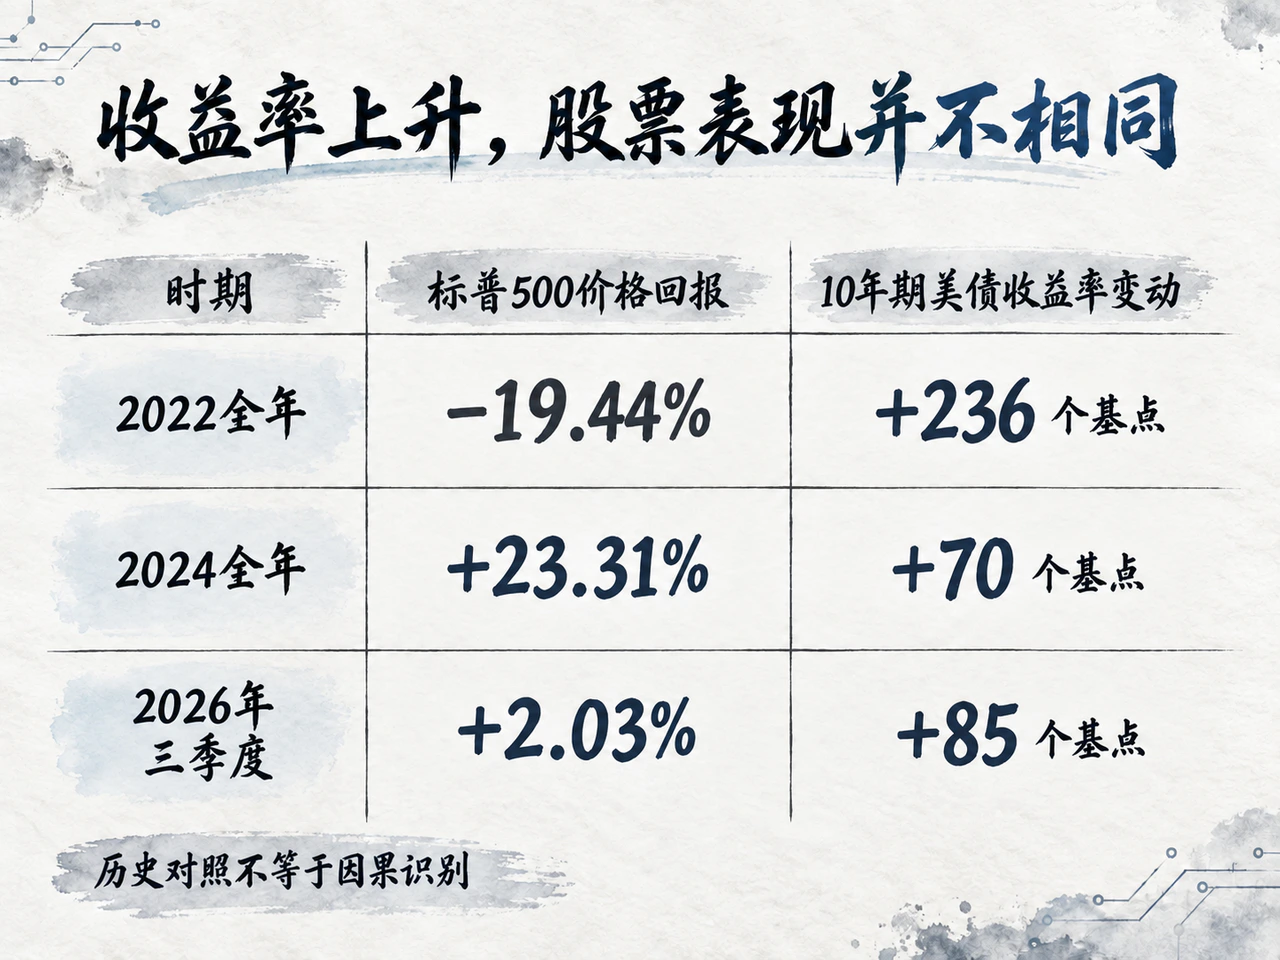
Historical stock performance during rising long Treasury yields varies, rather than following a single linear relationship, with differing macro and policy settings. These observations describe coexistence in specific periods, not complete causal attribution.
| Period | S&P 500 price return | 10-year Treasury yield change | Macro and policy setting |
|---|---|---|---|
| Full year 2022 | -19.44% | 1.52% to 3.88% (+236 bp) | Aggressive Fed tightening amid high inflation; sharply higher long yields pressure equities through discount rates and slower-demand expectations |
| Full year 2024 | +23.31% | 3.88% to 4.58% (+70 bp) | Fed begins cutting while the economy expands; stocks rise strongly alongside recovering long yields |
| Third quarter 2026 | +2.03% | 4.44% to 5.29% (+85 bp) | Ten-year TIPS rises sharply, earnings expectations are upgraded, and the S&P 500 posts a modest price gain |
Note: S&P 500 price returns exclude dividends. Annual intervals run from the previous year's final trading day to the current year's final trading day; third-quarter 2026 runs June 30–September 30. 10-year Treasury changes are absolute changes in the corresponding yield-to-maturity level, in basis points.
2022 featured rapid monetary tightening under high inflation. Aggressive hikes and tighter liquidity raised risk-free discount rates sharply while concerns over final demand grew, causing substantial declines in both stock and bond prices.
2024 presented a different combination. The Fed began easing while the economy continued expanding. Long Treasury yields rose 70 basis points during the year and the S&P 500 gained over 23%. Long yields and short policy rates have different drivers, with the former incorporating long-term growth, inflation risk and term compensation. Higher yields accompanied economic resilience and improving profits, but this remains coexistence rather than proof that higher yields caused stock gains.
These histories challenge the mechanical claim that rising rates inevitably produce large stock losses. Nominal rates constrain pricing, but stock assessment depends above all on whether growth benefits can outpace rising financing costs.
6. From expectations to delivery: Three limits to joint gains under high funding costs
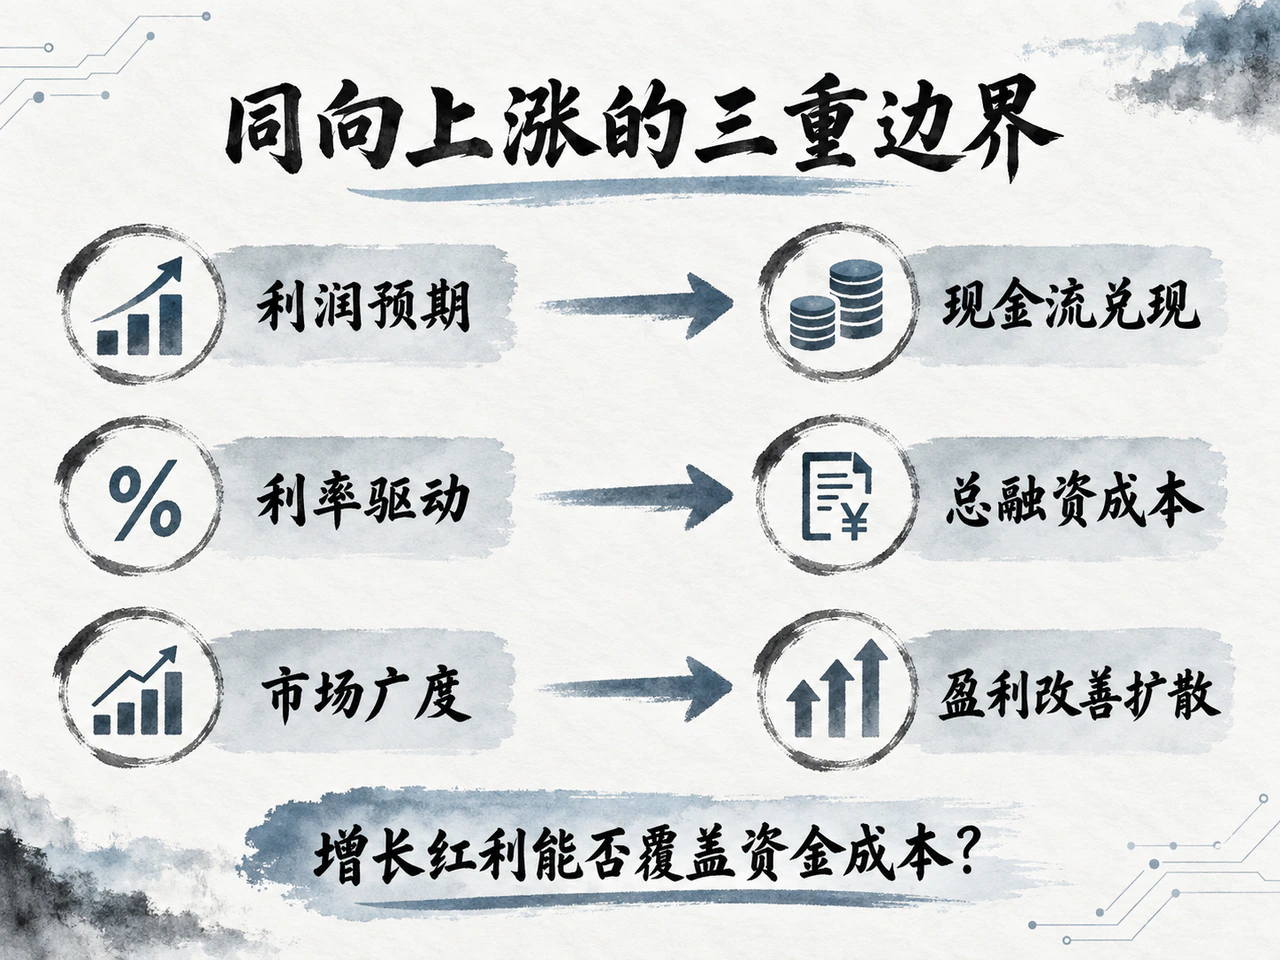
Recent mainstream research generally sees strong profit expectations and private investment demand cushioning equities against moderately rising rates for a time. Disagreements persist over policy direction, fiscal supply, term premium and whether AI finance raises yields. Extrapolating conditional resilience into complete independence from rates lacks fundamental support.
For Treasury yields and share prices to keep rising together, three central limits must be tested:
First, profit expectations must turn into realized operating and free cash flow. Upgrades support confidence, but slower reported revenue, profits dependent on unrealized investment gains, or capex consuming operating cash would quickly challenge the valuation defense.
Second, the drivers of rising long rates must not deteriorate. Current nominal increases mainly appear as real-yield gains, often explained through investment and capital demand. If future increases are driven more by fiscal issuance or uncontrolled inflation-risk premiums, especially alongside wider credit spreads, total corporate financing pressure will worsen. That represents broader financial tightening, beyond a benchmark-rate move, severely testing the offset.
Third, economic and earnings gains must spread more broadly. September's 43% breadth reading and small-cap weakness are warnings. If high rates persist without computing and infrastructure benefits reaching wider industries, a few cash-rich giants will struggle to sustain index resilience indefinitely.
The third-quarter 2026 rise in yields and equities reflects strong economic and investment demand lifting earnings expectations alongside higher pricing of real funding costs. Coexistence depends on incremental returns covering those costs. Once expensive capital materially restrains final demand and investment returns, the fragile offset will end.


