BLS data released at 08:30 US Eastern time on October 2, 2026 showed September nonfarm payrolls increasing only 29,000, the preceding two months revised down a combined 60,000, and annual hourly-earnings growth slowing to 3.0%. Although this substantially weakened expectations of renewed near-term labor-market overheating, bonds failed to sustain their anticipated rally. The 10-year yield initially fell rapidly to about 5.16%, then fluctuated higher to roughly 5.28% late in the session, a rebound of about 12 basis points. The Treasury's consistent official daily par curve, formed around 15:30, showed the 10-year yield up 4 basis points on the day. Its real yield also rose 4 basis points, leaving the nominal-minus-real spread unchanged at 2.36%.
The central logic of this deep V-shaped yield reversal—bond prices first rising, then falling—is that cooler hiring did not become uncontrolled layoffs, and slower wages did not remove persistent inflation or pressure on long-term funding costs. Payrolls reduced the urgency of an immediate October Fed hike, but a large macroeconomic gap remained between postponing one tightening step and shifting decisively to sustained cuts.
Official components show deep divergence on a low-growth labor-market plateau. Monthly government-employment volatility magnified the headline slowdown, private hiring became much less broad, and some groups faced lengthy job searches. Manufacturing, nonresidential construction and household-survey employment nevertheless retained resilience. This combination could trigger temporary morning safe-haven buying, but the headline alone could not overturn the prevailing high-rate pricing framework.
Employment data use the official BLS report; markets and institutional views are updated through after the New York close. Daily Treasury changes consistently use the official par curve, with its roughly 15:30 cutoff. Late-session media quotes for benchmark securities provide intraday references and are distinguished from that curve.
1. September Payroll Gains Fall to 29,000, Below Expectations, but Earlier Revisions Do Not Establish a Collapse
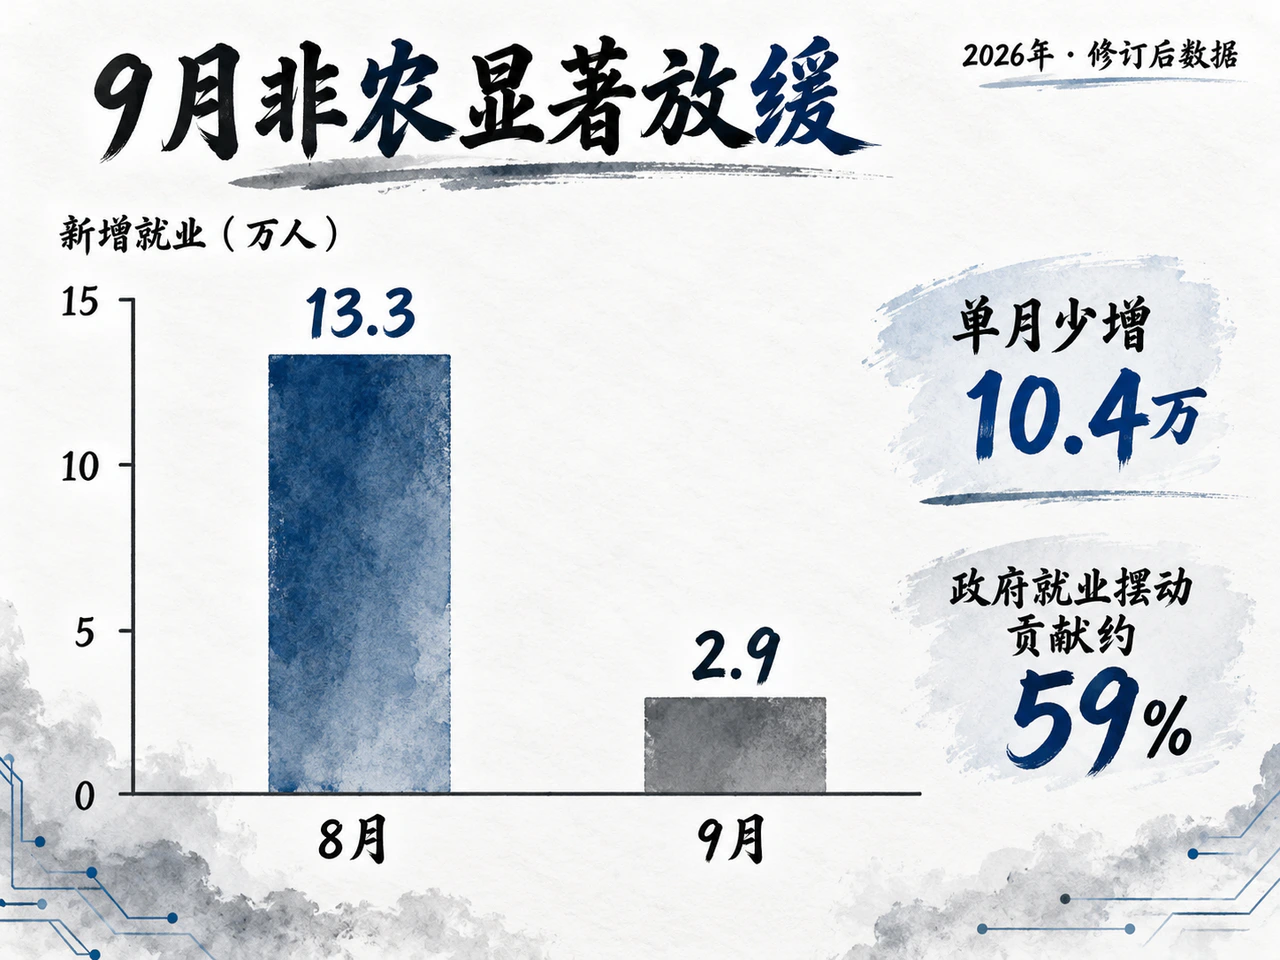
September's 29,000 gain was well below the 84,000 expected by a Dow Jones survey and 90,000 in a Reuters survey, a clear negative surprise. It was 104,000 smaller than August's revised 133,000 gain, with an even greater visual contrast against August's initially reported 162,000.
| Indicator | August or earlier value | September or latest revised value | Main implication |
|---|---|---|---|
| Nonfarm payroll increase | 133,000, revised | 29,000 | Monthly gains slowed substantially |
| Private-sector payroll increase | 89,000 | 46,000 | Private hiring slowed but remained positive |
| Government payroll increase | 44,000 | -17,000 | The monthly swing explains about 59% of the reduction in payroll gains |
| Three-month average nonfarm payroll increase | 51,000 | 51,000 | The moving-average trend holds at a low level |
| Three-month average private payroll increase | 48,000 | 54,000 | The private trend did not deteriorate in parallel |
| Unemployment rate | 4.1% | 4.2% | The increase mainly reflected returning workers and rounding |
| Private employment diffusion index | 57.6 | 49.0 | The breadth of employment improvement fell below the expansion–contraction threshold |
| Average hourly earnings, month on month | Approximately 0.3% | 0.1% | Wage-driven inflation momentum weakened |
Public-sector volatility was a major driver of headline weakness. Government employment reversed from +44,000 in August to -17,000, a swing of 61,000 explaining approximately 59% of the 104,000 reduction in total gains. Private-sector gains fell by 43,000, accounting for the remaining roughly 41%. The dramatic headline slowdown therefore cannot simply imply a wholesale collapse in all private firms' hiring intentions.
Repeated downward revisions reveal more about the trend than one volatile month. July was revised from +21,000 to -10,000 and August from +162,000 to +133,000, a combined reduction of 60,000. This weakened confidence in August's rebound and confirmed lower underlying growth than previously estimated. September's 29,000 gain and earlier periods' 60,000 revision measure different things. Subtracting them to produce a supposed net loss of 31,000 describes a revision relative to the previously understood path; it does not mean September actually lost 31,000 jobs.
The revised series shows July–September gains averaging about 51,000 monthly, exactly matching the three-month average through August. The private-sector average even edged up from 48,000 to 54,000. August's strong recovery failed to become self-reinforcing, but the market remained on a plateau of slow, modest expansion rather than beginning a new sustained plunge.
The BLS described the change as little changed, reflecting sampling limits: the establishment survey's CES monthly statistical-significance threshold is approximately 122,000, placing 29,000 within sampling error. It is a weaker marginal pricing signal, but cannot be treated as a precisely measured starting point for outright losses, much less proof of recession.
2. Private Employment Diffusion Falls Below 50 as Hiring Becomes Highly Concentrated
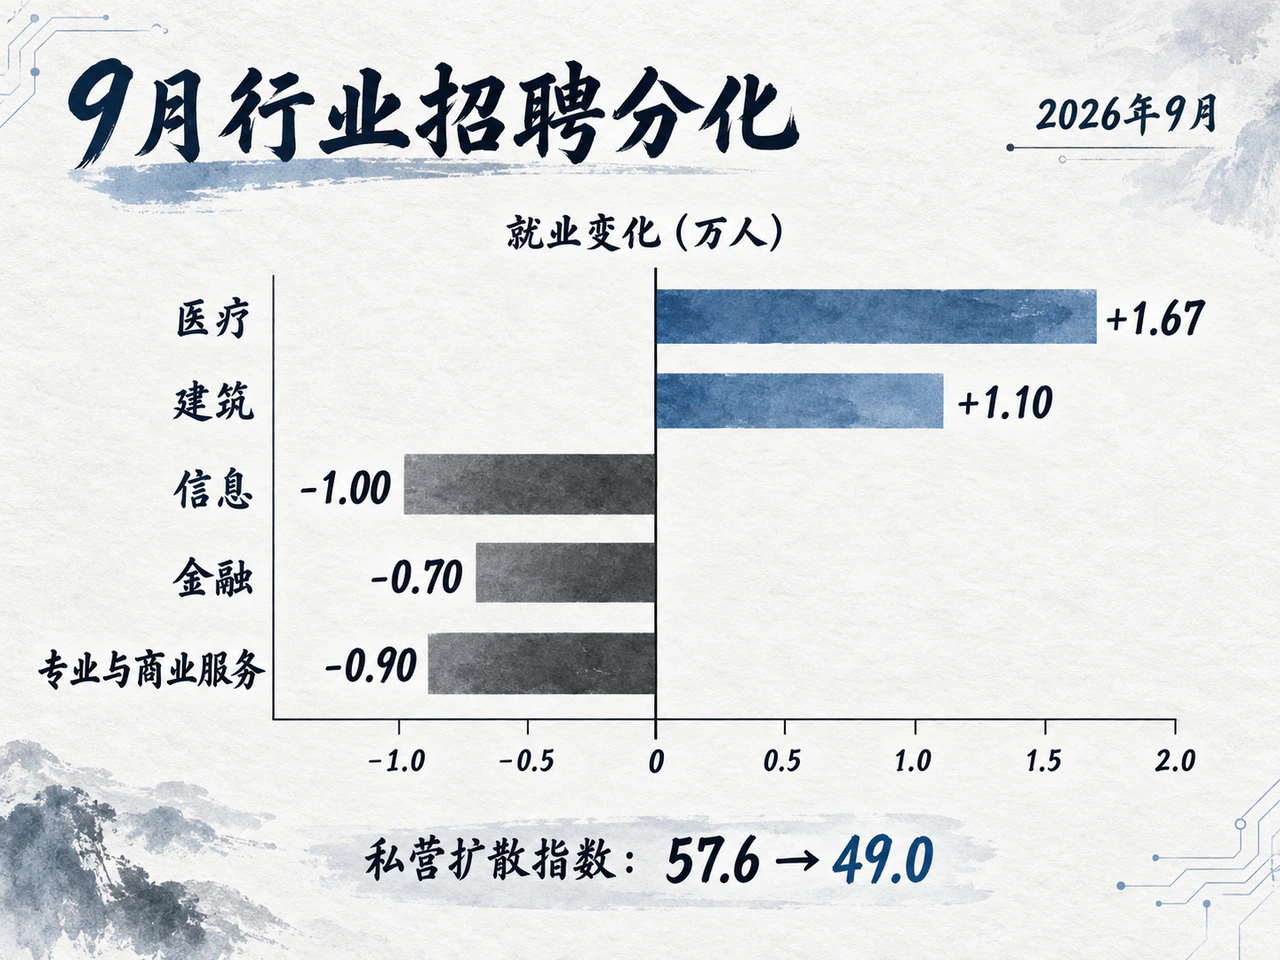
September's 46,000 private-sector gain comprised 18,000 goods-producing jobs and 28,000 service jobs. Health care and social assistance jointly added 23,000, half the private increase. Excluding these two defensive sectors, all other private industries together added only around 23,000, showing a materially narrower expansion base.
| Industry | September employment change | What the components show |
|---|---|---|
| Health care | +16,700 | Ambulatory care (+13,400) and hospitals (+12,000) supported growth, offset by nursing and residential care (-8,700) |
| Social assistance | +6,300 | Together with health care, supplied about half of private job growth |
| Construction | +11,000 | Nonresidential specialty contractors were strong (+12,300); residential specialty contractors were under pressure (-7,900) |
| Manufacturing | +9,000 | Machinery, plastics and rubber contributed substantially, but expansion was uneven |
| Leisure and hospitality | +10,000 | Food services and drinking places increased steadily (+10,800), while accommodation fell (-3,600) |
| Transportation and warehousing | +7,600 | Transport performed relatively well; warehousing lost 4,100 jobs |
| Retail trade | +5,800 | Modest overall gains with substantial differences among formats |
| Information | -10,000 | Publishing, broadcasting and content, telecommunications and related subsectors all cut jobs |
| Financial activities | -7,000 | Credit intermediation, related financial activities and insurance continued reducing jobs |
| Professional and business services | -9,000 | Temporary-help services, a flexible-employment gauge, fell 10,900; professional and technical services still added 6,400 |
| Government | -17,000 | Local government (-13,000) and states (-3,000) led losses; federal employment slipped 1,000 |
Note: The table lists key components; summing these industries does not directly reproduce the nonfarm total.
Health care, long an employment-growth engine, was losing marginal momentum. September's 16,700 gain was about half the past 12 months' monthly average of 33,000. Ambulatory care and hospitals still added staff, but substantial nursing and residential-care cuts offset part of the gain, suggesting increasing limits on services' ability to absorb labor.
Construction showed a clear two-track pattern: nonresidential specialty contractors added 12,300, while residential specialty contractors lost 7,900. This fits high mortgage rates restraining housing while large-project corporate capex stays active. First Trust attributed part of manufacturing and nonresidential-construction improvement to data centers. BLS industries do not track specific capital-spending destinations, however, so all nonresidential resilience cannot be equated with AI benefits.
Manufacturing's 9,000 gain did not establish a broad recovery. Employment diffusion plunged from 63.9 to 46.5, with growth concentrated in machinery, rubber, plastics and a few other categories. Declining subsectors outnumbered gainers, materially narrowing hiring breadth. The index gives unchanged industries half-weight: below 50 means more decliners than gainers, rather than more than half of all industries cutting jobs. Small aggregate gains alongside rapidly shrinking breadth characterize this phase.
Services more directly showed defensive corporate behavior. Information lost 10,000, finance 7,000, and professional and business services 9,000. Temporary help, a leading cyclical indicator, fell sharply by 10,900 as employers cut flexible labor costs. High-value professional, scientific and technical services still added 6,400. Firms were trimming administrative and support jobs without halting core research and intellectual-asset investment; this should not be generalized into indiscriminate white-collar layoffs or AI replacement.
Crucially, private employment diffusion fell from 57.6 to 49.0. It assigns full weight to industries adding jobs and half-weight to unchanged ones, with 50 dividing expansion and contraction. Below 50 does not mean only 49% of industries are hiring more; it means job-cutting industries have gained the upper hand at the margin and hiring is systematically less broad.
Government job losses in September were led by local (-13,000) and state (-3,000) employment. Federal employment declined only 1,000.
3. Returning Workers Lift Unemployment to 4.2%, While Fewer Permanent Job Losers Undercut Uncontrolled-Layoff Claims
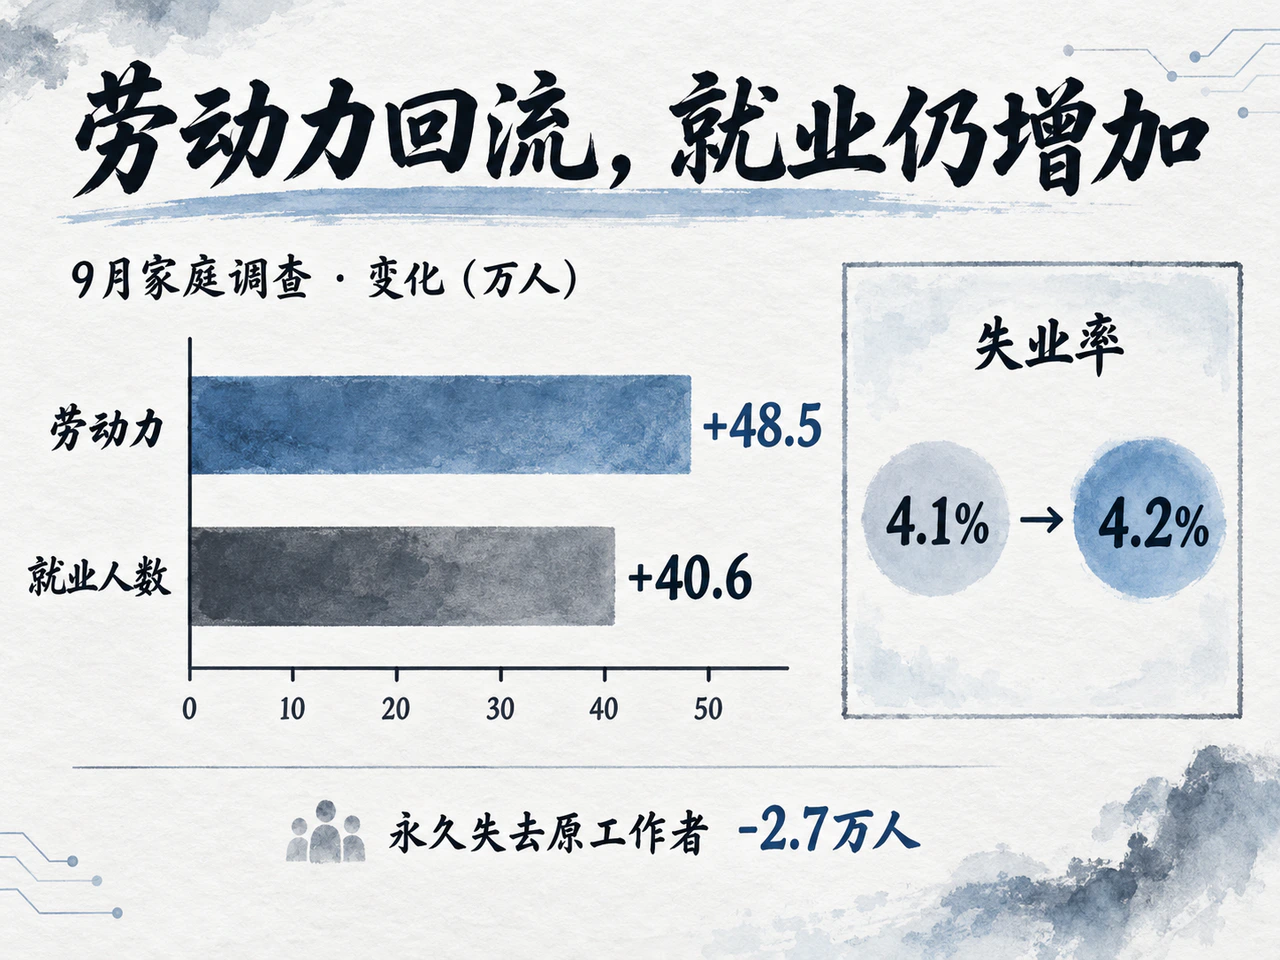
Unlike establishment payroll-job counts, the household survey supplies evidence on both labor supply and demand. September's labor force grew 485,000, employment 406,000 and unemployment only 78,000. The slight rate increase mainly reflected returning workers and incoming jobseekers outpacing employers' marginal absorption, rather than a concentrated wave of dismissals.
| Key household-survey measure | August | September | Change |
|---|---|---|---|
| Labor force | 169.777 million | 170.262 million | +485,000 |
| Employment | 162.746 million | 163.152 million | +406,000 |
| Total unemployed | 7.031 million | 7.109 million | +78,000 |
| Labor-force participation rate | 61.6% | 61.8% | +0.2 percentage point |
| Employment-to-population ratio | 59.1% | 59.2% | +0.1 percentage point |
| Broad unemployment rate, U-6 | 7.7% | 7.6% | -0.1 percentage point |
| Permanent job losers | 1.777 million | 1.750 million | -27,000 |
| Part-time for economic reasons | 4.390 million | 4.501 million | +111,000 |
| Share long-term unemployed, 27 weeks or more | 27.0% | 27.1% | +0.1 percentage point |
Recalculating from BLS totals in whole thousands, unemployment rose only from about 4.141% in August to 4.175% in September, an actual increase of 0.034 percentage point. Crossing the rounding boundary produced the published change from 4.1% to 4.2%. Understanding this helps avoid treating the reported 0.1-point change as accelerated deterioration.
Reasons for unemployment further weaken the broad-layoff hypothesis. Job losers and people whose temporary jobs ended fell 45,000; permanent job losers declined 27,000. The increase mainly came from reentrants (+152,000) and new entrants (+116,000), consistent with low hiring, low dismissals and slow absorption of new supply. These categories describe stocks of unemployed people, not dismissals occurring during the month.
Internal measures still revealed pressure. Within the 406,000 household employment gain, usual full-time employment rose 88,000 and usual part-time 205,000. These independently seasonally adjusted counts of people are not establishment jobs and do not fully decompose the total. Part-time employment for economic reasons rose 111,000. U-6 edged down 0.1 point to 7.6%, mainly because marginally attached workers fell 236,000, rather than because job quality improved broadly.
The share unemployed for 27 weeks or longer edged up to 27.1%, above 23.6% a year earlier, indicating lengthy reemployment for some. But long-term unemployment rose only 14,000 in absolute terms, classified by BLS as essentially unchanged; deterioration had not become an uncontrolled snowball.
The surveys' definitions matter. The household survey counts people and includes self-employment and agriculture; its monthly significance threshold is around 650,000. A 406,000 gain is therefore not independent proof of a strong rebound. Its main value is evidence on labor supply and unemployment's non-layoff composition that strongly weakens a spiraling-recession narrative.
4. Hourly-Wage Growth Slows to 3.0% While Stable Hours and Resilient Consumption Support Nominal Demand
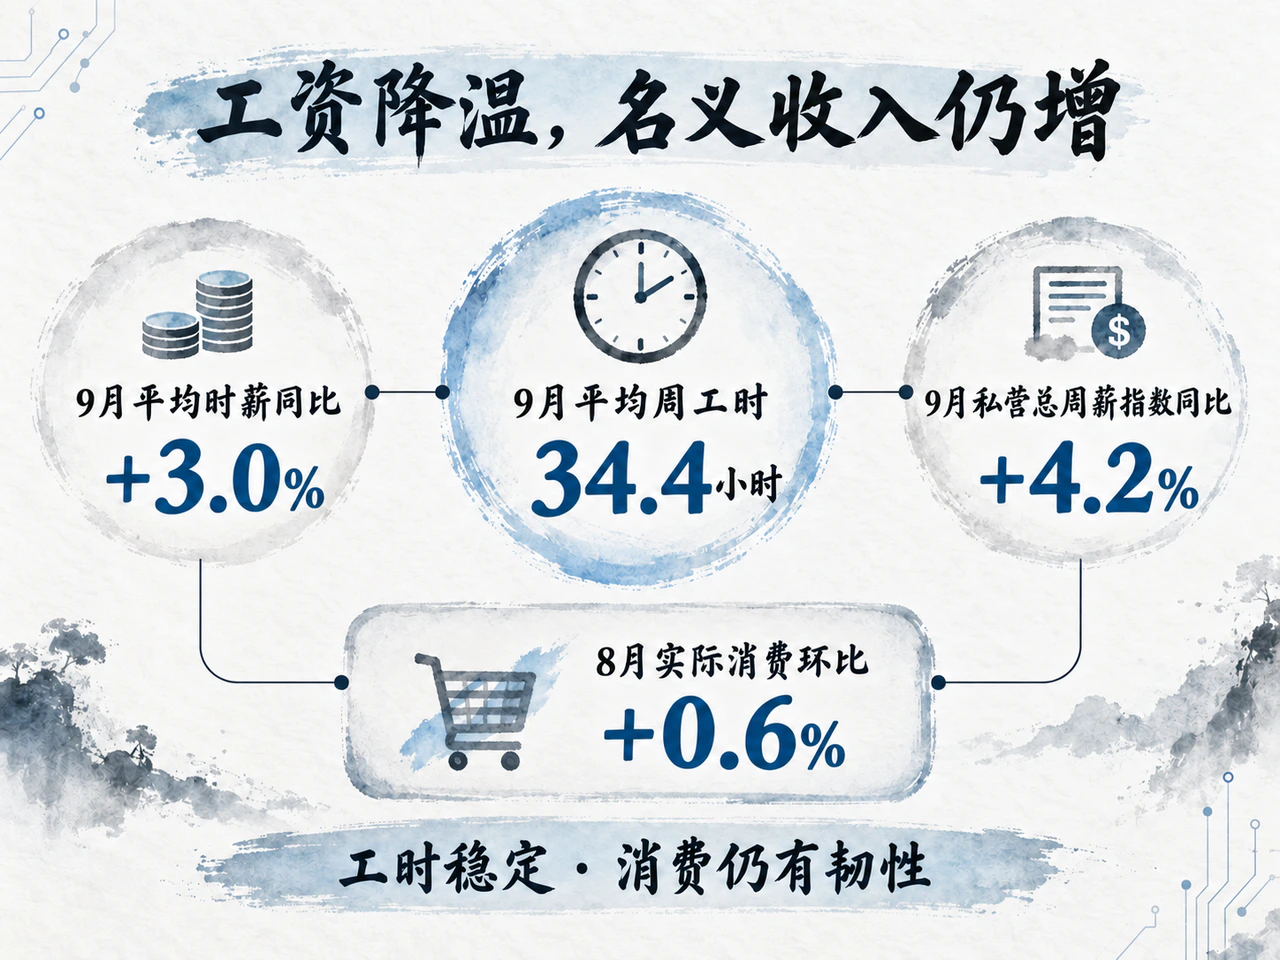
September average hourly earnings for all employees rose a modest 0.1%, or 5 cents, to $37.81, slowing to 3.0% year on year. Production and nonsupervisory earnings rose 0.2%, or 7 cents, to $32.60. Moderating wages further eased labor-cost pressure on core-services prices.
Companies had not broadly cut hours in response to slower hiring. The private workweek stayed at 34.4 hours; manufacturing hours held at 40.6, including 3.0 overtime hours. Aggregate private weekly hours were unchanged and aggregate weekly payrolls edged up 0.2% month on month. Stable actual labor input showed no sign of contraction in total nominal compensation.
Official aggregates showed average weekly earnings up about 3.6% year on year and private aggregate weekly payrolls, incorporating employment and hours, up roughly 4.2%. The 3.0% hourly-wage increase cannot substitute for total household labor income. All these measures are nominal; purchasing-power gains depend on the inflation adjustment.
Other demand data balanced bond pricing. BEA data released September 30 showed August nominal PCE up 0.9% month on month and real consumption up 0.6%. Flat real disposable income lowered the saving rate to 4.1%, but household spending remained resilient. Weak hiring gradually slows future income growth without immediately destroying current employees' pay cash flows and spending inertia.
Output depends jointly on labor-force size, hours and productivity, rather than new jobs alone. The Fed's September statement cited productivity improvements and capital-spending support. Firms maintaining output through efficiency while slowing hiring can deliver solid growth alongside small job gains. If that growth retains sustained capex and credit demand, weak payrolls alone offer little basis for a persistent decline in equilibrium real rates.
Payrolls calmed concern about labor-driven inflation acceleration, rather than removing inflation's absolute-level warning. August headline and core PCE were 3.4% and 3.0% year on year, still well above the Fed's 2.0% anchor. September 30 revisions lowered earlier inflation and August was slightly softer than expected, but elevated core inflation still limited policymakers' tolerance for broad financial easing.
5. Institutions Favor an October Pause, With Further Tightening Still Possible This Year

Mainstream Wall Street interpretations did not move toward recession trading or a countdown to cuts. They quickly formed a pragmatic middle view: the data substantially reduced the urgency of an October FOMC hike without closing the window for December and later tightening.
| Institution and commentator | Main post-release assessment | Implication for policy and bonds |
|---|---|---|
| Jefferies,Thomas Simons | August's strength was a brief recovery from June–July weakness; September effectively closed the door to an October hike | Clearly reduced the need for immediate tightening |
| First Trust,Brian Wesbury、Robert Stein | The headline softened, but household employment, participation, manufacturing and construction were resilient; rounding affected unemployment | Expected no change in October and a shift in focus to December |
| RSM,Joseph Brusuelas | Low hiring and low layoffs remained the baseline; estimated monthly gains needed for stable unemployment had fallen to about 35,000 | Expected an October pause, followed by 25-basis-point hikes in December and the following March |
| Navy Federal,Heather Long | Outside hiring opportunities narrowed and real wage purchasing power weakened, but the labor-market foundation remained solid | Weak payrolls were insufficient to rule out a December hike |
| Natixis,Chris Hodge | Cooler wages and hiring reduced immediate urgency; inflation remained the Fed's ultimate anchor | Expected fewer later hikes than currently priced, but still leaned toward one more |
| Neuberger,Joseph Purtell | September was weaker than August, but the overall labor market remained broadly stable | Supported the judgment that one weak payroll month had not changed the longer-term policy baseline |
| Mutual of America,Jerry Tempelman | Slower employment and rising unemployment warranted concern; further hikes would increase real-economy tightening risk | Highlighted tail risks of weaker demand and monetary overtightening |
| Goldman Sachs Asset Management, Lindsay Rosner | Soft data strongly rebutted labor overheating, but did not guarantee the hiking cycle was over | Baseline remained one December hike; energy risks could force earlier action |
| JPMorgan, Michael Feroli | Cooler wages greatly reduced consecutive-hike urgency; October action would require an exceptionally hot CPI | Maintained a December-hike baseline, conditional on persistent September–October core inflation |
| Girard,Timothy Chubb | Payrolls did not overturn the Fed's central challenge; the yield reversal was logically consistent | Still favored rates staying higher for longer |
Note: These views are distilled from public institutional research or named media interviews after the October 2 release. They represent diverse reasoning, not a consensus forecast measured at one common time.
RSM's structural estimate was particularly instructive. Aging-related retirements and slower immigration materially reduced potential labor-supply growth, lowering the neutral monthly payroll gain needed for stable unemployment to about 35,000. This is its internal econometric estimate, not an official threshold. If valid, a soft 29,000 gain is close to the new supply-demand steady state; historical rules requiring monthly gains of well over 100,000 cannot directly diagnose recession.
Supply constraints do not justify ignoring weak demand. September's higher participation, slower monthly wages, sharp temporary-help cuts and contracting diffusion indices all confirm cooler demand. Low hiring under constrained supply need not cause unemployment to jump, but this cannot be inverted to mean fewer jobs necessarily imply higher inflation pressure.
First Trust and RSM's differing emphasis on the household survey is representative. The former saw its 406,000 gain as resilience; the latter stressed limited statistical significance. This reflects complex fundamentals: neither strong momentum toward renewed overheating nor systemic collapse was evident.
6. The 10-Year Yield Rebounds 12 Basis Points: Real Rates Lift the Curve as Weak Payrolls Fail to Break the High-Rate Framework
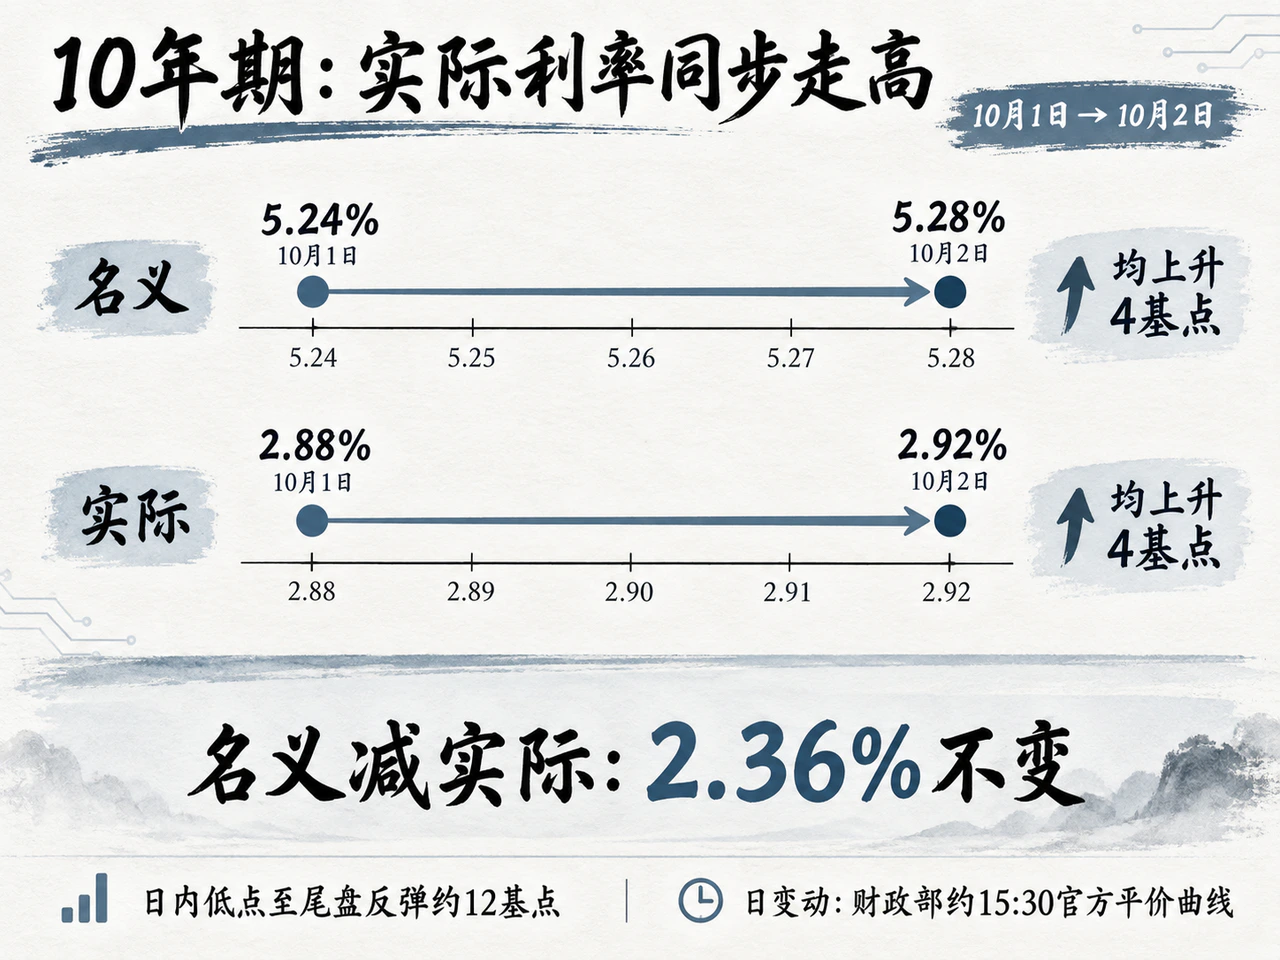
Weak payrolls initially reduced near-term tightening expectations, but the morning rally in cash Treasuries and futures was fragile. After midday in New York, yields fluctuated higher and rebounded across maturities; October-hike odds recovered much of their early decline.
| New York time and observation source | Main observed intraday change | Underlying pricing implication |
|---|---|---|
| 08:30, immediately after release | Reuters recorded the 10-year falling to an intraday low near 5.157%, and the 2-year to around 4.693% | Employment and wages both missed expectations, briefly triggering safe-haven bond buying |
| 12:47, Reuters intraday update | The 10-year recovered to 5.256% and the 2-year to 4.821%, both reversing into daily increases | Selling fully reversed the morning bond rally triggered by the data surprise |
| 16:03, CNBC late-session update | The 10-year was 5.281%, the 2-year 4.839%, and the 30-year 5.629% | Yields rose across maturities and held high into the close as buyers retreated |
| 17:23, Reuters policy roundup | October-hike odds returned to around one-quarter, with a December hike still highly likely | October expectations returned toward the roughly 26% pre-release level; tightening remained the policy backdrop |
These quotes are from live media reports. The 12-basis-point recovery measures the intraday range, not the full-day settlement change. Cross-day comparisons require the consistent official Treasury par curve:
| Treasury daily par yield | October 1 | October 2 | Daily change |
|---|---|---|---|
| 2-year | 4.78% | 4.83% | +5 basis points |
| 5-year | 5.01% | 5.06% | +5 basis points |
| 10-year | 5.24% | 5.28% | +4 basis points |
| 30-year | 5.61% | 5.63% | +2 basis points |
The Treasury par curve is interpolated mathematically from indicative bid-side quotes around 15:30 New York time, supplying daily standard-maturity benchmarks. Alongside late media quotes, it establishes that weak payrolls failed to lower rates and yields finished higher across maturities. The 2-year and 5-year rises of 5 basis points each exceeded the 30-year's 2-basis-point increase. The 2–10-year spread narrowed from 46 to 45 basis points, a modest bear flattening. The rise therefore was not solely an uncontrolled long-end fiscal-deficit premium.
Macro, positioning and cross-asset evidence suggest five dimensions behind the reversal from a strong Treasury rally to a selloff:
First, payrolls reduced immediate hike urgency without overturning the higher-rate policy backdrop. The Fed had raised its funds target by 25 basis points to 3.75%–4.00% on September 16. Its accompanying dot plot placed both 2026 and 2027 year-end median rates near 4.1%. Although predating September payrolls, this communicated holding rates high rather than imminent cuts.
After payrolls, October-hike pricing initially fell from about 26% to 14%–16%, then recovered to roughly 23% by CNBC's late update and around one-quarter in Reuters' 17:23 roundup. These snapshots are not settlement prices, but show a rapid correction of the morning's aggressive easing interpretation. More importantly, major institutions and futures still assigned a very high probability to another December increase.
As a simple arithmetic example, delaying one 25-basis-point hike from October to December, about two months, while leaving the rest of the short-rate path unchanged alters its simple average over 10 years, or 120 months, by only about 0.4 basis point: 25bp × 2/120. This static illustration is not a duration conversion or attribution of the day's move. Nor does it mean one meeting's adjustment cannot affect long yields by changing expectations for the whole future path.
Second, employment components retained enough resilience to interrupt recession trading. Higher household-survey unemployment mainly accompanied returning workers; permanent job losers fell, private three-month job growth improved, and aggregate private hours stayed stable. Slow hiring limits future expansion without causing simultaneous collapses in unemployment conditions and total pay. This supported short-end rebounds such as the 2-year.
At 13:22 New York time, Reuters reported Chicago Fed President Goolsbee reiterating that employment remained solid and excessive inflation the central problem, with both a hike and a hold under discussion. This appeared after the rebound began and cannot be its direct trigger. It nevertheless showed weak payrolls had not caused officials to abandon restrictive policy.
Third, official curves show yields rising primarily through real rates rather than a jump in inflation expectations.
| 10-year Treasury-curve decomposition | August 31 | October 1 | October 2 | Daily change | Cumulative change since end-August |
|---|---|---|---|---|---|
| Nominal par yield | 4.75% | 5.24% | 5.28% | +4 basis points | +53 basis points |
| TIPS real par yield | 2.44% | 2.88% | 2.92% | +4 basis points | +48 basis points |
| Difference, or breakeven inflation rate | 2.31% | 2.36% | 2.36% | 0 basis points | +5 basis points |
The difference between official 10-year nominal and TIPS real daily par yields stayed at 2.36%. This breakeven is an approximate inflation-compensation measure incorporating expectations, inflation-risk premiums and liquidity premiums, rather than directly measured pure expectations. An unchanged spread does not exclude persistent-inflation concerns lifting long yields through higher expected real policy rates and term premiums.
Real rates are not simply a pure term premium: they combine future short-term real-rate expectations, real term compensation and liquidity premiums. Inflation-protected spreads also contain inflation-risk compensation. Official curves identify pressure concentrated in real yields, but cannot precisely isolate each underlying contribution.
Fourth, oil recovered much of its deep intraday decline, limiting further easing in inflation expectations. Brent approached a 4% loss before bargain buying helped it settle at $102.25 a barrel, down just $0.06, or 0.06%. WTI settled at $91.11, narrowing its loss to $1.76, or 1.90%. Failure to sustain the oil breakdown dulled bond buying initially driven by easing energy-inflation fears.
Oil alone cannot explain the reversal. At Reuters' 12:47 observation of yields turning higher, Brent was still down 0.92% and WTI 2.15%. The G7 that day advanced an IEA-coordinated petroleum-stock release, including crude and products, over four months with diesel prioritized in the first 20 days. It mainly implemented March commitments and included some already delivered shares, rather than adding a net new 100 million barrels. Without systematic expectations data, it should not be labeled a surprise or as expected. Geopolitics and intervention both affected oil, but minute-level evidence linking each oil move to the Treasury rebound is absent.
Fifth, longer-term industrial financing needs provide structural support, while trading adjustments and profit-taking may amplify intraday swings. AI and other infrastructure drive capex in power, data centers and equipment, potentially improving productivity without proportionate hiring. Low job growth and high capex can support a higher equilibrium real rate, R*, and pricing pressure from long-term corporate-bond supply. These are conditional medium-term hypotheses, not direct measured explanations for the day's 12-basis-point swing. ING's October 1 outlook discussed AI capex and corporate long-bond supply supporting a rates floor, but also noted no unusual year-on-year surge in current net Treasury supply or deficits, warning against blaming a single fiscal shock.
Reuters' 15:34 New York update cited TD Securities' Molly Brooks suggesting interacting drivers: revised tightening expectations, profit-taking on morning longs and pre-weekend position adjustments. She stressed inflation remained the central constraint and bonds were still under pressure. This frontline assessment points to possible technical-flow amplification, but is participants' attribution rather than a fact verified against specific fund movements.
Late New York trading clarified the macro picture. September's weak payrolls showed marginal cooling, and early yield declines reflected near-term policy repricing. But slower hiring without uncontrolled layoffs, alongside 3.0% core inflation, prompted a late correction in year-end tightening pricing. Nominal and real par yields rose together, showing caution over the threshold for cuts under capital-return expectations and inflation persistence. Weak payrolls reduced immediate Fed urgency without providing decisive grounds for a sustained long-rate downtrend.
A durable Treasury-yield downtrend would usually require corroborating signals such as materially weaker private job trends, substantially higher initial claims and permanent job losers, contracting private aggregate hours and real payrolls, or broader relief in core inflation and energy pressure. This is a combined observation framework, not exclusive conditions that must mechanically occur together. If capex and consumption remain resilient, one weak payroll month may chiefly affect a meeting's timing rather than independently establish a long-yield downcycle.


