On October 6, 2026, US Treasury yields fell, the S&P 500 set a closing record, the dollar weakened and gold rose. Easing rate pressure and corporate earnings news improved sentiment, but the rally had clear limits: small caps fell, oil recovered its intraday losses, and import and employment data continued to show resilient demand. Markets gained room for valuation recovery, without enough evidence to establish fading inflation or a comprehensive improvement in financing conditions.
By the morning of October 7, Beijing time, the S&P 500 had closed at 7,818.93, up 0.58% from October 5; the Dow gained 0.49% to 51,521.28 and Nasdaq 100 rose 0.48% to 31,224.69. The Russell 2000 fell 0.59% to 2,830.30. The large-cap/small-cap divergence was an important clue to the day's risk appetite.
Treasury yields fall without a meaningful decline in inflation compensation
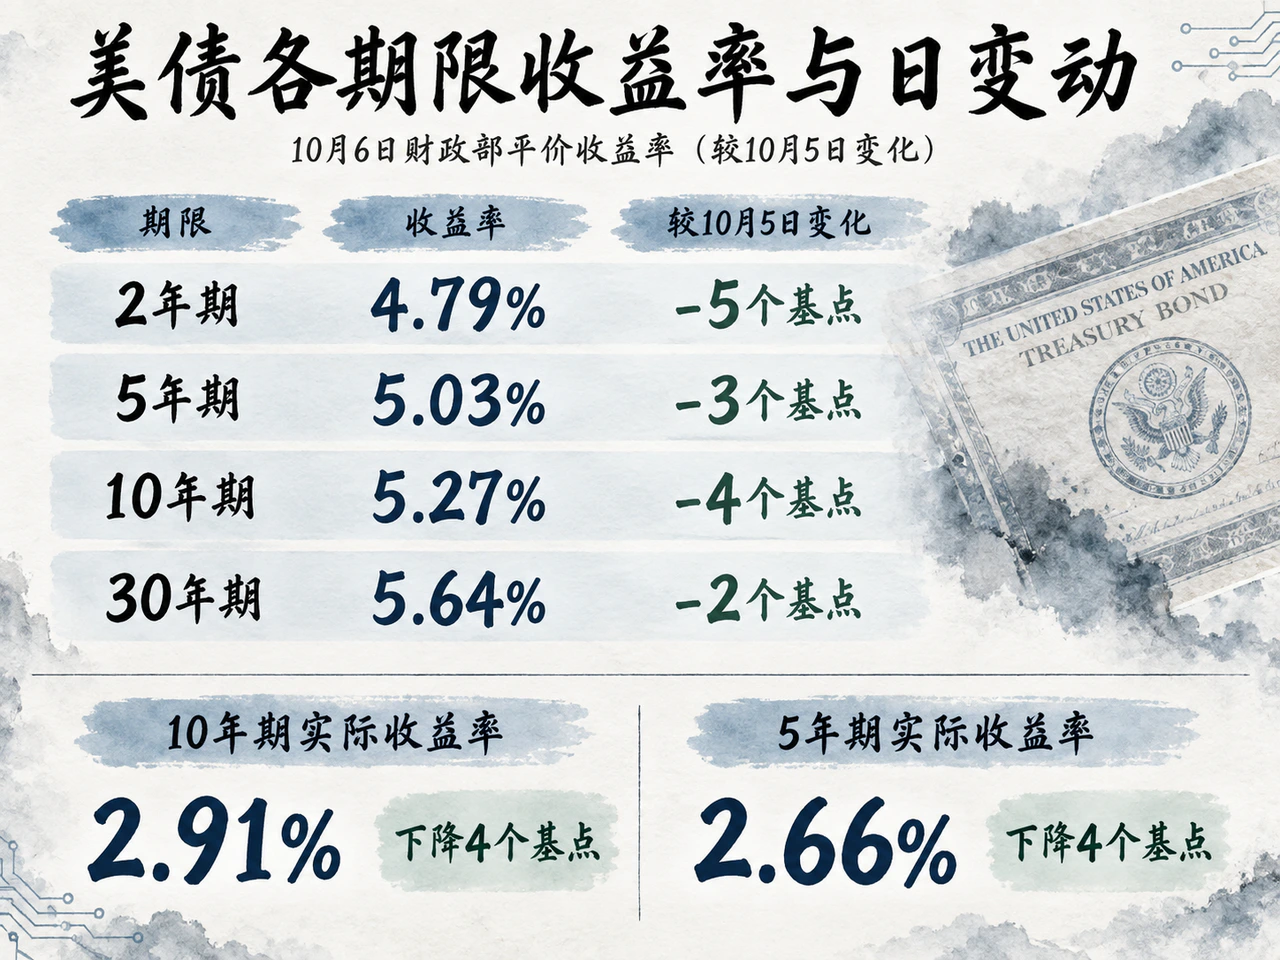
The US Treasury's comparable daily par yield curve showed all major maturities lower on October 6 than October 5, with slightly larger declines at the short end.
| Maturity | October 6 yield | Change from October 5 |
|---|---|---|
| 2-year | 4.79% | −5 basis points |
| 5-year | 5.03% | −3 basis points |
| 10-year | 5.27% | −4 basis points |
| 30-year | 5.64% | −2 basis points |
The 10-year/2-year spread widened from 47 to 48 basis points, a slight steepening alongside lower yields. The short end was consistent with marginally softer policy expectations: Reuters reported intraday on October 6 that the market assigned about a 22% probability to a hike that month, down from about 50% a week earlier. This shows reduced hike bets relative to the prior week, rather than a one-day probability change on October 6, and cannot quantify their contribution to the 2-year yield decline.
The 10-year move has more direct quantitative evidence. The Treasury real yield curve showed the 10-year real yield down 4 basis points to 2.91% on October 6, matching the nominal decline, leaving their gap at 2.36 percentage points. The 5-year real yield also fell 4 basis points to 2.66%, while its nominal-real gap widened 1 basis point to 2.37 percentage points. This approximate inflation-compensation measure includes liquidity and other factors and is not pure inflation expectations, but it does not support attributing the bond rally mainly to declining inflation compensation.
On supply, the Treasury completed a $58 billion 3-year auction at a high yield of 4.932% and bid-to-cover of 2.62. New supply found demand, but the results alone do not establish unusually strong buying. Reuters listed a $39 billion 10-year auction on October 7 and $22 billion 30-year auction on October 8, leaving long-end absorption to be tested. The mere 2-basis-point fall in 30-year yields also showed uneven recovery across maturities.
European bonds saw some relief from fiscal promises. Reuters reported that Le Pen proposed €140 billion in net savings by 2032 relative to 2026 if she won the 2027 French presidential election, above an earlier €125 billion plan. At the report's 12:41 UTC update, France's 10-year yield was about 14 basis points lower intraday at 4.72%. Nuveen macro-credit head Laura Cooper said a plan to improve deficits could help ease that morning's rate pressure, but implementation details remained inadequate. Campaign pledges were not budget outcomes; the French government's separate €43 billion in new 2027 savings also remained subject to parliamentary approval.
Imports and hiring show continued US demand resilience
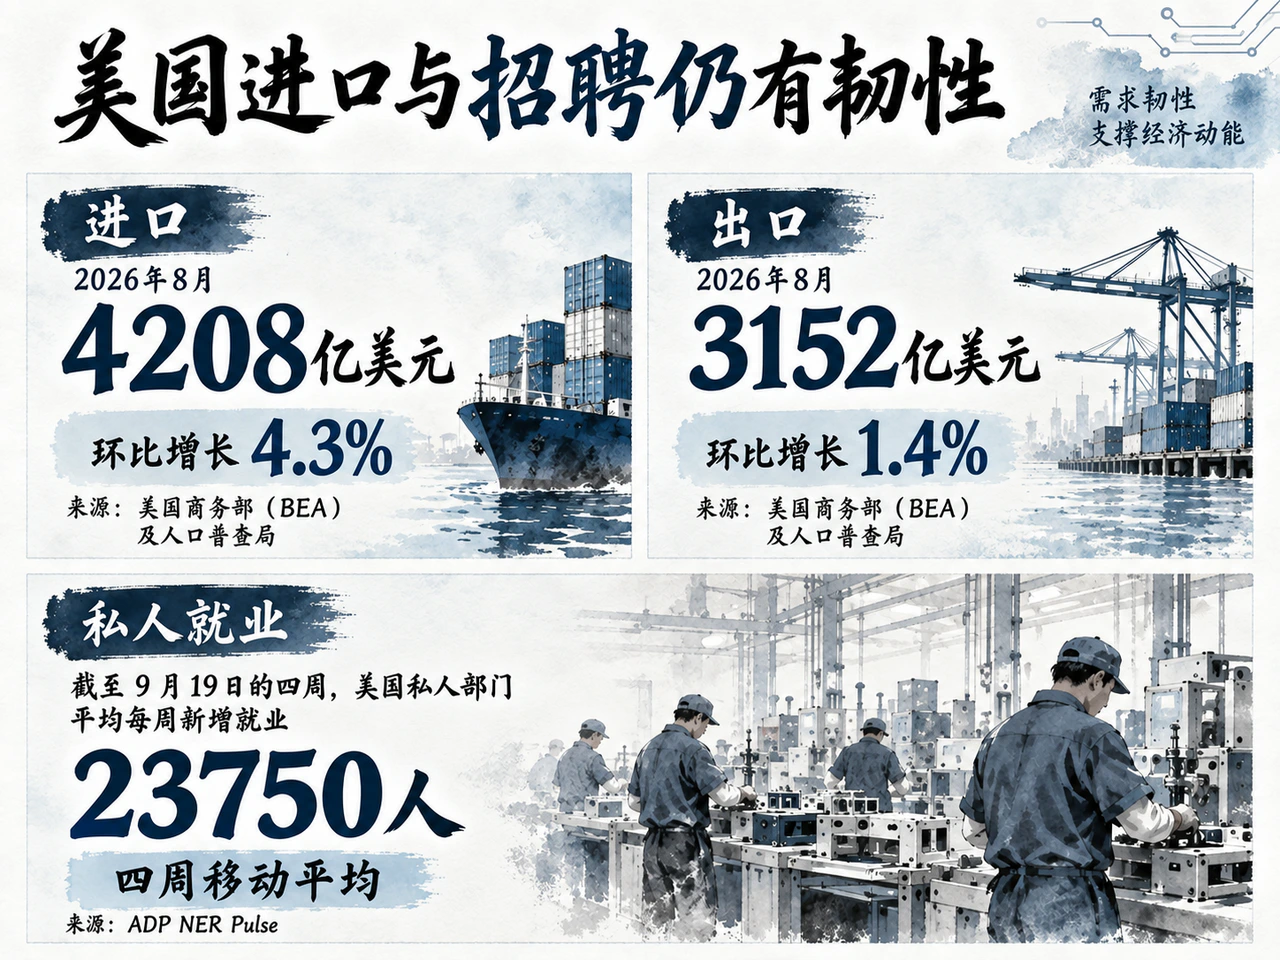
The day's new US data did not show clear demand cooling. The BEA and Census Bureau reported on October 6 that August's seasonally adjusted goods-and-services deficit was $105.6 billion, 13.7% wider than revised July and above the Reuters poll's $102 billion forecast. Imports rose 4.3% month on month to $420.8 billion and exports 1.4% to $315.2 billion.
Import composition was more informative than the deficit total. Under Census goods classifications, August capital-goods imports rose $6.2 billion from July, including $2.4 billion more semiconductors. Industrial supplies rose $9.1 billion, including $3.3 billion in crude and $3.1 billion in nonmonetary gold. Capital expenditure demand, energy and gold trading jointly affected the total; it cannot all be attributed to household consumption. Even after price adjustment, real goods imports rose 4.1% monthly, above real export growth of 1.3%.
The GDP drag from net exports must therefore be distinguished from domestic demand. Reuters cited economists estimating trade could subtract up to about 2.5 percentage points from third-quarter annualized real GDP growth, while most quarterly forecasts still exceeded 3%. Imports mean some spending goes to foreign production, not directly that US businesses and households buy less. Nonmonetary gold also receives special GDP adjustments, so the nominal deficit cannot directly translate into a quarterly growth drag.
Employment offered additional support. ADP's NER Pulse showed average private-sector job additions of 23,750 per week in the four weeks ending September 19, above the same report's 22,500 for the four weeks ending September 12. Hiring accelerated for a fifth consecutive week. This is a seasonally adjusted, revisable four-week moving average, not single-week or monthly payroll growth.
Resilient growth also leaves disinflation conditional. In an October 6 outlook, Peterson Institute economist Karen Dynan projected US real GDP growth of 2.3% in 2026, supported by consumption and AI investment. She forecast headline and core PCE inflation of 3.7% and 3.3% respectively in fourth-quarter 2026 versus the previous year's fourth quarter. Her subsequent disinflation view depended on gradually falling energy prices and monetary restraint on demand. Persistently high oil would make that condition harder to meet.
Earnings news supports large caps, without spreading to small caps
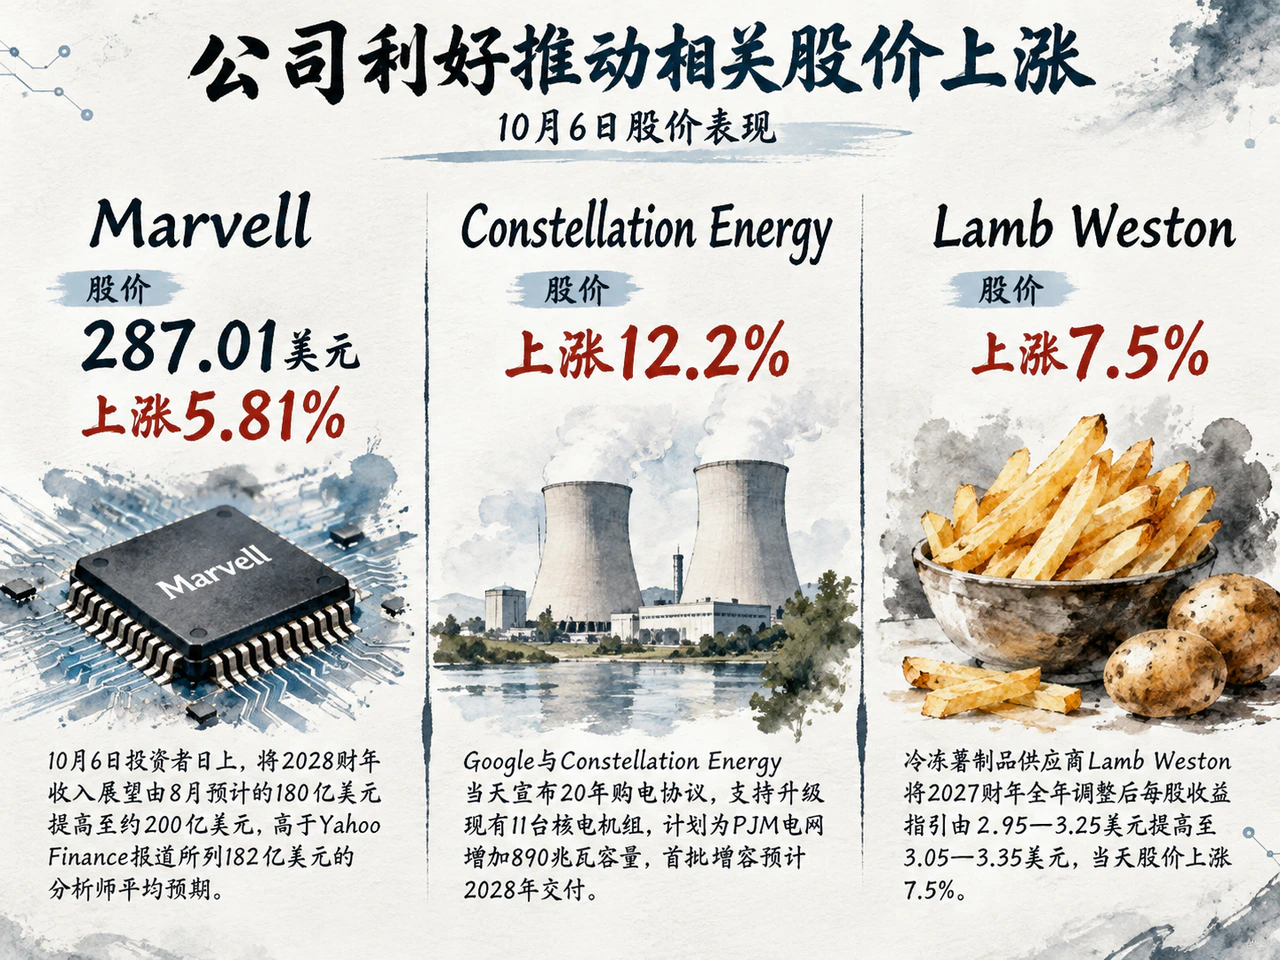
Company news provided more specific equity support than the coincident yield decline. At its October 6 investor day, Marvell raised fiscal 2028 revenue guidance from August's $18 billion to about $20 billion, above the $18.2 billion analyst average cited by Yahoo Finance. Its custom chips and high-speed connectivity for AI data centers made this a concrete example of computing-investment demand. Shares closed at $287.01, up 5.81%, although distant revenue guidance still required actual delivery and earnings realization.
AI investment also transmitted into electricity. Google and Constellation Energy announced a 20-year power purchase agreement supporting upgrades to 11 existing nuclear units and adding a planned 890 megawatts to the PJM grid, with initial uprates expected in 2028. The more than $4.3 billion in the announcement was Constellation's planned new investment, not the total Google contract price. The Associated Press reported Constellation Energy up 12.2% that day. Long contracts improved demand visibility, while new generation still required construction time.
Nontechnology companies also offered positive earnings news. Frozen potato supplier Lamb Weston raised fiscal 2027 adjusted EPS guidance from $2.95–$3.25 to $3.05–$3.35, lifting its stock 7.5%. Yet first-quarter net sales for the period ending August 30, 2026 rose only about 1% year on year to $1.670 billion, while adjusted EBITDA fell 5%. North American volume grew 7% and international volume fell 6%. Higher guidance can lift shares without demonstrating simultaneous improvement in demand and margins across regions.
Internal market performance preserved these differences. Dollar closing prices of technology, energy and financial sector ETFs rose 0.53%, 0.47% and 0.24% respectively on October 6; technology did not outperform the S&P 500. The VIX fell from 15.52 to 15.01, indicating lower S&P 500 option-implied volatility, but financials' lag and small-cap weakness did not signal a broad cyclical rotation. The Associated Press cited Barclays strategists as saying strong earnings were helping equities withstand high bond yields, a logic still dependent on subsequent results.
After the close, drinks company Constellation Brands further illustrated demand differences. It is separate from power company Constellation Energy. In its fiscal 2027 second quarter ending August 31, net sales rose 6% year on year to $2.633 billion and comparable EPS rose 3% to $3.74, but GAAP operating profit fell 8%. Brewer shipments rose 5.5%, while distributor shipments to retail customers fell 0.6%. This after-hours report cannot explain the preceding cash-market rally, and divergence along the sales chain still warrants caution on final demand.
Crude recovers its losses; energy-cost relief still requires implementation
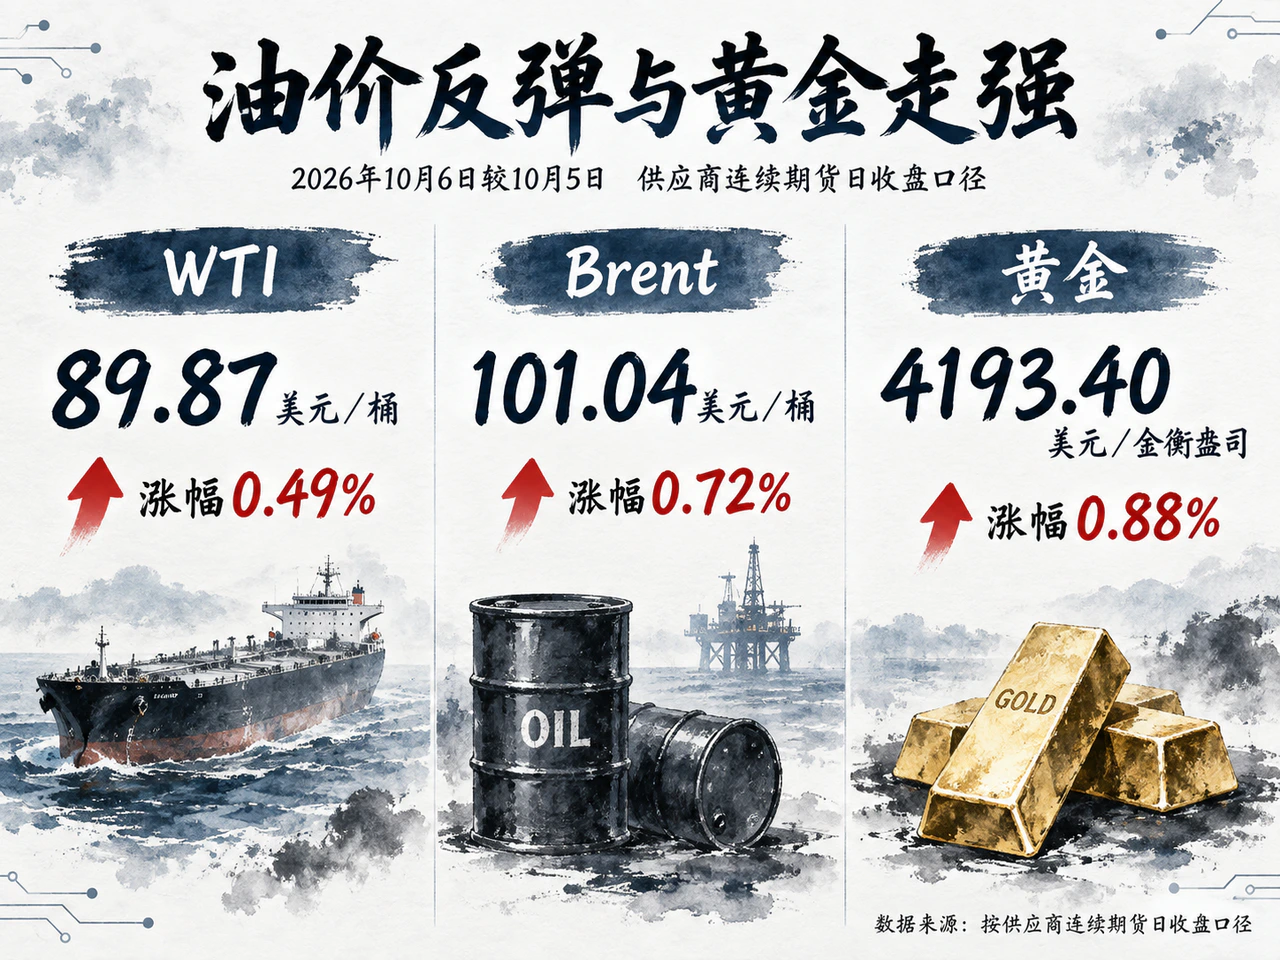
Oil failed to sustain its intraday decline. Using provider daily closes in Yahoo continuous futures, October 6 WTI was $89.87 a barrel, up $0.44 or 0.49% from October 5; Brent was $101.04, up $0.72 or 0.72%. These are not exchange settlements or fixed-delivery-month quotes. Bloomberg reported Brent down as much as 3.3% intraday before returning near $101. Intraday oil weakness may explain easing inflation fears during part of the session, but cannot alone explain the full-day Treasury rally.
Supply improvement and inventory draws coexisted. The EIA's October 6 monthly report estimated Middle Eastern crude shut-ins falling from 5.8 million barrels per day in August to 4.8 million in September, while insurance, rerouting and vessel constraints kept landed costs high. It projected average fourth-quarter global inventory draws of 700,000 barrels per day and raised its fourth-quarter Brent spot forecast by $14 to $105 a barrel. The qualification is that model inputs ended October 1, before the G7's October 2 announcement of additional reserve releases.
Policy was responding to fuel costs. Trump signed a diesel-tax relief executive order on the evening of October 5, directing the Treasury secretary to determine within five days whether statutory conditions were met. If so, authorized deferrals of specified diesel taxes incurred by eligible taxpayers from October 5 to December 31, and related relief, would follow. The measure could improve transport and agricultural operators' cash flow, but coverage and tax deadlines still awaited guidance; permanent exemption was not implemented. The G7's previously pledged 100 million barrels included crude and diesel. October 6 reporting showed product allocation and release arrangements remained unclear; the total cannot all be counted as diesel already in the market.
Gold benefited more directly from lower rates and the dollar. The dollar index fell 0.32% to 101.845 on the provider's October 6 daily close. Continuous gold futures on the same basis rose $36.60 or 0.88% to $4,193.40 per troy ounce. A weaker dollar reduced currency purchasing costs and a lower 10-year real yield reduced the opportunity cost of a non-interest-bearing asset, but one day's co-movement cannot establish each factor's contribution.
A republished Reuters interview released after the US close but before the reporting cutoff said Vance made a substantial reduction in Iranian nuclear enrichment capacity a condition for a deal. Subsequent energy-shipping risk remained linked to negotiations; this after-hours information cannot retroactively explain the day's closing prices.
Asian technology demand has support; financing improvement still depends on each company
US capital-goods imports and AI investment supported Asian export chains. On October 6, the World Bank forecast East Asia and Pacific growth of 4.5% in 2026, raising Vietnam, Malaysia and Thailand by 1.1, 0.7 and 0.7 percentage points to 7.4%, 5.1% and 2.0%, chiefly on high-tech manufacturing and exports. CNBC cited weak trade growth outside AI-related goods. The persistence of US technology investment and diffusion of returns to more industries still determined this growth source's stability.
Regional domestic demand also varied. The World Bank projected full-year 2026 Chinese growth of 4.4%. Local holiday consumption offered examples of policy-supported demand: on October 6, Greater Bay Area Economic Network cited Guangdong commerce authorities and other materials as saying monitored retail sales and catering revenue rose 7.5% and 6.7% year on year on October 1–3, while consumer trade-in programs generated RMB 2.159 billion in sales. These short-period provincial figures show some active transactions but cannot be extrapolated nationally or treated entirely as net new demand.
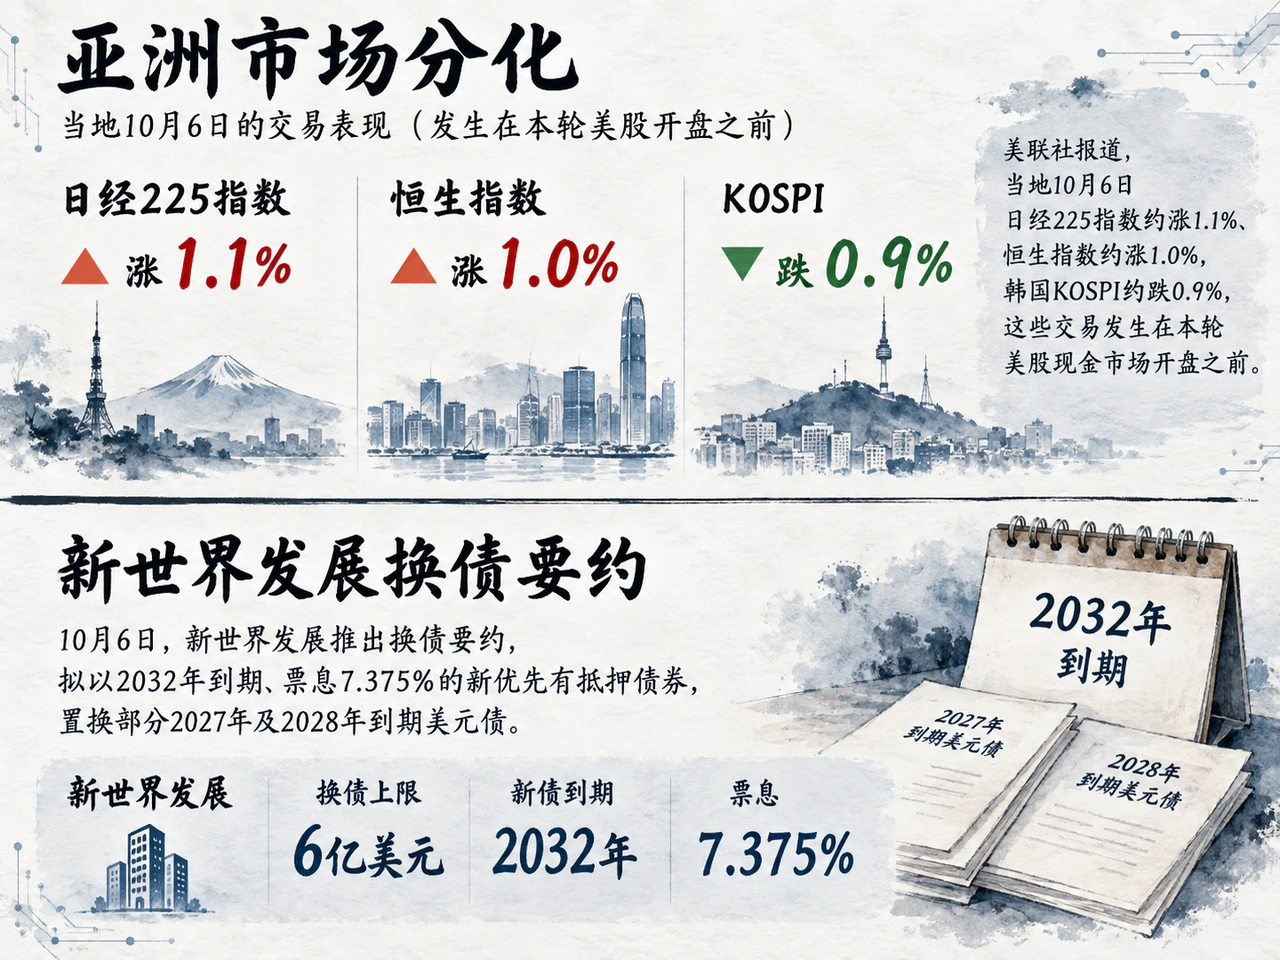
US equity gains' impact on Asian assets must also be separated by trading sequence and industry position. The Associated Press reported the Nikkei 225 up about 1.1%, Hang Seng up about 1.0% and KOSPI down about 0.9% on October 6 locally, before this US cash session opened. US AI-demand news conditionally supported Japanese equipment, Korean memory and Hong Kong technology growth stocks, but actual benefits still depended on orders, prices, costs and earnings. It did not directly predict simultaneous Asian gains.
Lower rates' help for dollar financing cannot replace credit assessment. New World Development launched an exchange offer on October 6 for new senior secured notes due 2032 with a 7.375% coupon, replacing some dollar bonds due 2027 and 2028. Reuters and Bloomberg reported about $991 million of old notes involved, with a $600 million cap and an October 20 expiry. It could defer some repayments but was not an equal amount of new cash and did not cover all relevant old debt. Security coverage, creditor ranking and final participation remained crucial.
US short-term funding also showed segmentation. Reuters reported on October 6 that October 5 3-month bill yields exceeded same-maturity OIS by nearly 10 basis points and 6-month bills by 11.3 basis points, while money-fund inflow and holdings growth slowed. If higher yields draw cash from repo into bills, dealer funding costs could face pressure; the report also said repo markets remained orderly then. Higher bond prices improved the rate environment, while capital allocation and individual issuers' repayment constraints still required separate assessment.


