On October 7, 2026, U.S. short- and long-term financing conditions continued diverging. The 2-year Treasury yield fell while 10- and 30-year yields rose; large equity indices slipped, small caps and homebuilders fell more, and gold lost over 1%. The common constraint was that a potentially slower near-term hiking pace did not mean lower long-term funding costs. Household borrowing demand was already affected, while business expansion required stronger earnings and cash flow to cover financing.
It was not a day of blanket risk aversion. Strong 10-year auction demand eased intraday selling, the VIX rose only slightly, and the latest monthly gold ETF figures still showed inflows. By the morning of October 8 Beijing time, after-hours earnings and Samsung's preliminary results added another distinction: delivery of demand and sustainable revenue matter alongside funding prices.
Short Treasury yields ease; the long end still faces capital demand
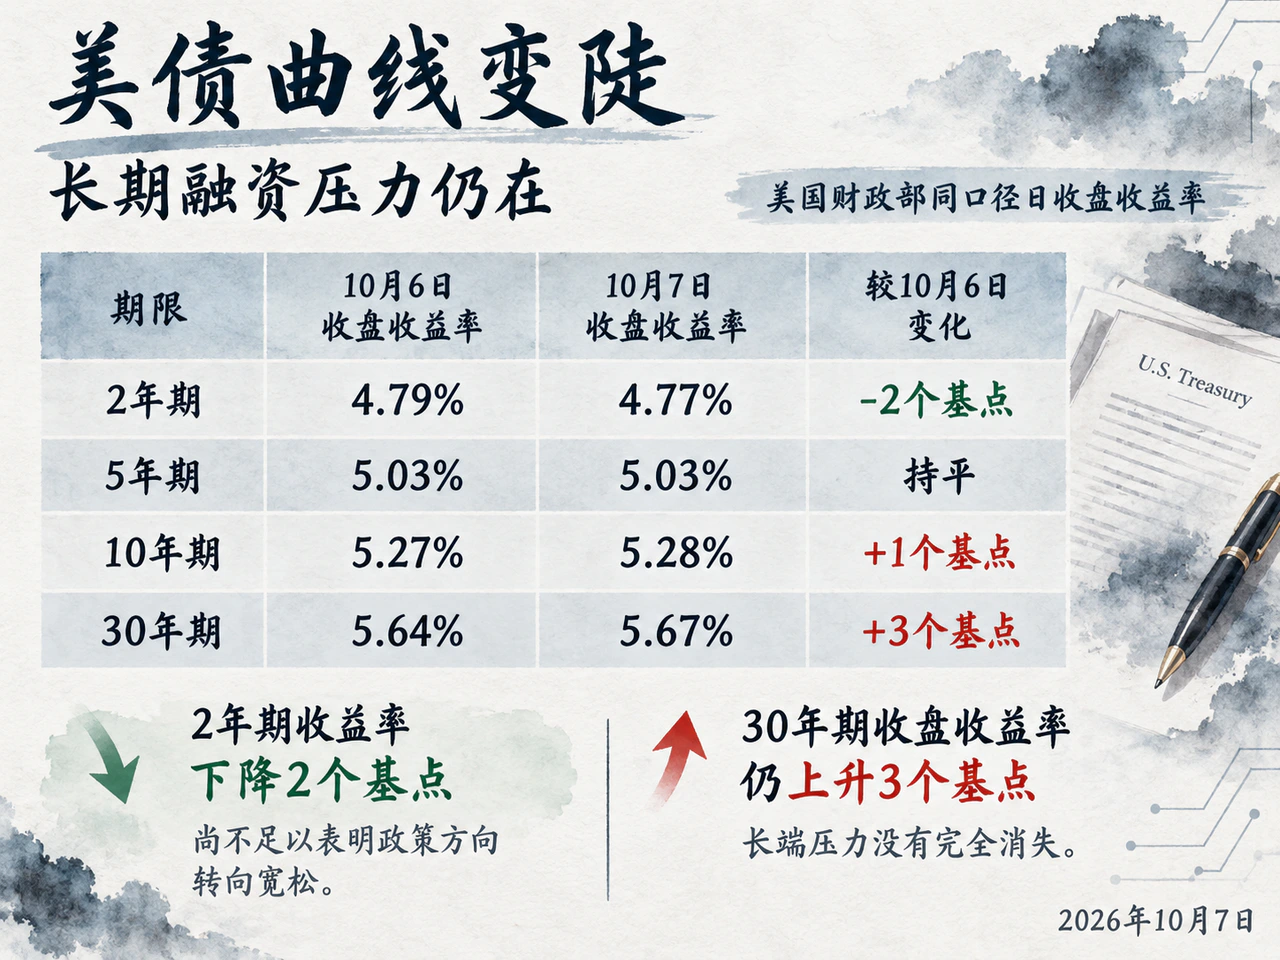
The U.S. Treasury's consistent daily curve changed as follows from October 6 to 7. One basis point equals 0.01 percentage point.
| Maturity | October 6 | October 7 | Daily change |
|---|---|---|---|
| 2-year | 4.79% | 4.77% | -2 basis points |
| 5-year | 5.03% | 5.03% | Unchanged |
| 10-year | 5.27% | 5.28% | +1 basis point |
| 30-year | 5.64% | 5.67% | +3 basis points |
The 10-year/2-year spread widened from 48 to 51 basis points and the 30-year/5-year spread from 61 to 64. Steepening combined falling short yields with rising long yields; pressure centered on long-term capital costs and cannot broadly be described as a general increase in expectations for imminent hikes.
The front-end move was consistent with views on timing. Reuters reported investors leaning toward no October change and a December increase. Minutes of the September 15–16 Fed meeting, released that day, showed most participants still considered another increase before year-end potentially appropriate. A 2-basis-point decline in the 2-year did not establish a shift toward easing.
Intraday long-end pressure was more pronounced than closing figures suggest. Reuters reported the 10-year touching 5.364% before retreating after a $39 billion reopening. The auction yield was 5.300%, bid-to-cover 2.77 versus the preceding six-auction average of 2.54, and dealers took only 2.5%. TD Securities rates head Gennadiy Goldberg said strong end-investor demand eased absorption concerns. High yields attracted buying, but the 30-year still closed up 3 basis points, leaving long-end pressure unresolved.
Corporate financing provides one specific source of capital competition. After the October 6 U.S. close, Reuters cited the Financial Times as saying SpaceX planned to raise $40 billion for Nvidia chips, about $10 billion in bank loans and $30 billion in investment-grade debt, expected in 2027. The proposed financing was not actual issuance, but showed AI expansion may increase long-term capital demand alongside equipment demand. The planned $22 billion 30-year Treasury auction on October 8 would further test whether high yields attract enough buyers.
Long-end changes were not entirely higher inflation compensation. The Treasury's 10-year real yield rose from 2.91% to 2.92%, matching the nominal 1-basis-point increase. Their difference remained 2.36%. This spread includes inflation compensation and liquidity factors and cannot be directly decomposed further into policy expectations and term premium. It nevertheless limits the claim that the day's long-yield rise was entirely driven by inflation fears.
Household financing weakens while near-term inflation expectations rise
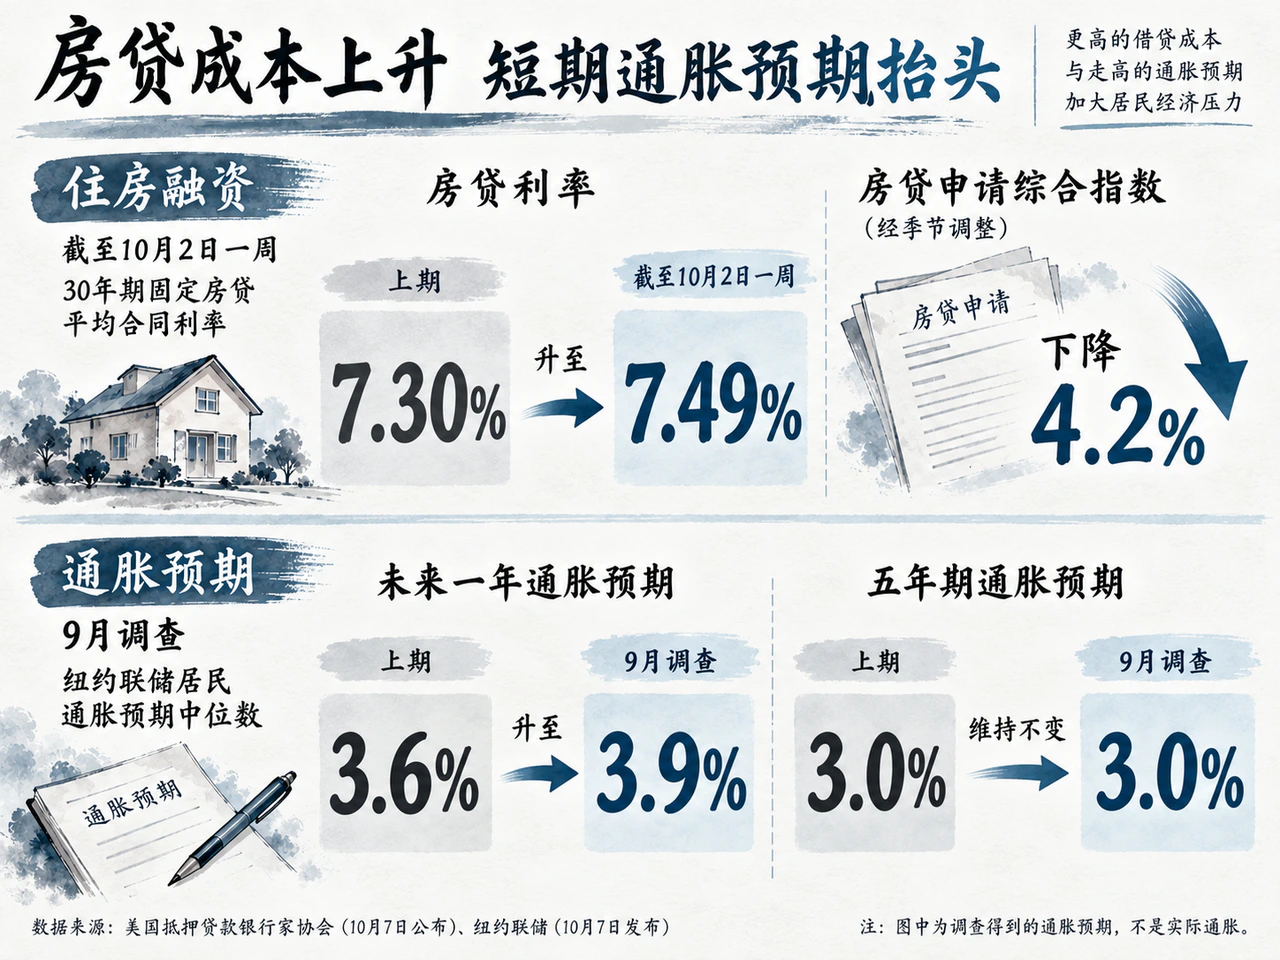
Long-rate constraints had reached households. MBA figures released October 7 showed the average contract rate on conforming 30-year fixed mortgages rising 19 basis points from 7.30% to 7.49% in the week ending October 2. The seasonally adjusted application composite fell 4.2%, with purchase applications down 2% and refinancing down 8%. Deputy chief economist Joel Kan cited both higher Treasury yields and wider mortgage spreads. Falling applications indicate financing pressure, rather than an equal realized decline in home transactions.
The Fed's August consumer-credit release also showed slower expansion. Seasonally adjusted annualized growth fell from July's revised 4.1% to 1.9%; monthly additions converted from the official flow table fell from about $17.7 billion to $8.3 billion. Revolving credit contracted at a 4.2% annual rate, while nonrevolving credit grew 4.1%. These figures exclude real-estate mortgages. Revolving declines can reflect both less borrowing and greater repayment; one month is insufficient to establish a consumption recession.
Price expectations moved the other way. The New York Fed's September survey, released October 7, showed median one-year inflation expectations rising from 3.6% to 3.9% and three-year expectations from 3.2% to 3.3%, while five-year expectations stayed at 3.0%. These are future-price expectations, not realized CPI. Expected nominal spending growth rose to 5.5%, against expected income growth of 3.1%, and assessments of finances weakened: higher nominal spending need not mean more real consumption.
Countervailing evidence was that job and repayment expectations did not deteriorate broadly. Mean perceived probability of job loss within a year fell from 13.8% to 13.5%, and the mean chance of missing minimum debt payments within three months fell 1 percentage point to 12.2%. Stable five-year inflation expectations also argue against treating the survey as evidence of unanchored long-term expectations.
This divergence explains why policy cannot quickly ease. In September's minutes, some participants worried about localized energy shocks spreading; others focused on persistent inflation from stronger-than-expected demand. The minutes also noted pressured housing finance but continuing support to growth from business finance, investment and equity wealth. Household slowing matters, but cannot be extrapolated directly into a clear economy-wide demand contraction.
Limited index losses mask greater pressure on financing-sensitive industries
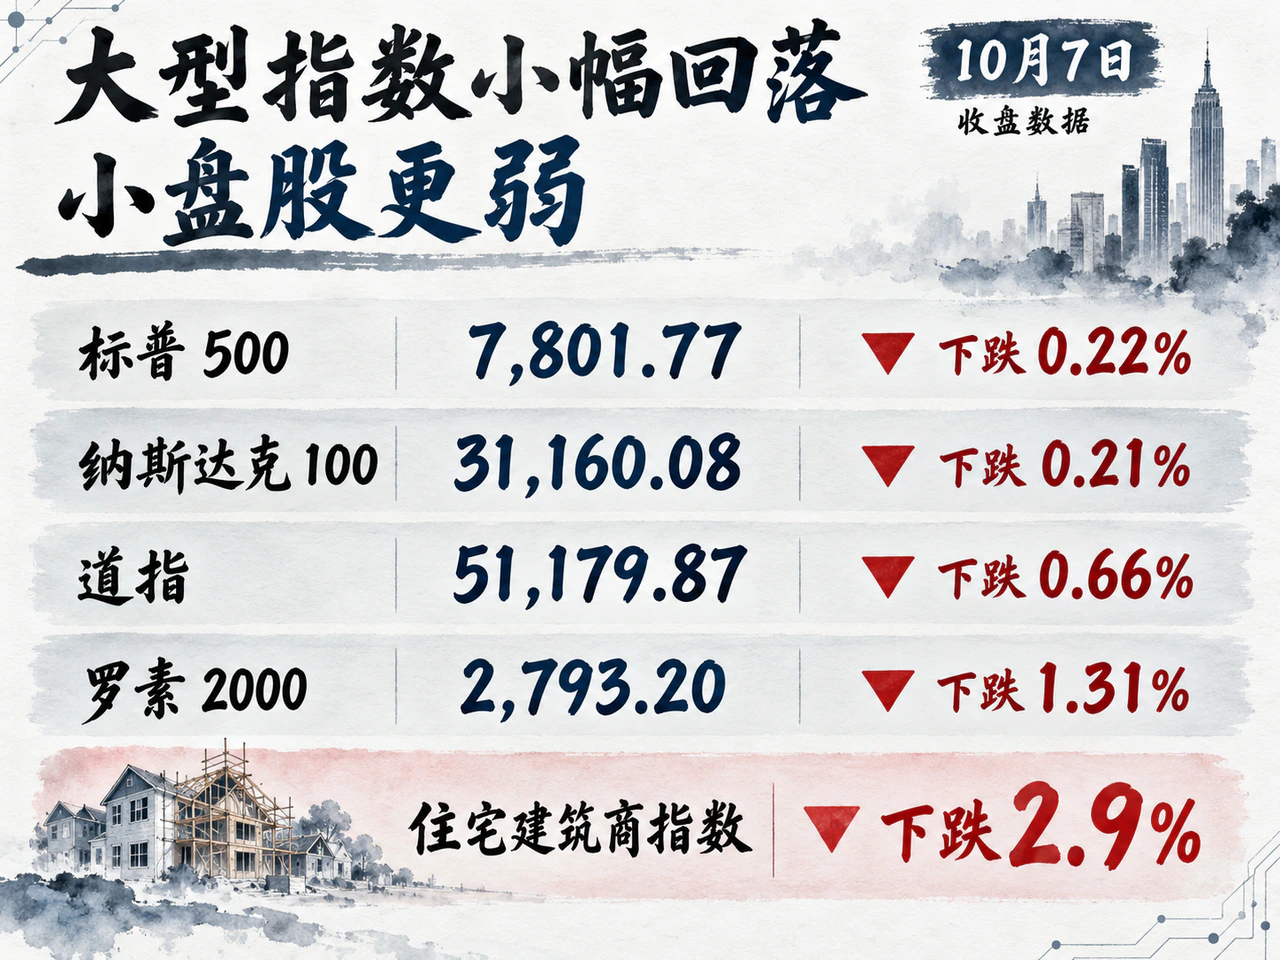
On October 7, the S&P 500 closed at 7,801.77, down 0.22%; Nasdaq 100 at 31,160.08, down 0.21%; Dow at 51,179.87, down 0.66%; and Russell 2000 at 2,793.20, down 1.31%. Small caps notably underperformed.
Weakness was broader than index declines. Reuters' closing report showed decliners outnumbering advancers 3.34 to 1 on the NYSE and 2.37 to 1 on Nasdaq. Homebuilders fell 2.9%, semiconductors 1.2%; industrials led S&P 500 sector losses and healthcare led gains. Housing and small-cap weakness fits high funding costs, though sector performance cannot prove rates caused every loss. The VIX rose only 0.07 point to 15.08, and long yields retreated after the auction, insufficient grounds to call the session a general panic.
Applied Digital's after-hours results shifted the AI discussion toward revenue composition and financing burdens. For fiscal first-quarter 2027 ending August 31, revenue was $341.9 million, up 322% year on year, and loss from continuing operations attributable to common shareholders was $221.0 million. Of $262.6 million high-performance-computing hosting revenue, $65.8 million was base rent and $183.5 million tenant fit-out services. Interest expense rose from about $8 million to $77.4 million.
Operating capacity and rental revenue show demand beginning to materialize, but fit-out service revenue cannot all be treated as stable recurring rent. Whether larger AI infrastructure becomes shareholder returns also depends on recurring income, further spending and interest burdens. These were new after-hours disclosures and cannot retrospectively explain the day's closing losses.
Levi Strauss's after-hours results showed another earnings divergence. Fiscal third-quarter 2026 ending August 30 brought net revenue of $1.610 billion, up 4%, while U.S. revenue fell 1%. Full-year adjusted EPS guidance rose from $1.46–$1.52 to $1.54–$1.56, but tariff refunds net of reinvestment contributed $0.11 per share in the quarter. Higher guidance matters, but cannot all be read as stronger final consumption.
Oil benchmarks diverge; gold faces holding-cost pressure
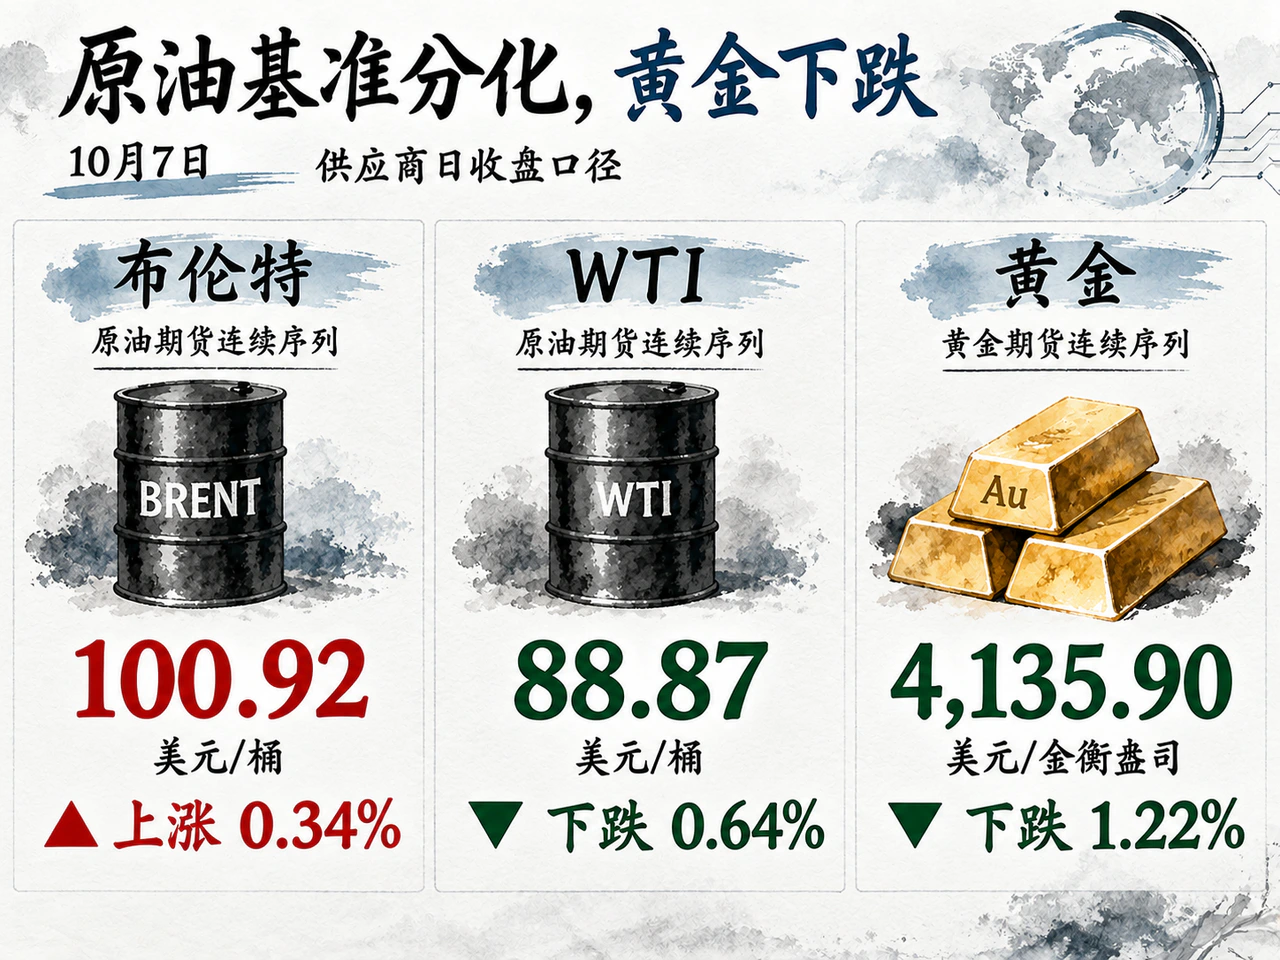
Vendor daily closes on October 7 put Brent continuous futures at $100.92 a barrel, up 0.34%; WTI at $88.87, down 0.64%; and gold continuous futures at $4,135.90 per troy ounce, down 1.22%. These are vendor closes of continuous series, without matching delivery months, rather than exchange settlement prices.
Oil faced both faster reserve deliveries and falling inventories. IEA members agreed October 7 to accelerate releases already committed in March and prioritize diesel where possible. Reuters said about 100 million barrels remained to enter the market. JPMorgan likewise interpreted this as faster existing delivery, so the entire amount cannot be counted again as new intervention. Again Capital partner John Kilduff argued European stock releases could reduce extra demand for U.S. supplies, offering one explanation for WTI's relative weakness.
EIA figures showed U.S. commercial crude stocks excluding the strategic reserve down 3.2 million barrels to 424.1 million in the week ending October 2, versus a Reuters survey expecting a 1.7 million-barrel build. Crude remained about 1% above the five-year seasonal average, while gasoline and distillates were about 6% and 12% below it. Four-week distillate product supplied, a demand proxy, fell 1.6% year on year. Low inventories can coexist with weak demand; stock levels alone establish neither demand growth nor a supply gap. Iran-related shipping and refining support for oil still depends on transport disruption and the pace and product mix of actual reserve deliveries.
Gold faced different constraints. The vendor dollar-index close rose 0.41% to 102.25, and the 10-year real yield reached 2.92%, increasing non-dollar buyers' costs and the opportunity cost of non-interest-bearing gold. Both channels align with falling prices, but a real-yield rise of only 1 basis point cannot explain the full gold decline alone.
World Gold Council data released October 7 offered contrary evidence. Global physically backed gold ETFs took in $10 billion in September and $31 billion in the third quarter. September holdings rose 67 tonnes to 4,256 tonnes, while assets under management fell 7% monthly. COMEX managed-money net longs fell by the equivalent of 84 tonnes to 387 tonnes. ETF accumulation and declining futures longs show divergent investor adjustments; the day's gold fall cannot establish a broad reversal in allocation demand.
European fiscal resistance and dollar-credit constraints reinforce each other
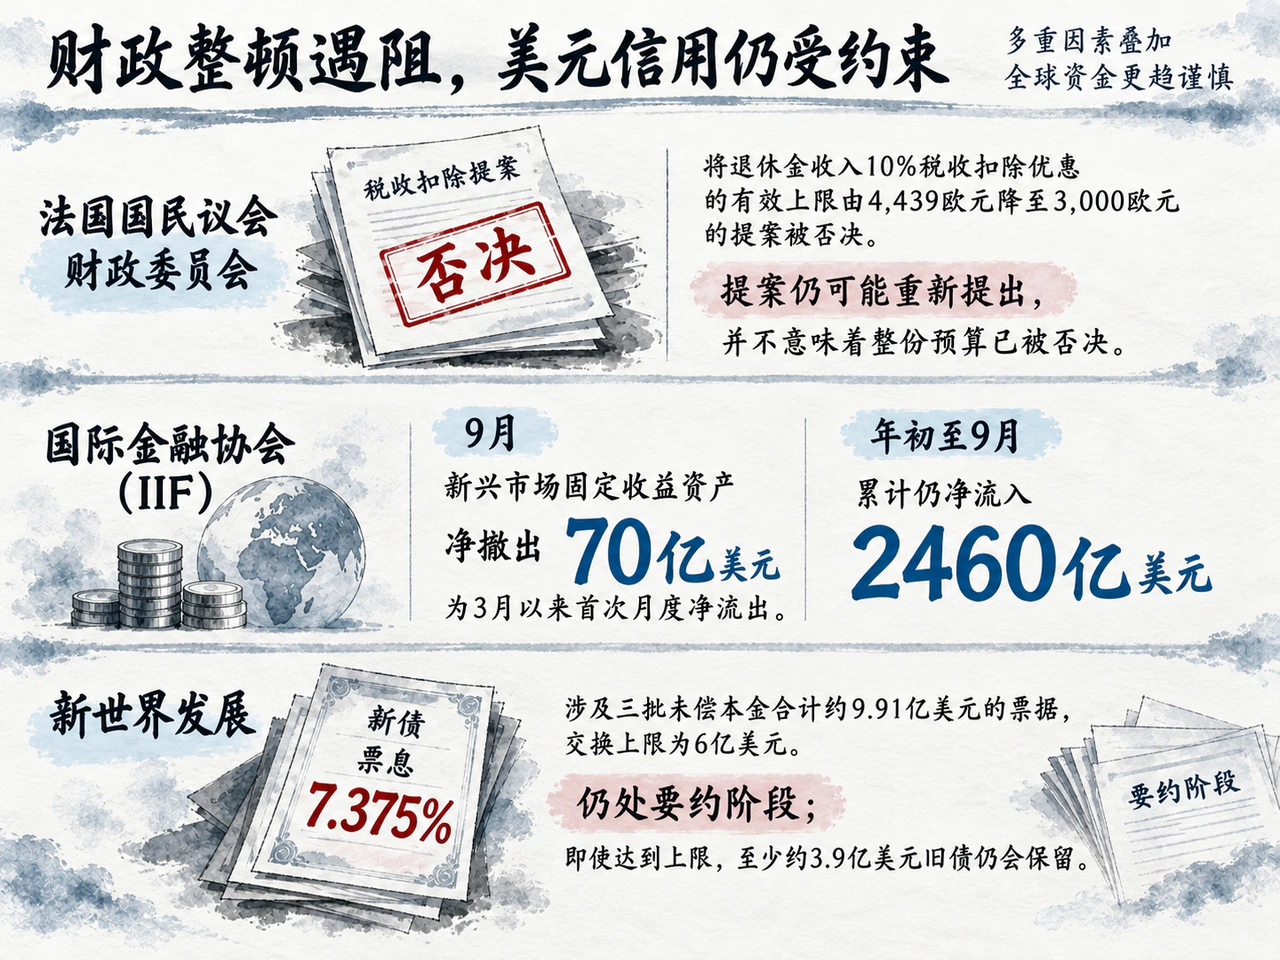
High financing costs also complicate fiscal adjustment. Reuters reported October 7 that France's National Assembly finance committee rejected a proposal to lower the effective cap on the 10% pension-income tax deduction from €4,439 to €3,000. The government planned €43 billion of savings to reduce the deficit from 5.4% of GDP in 2026 to 5% in 2027. This early vote showed resistance to specific savings, but the proposal could return; the entire budget had not been rejected.
Fiscal worries connected with bank shares. Reuters' intraday report showed European banks down about 3.5%, with Société Générale, Deutsche Bank, UniCredit and Intesa Sanpaolo each down over 4%. Traders cited French spillover, losses on sovereign holdings and property exposure. These were intraday moves, and energy prices and global bond selling also mattered; the whole decline cannot be attributed to one committee vote.
Italy's economy minister asked the EU that day to consider inflation and energy shocks when assessing budget deviations. IMF Managing Director Georgieva urged credible medium-term consolidation in highly indebted economies. One sought policy room, the other financing credibility; both reflected constraints among energy costs, fiscal spending and rates.
Dollar credit also requires separating monthly weakness from the annual trend. Reuters cited an IIF report released October 7 showing $7 billion of nonresident outflows from emerging-market fixed income in September, the first monthly outflow since March, but year-to-September inflows still totaled $246 billion. The month signals tighter conditions, not continuous full-year withdrawal. If Treasury benchmarks stay high and spreads cannot narrow sufficiently, issuer costs will struggle to fall materially.
New World Development's exchange offer launched October 6 provides a Hong Kong refinancing example. Lianhe Zaobao cited Bloomberg as reporting three note series totaling about $991 million outstanding, a $600 million exchange cap, and new 7.375% senior secured notes with cash payments. The arrangement remained an offer; even at the cap at least about $390 million of old debt would remain. Longer maturities and extra security ease some pressure, but remaining maturities and creditor ranking still determine risk.
Asia must assess earnings, currencies and domestic demand separately
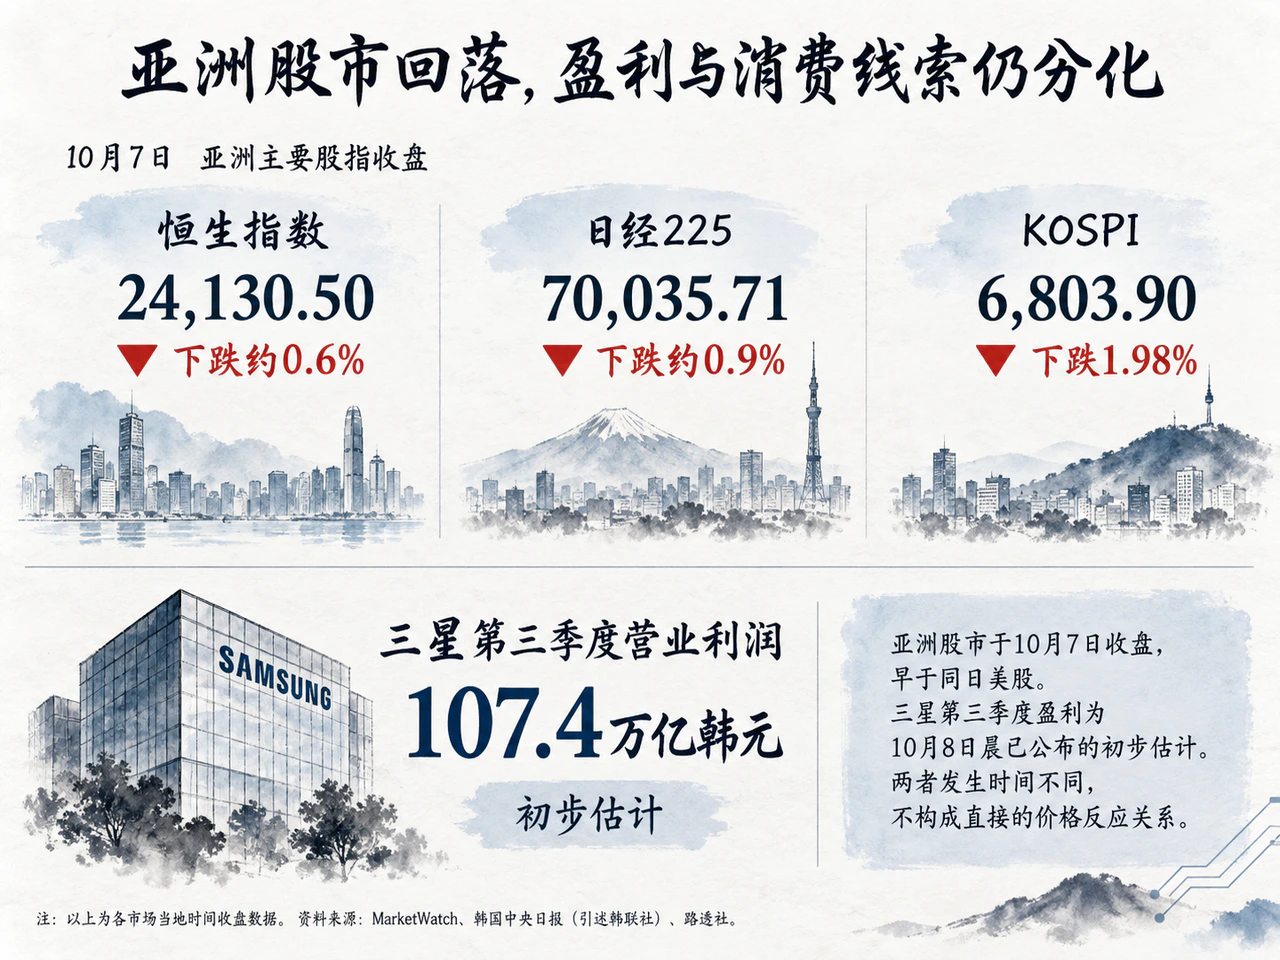
Asian equity closes on October 7 preceded that day's U.S. trading. MarketWatch reported Hang Seng at 24,130.50, down about 0.6%, and Nikkei 225 at 70,035.71, down about 0.9%. JoongAng Ilbo, citing Yonhap, reported KOSPI at 6,803.90, down 1.98%. These cannot be described as reactions to the later U.S. decline.
By the morning of October 8 Beijing time, Samsung's preliminary results added new information. Reuters reported expected third-quarter 2026 operating profit of KRW 107.4 trillion, above LSEG SmartEstimate's KRW 106.1 trillion, with revenue of KRW 195 trillion, up 127% year on year. These remained preliminary estimates; detailed segment results were scheduled October 29. They independently support memory-chip demand, but subsequent margins and market reactions must test whether they offset global valuation pressure.
Currencies differed too. October 7 vendor closes showed USD/JPY up to 158.296 and USD/KRW down to 1,339.74, meaning a weaker yen and stronger won. Effects on exporters' local-currency revenue translation may therefore oppose each other, depending on revenue mix and hedging; Asian assets cannot all be assigned one uniform dollar shock.
China's releases mainly concerned reserve valuation and holiday consumption. SAFE reported September-end reserves of $3.4003 trillion, down $38.1 billion or 1.11% from August, attributing the change to currency translation, asset prices and other factors. A lower reserve stock cannot directly be read as equivalent capital outflow or intervention.
Xinhua cited Commerce Ministry data showing October 1–6 sales on key platforms up 130% year on year for embodied-intelligence robots, 100% for smart glasses and 10.4% for outdoor sports equipment. These active niches do not represent nationwide retail growth. Guangzhou received 16.05 million holiday tourist visits and RMB 14.5 billion in tourism and cultural spending, up 5.5% and 5.9% on a consistent basis. Calculated average spending per visit rose about 0.4%, so total growth accompanied mainly higher traffic.
Implications for Asian assets must therefore be tied to earnings sources. Korea's memory chain has new earnings support; Japanese equipment and materials firms still need capex to turn into orders; Hong Kong growth shares face both global discount rates and their own demand changes. Elevated long rates are a shared constraint, but earnings delivery and demand differences can still produce divergent performance.


