Large US technology companies' real growth contribution, investment sustainability and market risks | Through the early hours of October 9, 2026, Beijing time
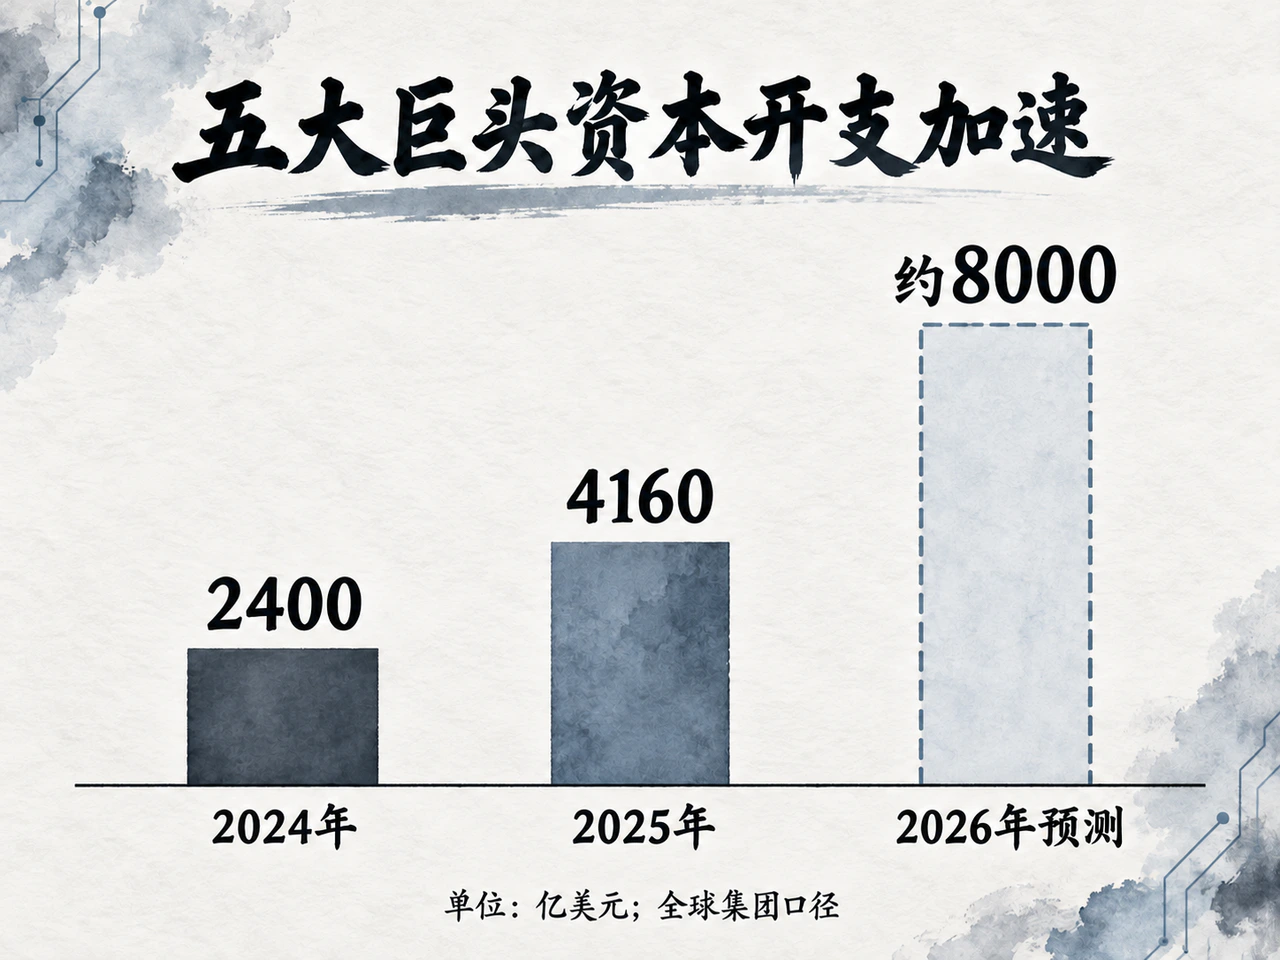
In the first half of 2026, Microsoft, Alphabet, Amazon and Meta together paid $294.8 billion in cash for property and equipment, exceeding their combined full-year 2024 total of $228.3 billion in just six months. Computing infrastructure is rapidly consuming these giants' operating cash flow and closely linking US economic growth to a handful of technology companies' capex decisions.
Corporate investment, GDP accounting and stock-market pricing follow very different processes. An expensive imported server may consume substantial cash at a US company while most hardware-manufacturing value added accrues to overseas suppliers. A data center under construction can stimulate domestic building and electrical-equipment demand today, while years of expected returns may already be reflected in equity valuations. The same flow of money carries very different weights in national accounts and financial markets.
Major technology companies' capital expansion has become an important marginal support for US growth. But as capex keeps outpacing operating cash flow, sustained expansion increasingly depends on end-market monetization and continued debt financing. A future capex slowdown would necessarily weaken momentum, yet a slowdown in corporate investment must traverse distinct transmission chains to become a material macroeconomic deceleration and then systemic financial risk. The most vulnerable interval is when infrastructure's construction stimulus starts fading before productivity gains spread broadly, while earnings expectations and credit conditions simultaneously come under pressure.
I. Hardware imports and inflation dilute the stimulus as AI-related investment's gross contribution to real GDP begins slowing
1. Six-month spending exceeds all of 2024, but global bills are not US domestic increments
On a consistent calendar-year basis, using gross cash-flow-statement purchases of property and equipment and excluding newly added finance-lease assets, the four giants invested $376.1 billion in 2025, up 64.7%. First-half 2026 growth accelerated to 84.1%, taking six-month spending to $294.8 billion. This measure captures actual cash payments for AI computing, cloud infrastructure, global logistics networks and supporting facilities.
| Company | Full-year 2024 | Full-year 2025 | First half 2025 | First half 2026 |
|---|---|---|---|---|
| Microsoft | 556 | 831 | 338 | 667 |
| Alphabet | 525 | 914 | 396 | 806 |
| Amazon | 830 | 1318 | 572 | 984 |
| Meta | 373 | 697 | 295 | 491 |
| Total | 2283 | 3761 | 1601 | 2948 |
Unit: US$100 million; gross cash purchases of property and equipment on a consistent calendar-year basis, with Microsoft converted from fiscal-year data. Rounding may cause minor differences from totals.
Assessing US domestic investment requires further boundary adjustments. Goldman Sachs Research estimated in August that 2026 global AI-related investment would be approximately $1 trillion, of which about $581 billion would occur in the US, equivalent to 1.8% of US nominal GDP. The estimate expands sample coverage, subtracts a non-AI spending baseline and allocates investment by its actual location.
The $581 billion represents nominal investment demand within the US, including imported equipment, rather than an equal amount of new domestic value added. The 1.8% measures investment's scale relative to GDP, not a 1.8-percentage-point contribution to that year's real GDP growth. Actual growth stimulus depends chiefly on the increment in current domestic production.
2. From corporate cash flow to national accounts: import deductions and capitalized R&D reshape the stimulus
US GDP measures new production within US geographic borders. Overseas data-center construction and installation primarily enter the host country's GDP; only domestic facilities, installation and associated professional services directly create US value added. Land purchases and transfers of existing assets between companies represent ownership changes, not an equivalent amount of new output.
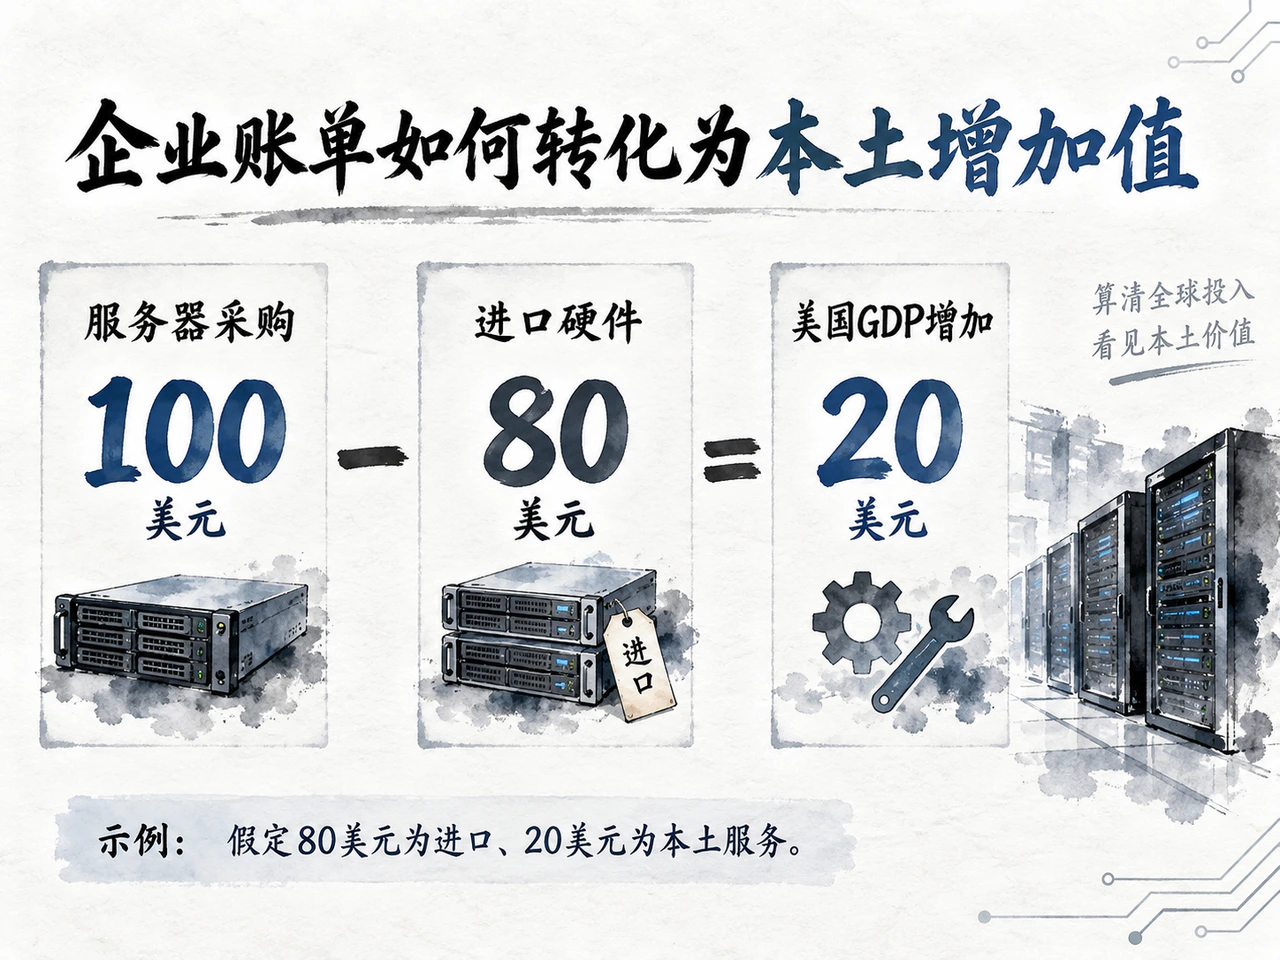
High equipment-import content is the most important deduction. Suppose a $100 server purchase includes $80 of imported core hardware and $20 of US assembly, transport and commissioning. Investment rises $100 but imports rise $80, leaving only $20 of current US GDP value added. Imports expand the US capital stock, while manufacturing value added belongs overseas. Value US companies create in chip design, architecture R&D and sales support must be attributed to where production actually occurs; an equipment item's entire selling price cannot be counted as domestic output simply from the company's domicile.
Leasing and R&D accounting make adjustments in the opposite direction. If a third-party developer builds a data center and leases it long term to a technology company, national accounts recognize the developer's fixed-capital formation, avoiding double counting by lessor and lessee. Qualifying software development and R&D are also intellectual-property investment in GDP even when some R&D is expensed in corporate accounts. Simply summing listed companies' cash capex can therefore overstate domestic stimulus by including overseas spending and imported equipment, while understating knowledge-capital accumulation by omitting capitalized R&D.
Cash payments and physical construction also differ in timing. GDP recognizes capital formation with construction progress and physical equipment delivery, while prepayments, trade credit and settlement terms move cash flows earlier or later. Amazon's property and equipment acquired but not yet paid for rose by approximately $20.6 billion in first-half 2026, indicating substantial acquired assets not yet reflected in current cash outflows. Those payables become firm future cash-flow obligations.
These fundamental differences mean real economic contribution must be assessed through underlying equipment, construction, software and trade data. Corporate accounts reveal investment appetite and liquidity pressure; national accounts measure actual domestic output. The two must be cross-checked.
3. After imports, quarterly support fluctuates by tens of basis points; real computer and peripheral investment growth turns negative in Q2
A framework published by Fed researchers in July combines contributions from software, data centers, electric utilities, computers and peripherals, then applies weighted net-export adjustments based on trade flows. This AI-related proxy shows a gross contribution of approximately 0.75 percentage points in fourth-quarter 2025, offset by 0.61 points from associated net imports, leaving just 0.14 points. First-quarter 2026 gross contribution was 1.18 points, or 0.73 after trade adjustment.
| Quarter | Related investment: gross contribution | Related net-export adjustment | Adjusted contribution |
|---|---|---|---|
| 2025 Q1 | 0.99 | -0.49 | 0.50 |
| 2025 Q2 | 1.02 | -0.01 | 1.01 |
| 2025 Q3 | 0.43 | -0.01 | 0.42 |
| 2025 Q4 | 0.75 | -0.61 | 0.14 |
| 2026 Q1 | 1.18 | -0.45 | 0.73 |
Unit: percentage-point contribution to quarter-on-quarter annualized real GDP growth. July 2026 Fed research version, summing published components. Scope includes non-AI uses; trade allocation depends on weighting assumptions.
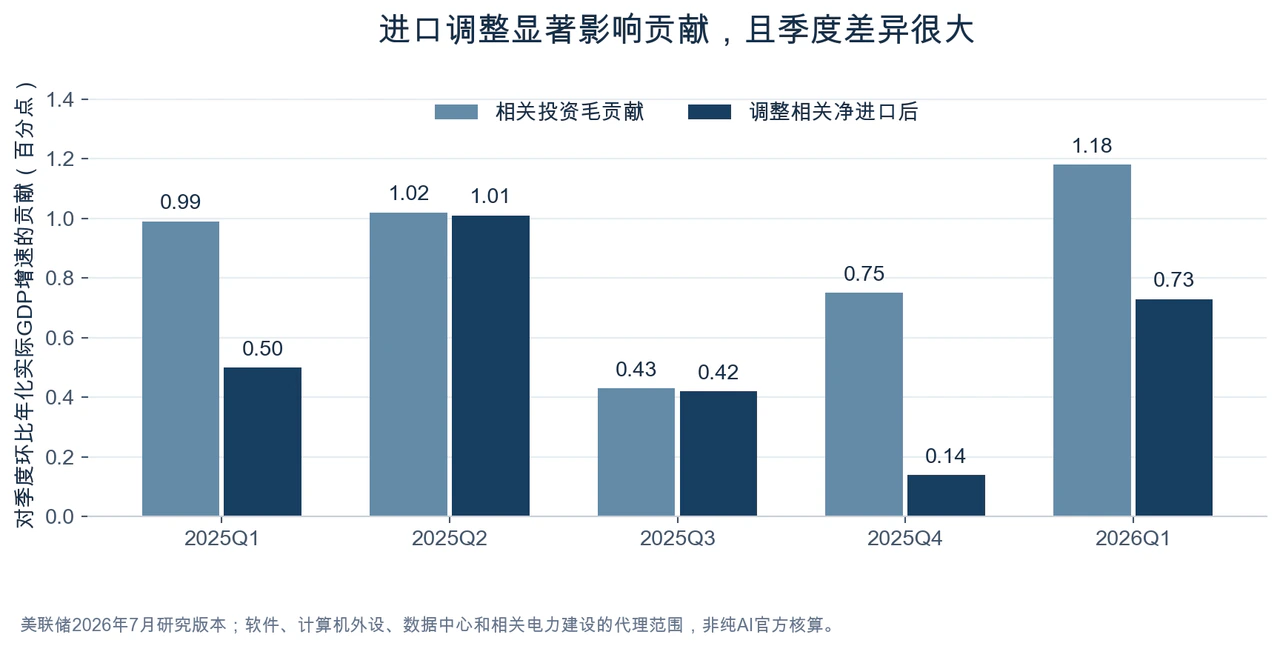
The figures show AI-related investment providing several tens of basis points of substantive US growth support across multiple quarters, and about 1 percentage point in some quarters, but with a substantial offset from equipment imports. Data-center civil construction alone contributes relatively little to quarterly growth; high-value-density servers and computing chips mostly enter equipment investment. Tracking only building work would severely understate total capex.
Official macro data aggregate by product, so software, power facilities and computing equipment include substantial traditional non-AI uses. Corporate disclosure of capital destinations and end uses is incomplete, producing differences among institutional estimates. A broader St. Louis Fed model including all R&D estimated average annualized gross contribution of 0.97 percentage points over the first three quarters of 2025. Morningstar's adjustment of official data put full-year 2025 contribution near 0.4 points. Coverage, trade-adjustment coefficients and time horizons chiefly explain the differences.
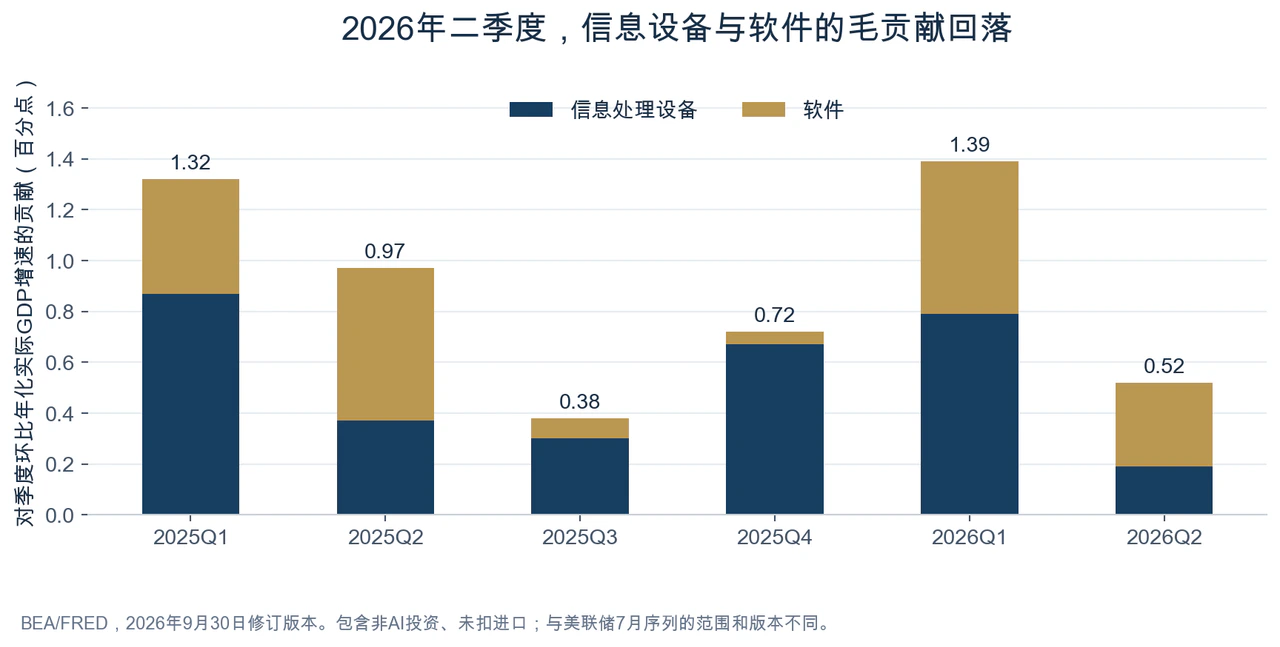
Latest macro data clearly confirm weakening marginal support. BEA revisions released September 30 showed information-processing equipment and software together contributing 1.39 percentage points to first-quarter 2026 annualized real GDP growth, falling sharply to 0.52 points in Q2. Both are broad gross measures before import deductions; overall real GDP growth was 2.5% and 2.2%, respectively.
The divergence between nominal spending and real output deserves particular caution. In Q2 2026, nominal US computer and peripheral investment rose approximately 5.1% quarter on quarter, but a roughly 7.0% rise in the relevant capital-goods price index meant real investment fell about 1.7%. Its contribution to annualized quarterly GDP growth turned negative at -0.09 percentage points. Corporate nominal bills kept growing while real equipment-investment flows declined sequentially. Software development, other specialized information equipment and data-center infrastructure nevertheless behaved differently; localized weakness had not become a systemic contraction in the overall investment cycle.
This explains how fast technology capex growth coexists with weakening marginal GDP support. Inflation affects nominal spending, while real growth depends on additional physical equipment and services after price adjustment. High annual investment flows can maintain existing output levels; only further increases in real investment add fresh growth stimulus.
4. Infrastructure spending rises first; broad productivity diffusion still faces a time-lag test
Construction and hardware deployment create effective investment demand immediately. Once infrastructure operates, domestically produced AI-service value added enters GDP through enterprise software, digital-service exports, household consumption and productivity improvements in traditional downstream industries. Cloud providers charging foundation-model companies, then model companies charging end-industry customers, constitute successive production stages. GDP value-added accounting must subtract intermediate inputs at each stage rather than simply add all revenues.
Long-run growth ultimately depends on whether new capital materially raises economy-wide productivity. Advanced servers improve individual computing capacity, but real-economy businesses must complete data governance, workflow redesign, application adaptation and organizational adjustment before local efficiency gains become macro productivity improvements. A July Fed study said task-specific efficiency gains had not yet appeared broadly in aggregate productivity data. Governor Cook similarly said in September that complementary training and organizational changes take time, delaying full economic benefits.
Intensive computing-infrastructure development also competes with traditional industries for electricity load, grid-distribution capacity, skilled construction labor and credit. When investment demand grows faster than upstream supply, some capex becomes higher equipment prices, power premiums and financing costs, partly crowding out other fixed investment. Accounting support after imports is only a baseline for direct contribution. Long-term gains depend on technological diffusion fundamentally expanding potential output and the economy managing resource-competition frictions.
II. Cash consumption reaches 91%, encouraging debt issuance; some project returns may face tests in 2027–2028
1. Cash remaining after capex shrinks by two-thirds as giants turn to debt and customer advances
Latest corporate results show core-business growth still supporting capital expansion. In the quarter ended June 2026, Microsoft's Azure and other cloud-services revenue rose 43% year on year; annual Azure revenue exceeded $100 billion for the first time in fiscal 2026. Amazon's Q2 AWS revenue rose 36.7%; Alphabet's Google Cloud grew 82%, including sales of custom TPU systems delivered to customers' private data centers. Cloud rentals and hardware deliveries both expanded, but have very different cash-recovery cycles and margins.
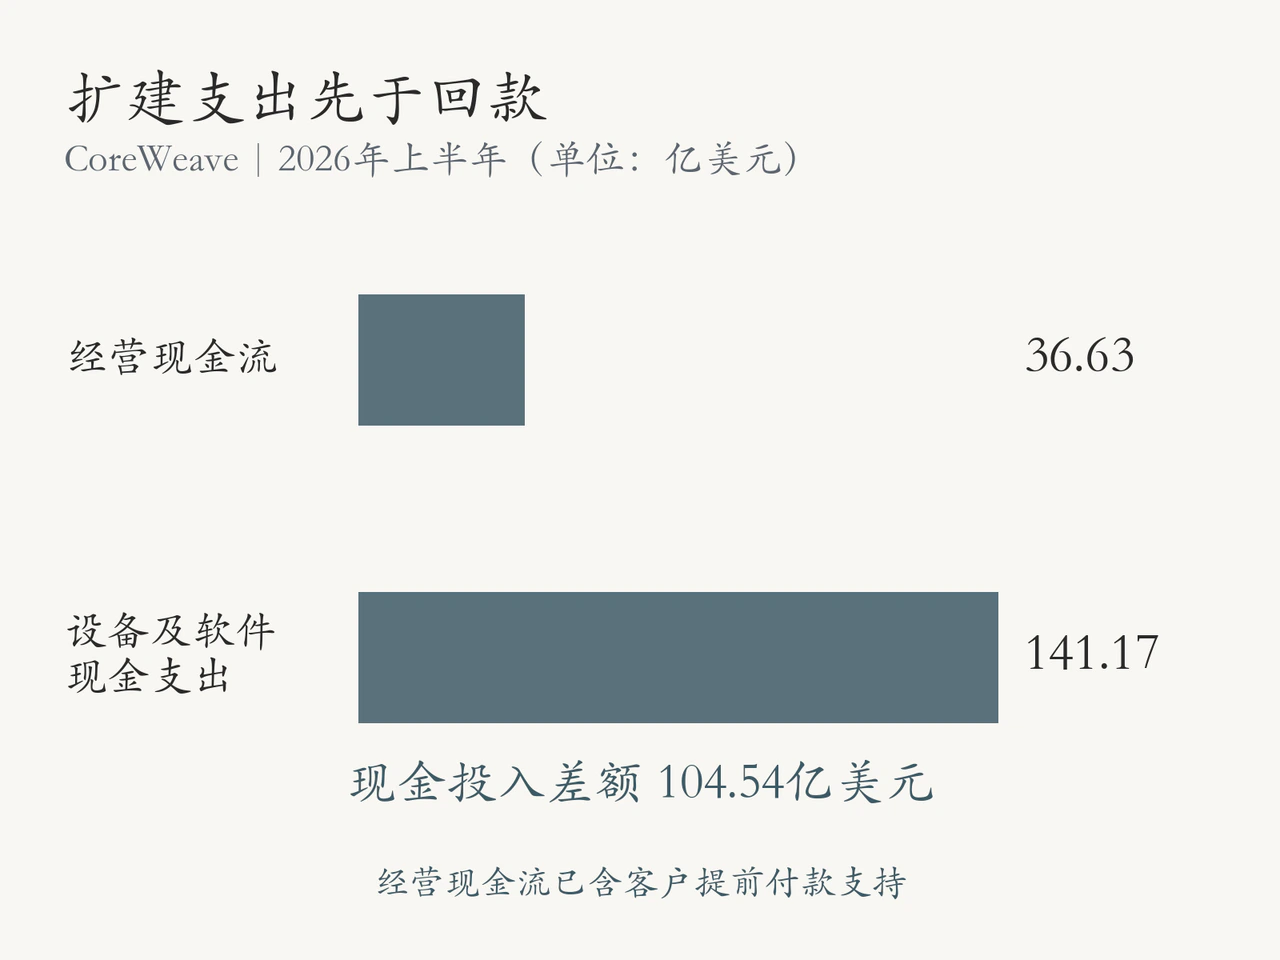
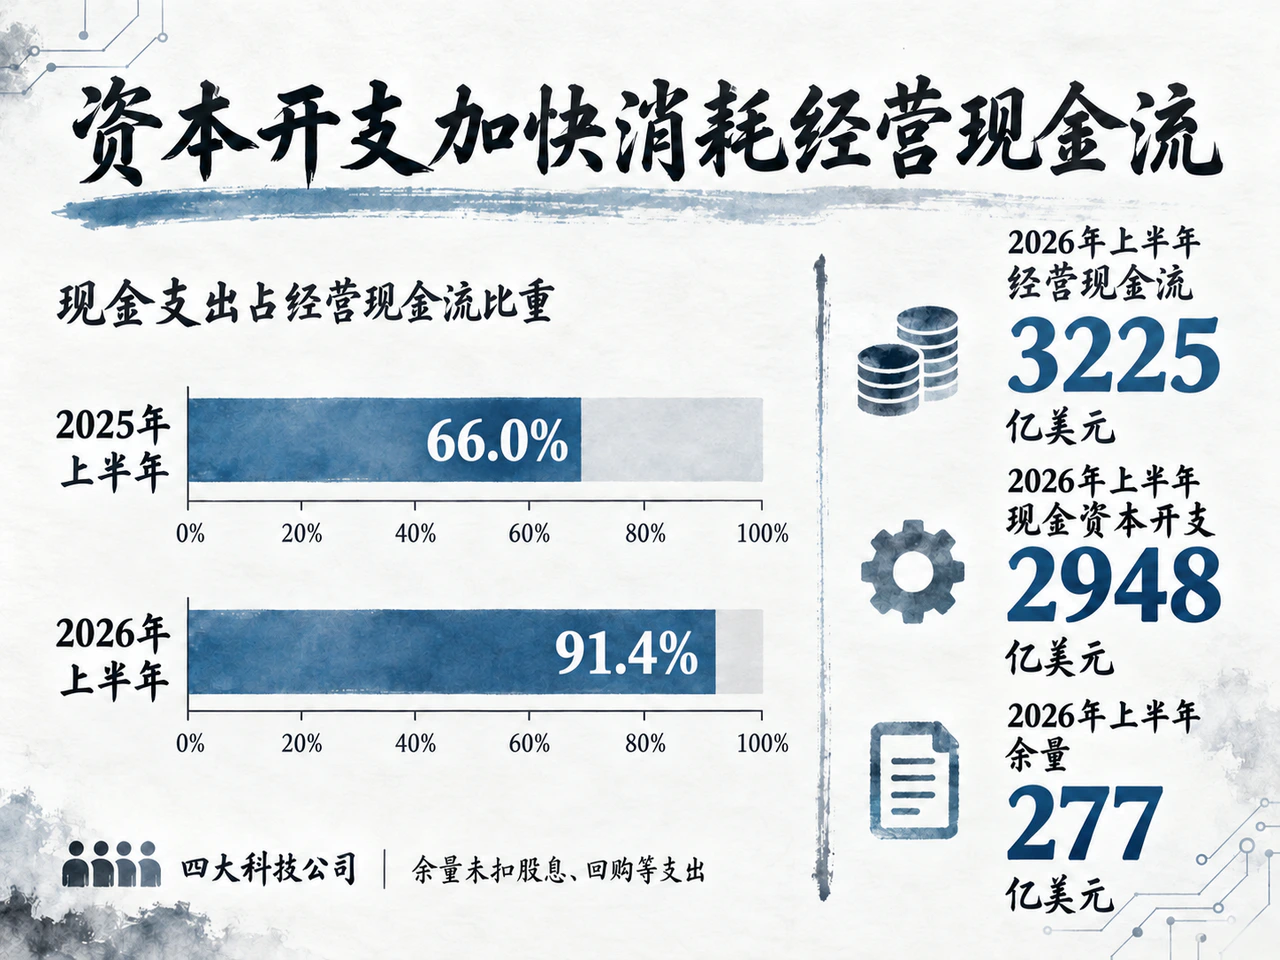
Capital investment, however, has far outpaced growth in internal cash generation. The four giants' first-half 2026 operating cash flow totaled $322.5 billion, up 32.9%, versus $294.8 billion of cash property-and-equipment purchases, up 84.1%. Capex rose from 66.0% to 91.4% of operating cash flow. Cash remaining after those purchases fell from $82.6 billion to $27.7 billion, roughly a two-thirds decline.
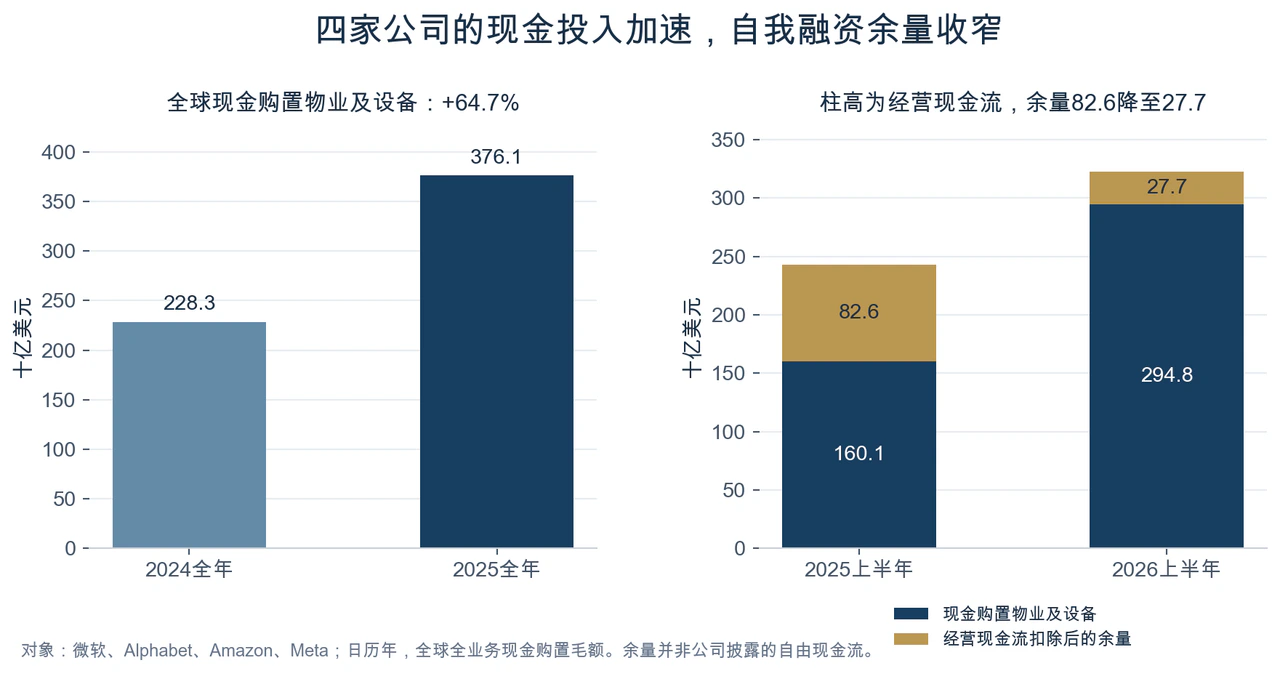
That residual precedes ordinary dividends, buybacks, strategic acquisitions, equity investments and finance-lease principal repayments, and differs from each company's own free-cash-flow definition. The consistent measure clearly shows mature businesses still generating ample cash, but computing investment consuming internal funds even faster. Sustaining expansion will increasingly require lower shareholder returns, use of existing cash or external debt.
Liquidity is diverging by company. Alphabet recorded Q2 2026 free cash flow of -$5.86 billion, although trailing-twelve-month totals remained positive. Amazon's trailing-twelve-month free cash flow through Q2 turned negative at -$7.60 billion. Meta's Q2 free cash flow after finance-lease principal was $780 million. Microsoft retained approximately $67 billion after deducting property-and-equipment spending from fiscal 2026 operating cash flow.
External financing is filling funding needs. Amazon received approximately $67 billion from long-term debt issuance in first-half 2026; Meta raised approximately $24.9 billion net from long-term bonds in Q2. Oracle's operating cash flow for the quarter ended August included approximately $11.4 billion of customer prepayments with a significant financing component. Large committed orders provide demand visibility for construction but also connect it to downstream customers' ongoing performance and refinancing capacity. Parent-company credit can extend the expansion window without guaranteeing individual projects' economic returns.
Long-term contracts offer micro evidence of demand sustainability. At end-June, Microsoft's commercial remaining performance obligations (RPO) were approximately $678 billion, about 30% expected to become revenue within twelve months. Slightly more than half of Alphabet's roughly $514 billion cloud backlog was expected within twenty-four months. Huge order books provide near- and medium-term revenue visibility, but continued incremental capex depends on delivery schedules and installed utilization. Together with expanding cloud businesses, this gives high investment an operating foundation over the next six to twelve months. PIMCO's October outlook considered an imminent industry-wide capex cliff unlikely.
Construction and monetization lags delay the return-assessment window. Amazon management disclosed in July that hyperscale data centers typically begin civil and electromechanical spending about two years before installed hardware monetizes, with servers and core network equipment mainly purchased in the months before energization. On that timetable, projects begun in 2025–2026 may face commissioning and cash-recovery tests in 2027–2028; Alphabet's next twenty-four months of contract delivery broadly align. Construction and grid connection are critical: delayed commissioning postpones receipts, while ongoing capital costs expose liquidity pressure earlier.
2. Useful-life changes and inflation distort spending readings; faster depreciation and power bottlenecks raise hidden costs
Accounting and classification changes materially influence reported capex fluctuations. Microsoft announced in July that, from fiscal 2027, it would extend estimated data-center and office-building lives from 15 to 25 years. Since lease term relative to economic life helps determine classification, longer lives make more future facility leases operating rather than finance leases. Operating leases are excluded from Microsoft's reported capex, which includes finance leases. It accordingly revised calendar-2026 capex expectations to approximately $175 billion, stressing that actual investment plans were unchanged apart from this accounting adjustment. Reading the reduction without its accounting context risks mistaking it for a physical construction downturn.
Higher nominal capex guidance likewise need not mean proportionally more physical activity. In July, Amazon raised full-year cash-capex guidance from approximately $200 billion to $220 billion, attributing the additional $20 billion mainly to rising core hardware costs such as memory. This matches the macro pattern of rising nominal bills and weaker real equipment investment. Assessing the capital cycle therefore requires cash outflows, lease commitments, deployed hardware volumes, energized capacity and actual delivery progress together.
A deeper commercial constraint is the mismatch between economic asset lives and depreciation periods. Buildings and power infrastructure usually last longer, while rapidly evolving chips and network equipment can lose competitiveness within years as energy efficiency and architectures improve. In 2025, Amazon shortened some server and network-equipment depreciation lives from six to five years, citing faster technological change; Meta extended some equipment lives over the same period. Accounting-policy differences do not replace business substance: what matters is hardware's cash generation over its commercial life.
Consider $100 billion of computing equipment with no residual value. Six-year straight-line depreciation implies roughly $16.7 billion annually; if technological change reduces its economic life to three years, annual capital costs become $33.3 billion. The additional $16.7 billion directly reduces economic profit and returns on equity, and becomes actual cash spending when replacement purchases occur. Impairments mainly reduce reported profits and corporate wealth rather than retroactively reversing historical GDP output. Since GDP uses gross investment, including replacement equipment, intensive nominal capex can coexist with slowing net capital accumulation.
Power bottlenecks further delay returns and raise carrying costs. The IEA's 2026 thematic report projects global data-center electricity demand rising from 485 terawatt-hours (TWh) in 2025 to approximately 950 TWh in 2030. If facilities and hardware are paid for but grid interconnection is delayed, receipts are postponed and funding costs accumulate while idle hardware continues losing technological life. Physical bottlenecks delay concentrated computing-supply releases but increase individual projects' cash-flow stress.
End-market monetization also cannot be assessed by API calls alone. Rapidly falling inference costs broaden applications but reduce the price realized per computing service. If the unit service price falls 50%, usage must double merely to keep nominal revenue flat. Actual profitability depends more on overall utilization and control of unit computing costs. Economy-wide efficiency gains and satisfactory infrastructure-investor returns can arrive on different schedules.
3. A 20%–40% investment cut has limited direct GDP drag, around a few tenths of a percentage point annually
Historical statistics explain previous quarterly contributions; scenarios start from 2026 investment to estimate next year's effects under different capex changes. Since historical proxies include non-AI software and other activities, this exercise consistently uses Goldman's $581 billion 2026 US AI investment base and rounded nominal GDP of $32 trillion. It assumes 50% of investment changes affect domestic production and 50% are offset through equipment imports, comparing all variables at fixed 2026 prices. The 50% domestic-content share is a sensitivity baseline, tested against a subjective 35%–65% range.
Assuming a stable domestic production share and excluding financial accelerators and wealth effects, direct annual real GDP growth changes follow: investment base ÷ GDP base × real investment growth × domestic production content. A 20% real cut to $581 billion of AI investment reduces demand $116.2 billion; at 50% domestic content, US output falls $58.1 billion, about 0.18% of GDP.
| Next year's real investment change | Direct contribution to annual GDP growth | Difference from the investment-growth-of-30% reference |
|---|---|---|
| Growth of 30% | +0.27 percentage points | 0.00 percentage points |
| Growth of 10% | +0.09 percentage points | -0.18 percentage points |
| Unchanged | 0.00 percentage points | -0.27 percentage points |
| Cut of 20% | -0.18 percentage points | -0.45 percentage points |
| Cut of 40% | -0.36 percentage points | -0.64 percentage points |
Conditional annual calculations, not forecasts. Scenarios share a base year and fixed prices; 30% growth is only a comparison reference. Multipliers, wealth effects, credit contraction, policy responses and other demand changes are excluded.
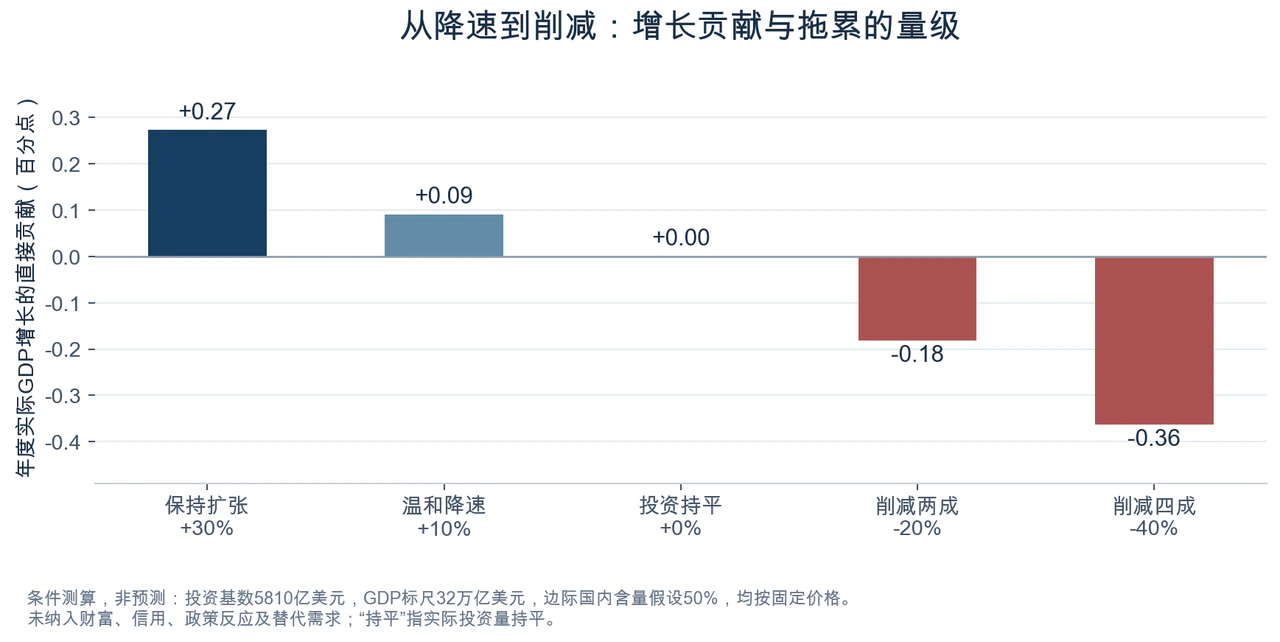
The exercise distinguishes three macro dynamics. Slowing investment growth from 30% to 10% still contributes positively to GDP, +0.09 percentage points, but 0.18 points less than the strong-growth reference. Flat real investment produces zero additional direct growth while maintaining the same high level of production activity. Only an absolute investment decline directly subtracts growth. If a one-time cut is followed by stabilization at the lower level, it does not keep subtracting growth the following year, although output stays below the original expansion path; other demand and productivity developments can subsequently change that path.
Domestic production content directly affects impact. Across the subjective 35%–65% range, a 20% cut directly subtracts 0.13–0.24 percentage points from US GDP growth; a 40% cut subtracts 0.25–0.47. Cuts concentrated in imported GPUs would have relatively limited direct US impact; those concentrated in domestic buildings, electrical work and software R&D would have greater impact.
A direct drag of 0.18–0.36 percentage points would pressure a slow-growing economy and could affect individual quarterly readings. Alone, however, this channel is insufficient to push an economy growing around 2% in real terms into a broad recession. A deeper downturn generally depends on transmission to household consumption, traditional capex and credit. Conversely, better computing efficiency that delivers the same tasks with less spending, or lower computing costs stimulating broader innovation, could align slower investment growth with healthy free cash flow and productivity gains.
4. Share prices often adjust before macro data; contagion depends on credit chains and leveraged borrowers
Financial markets discount future cash flows; national accounts record completed current output. Market turning points often precede formal capex cuts: disappointing end-use monetization, core margin pressure or reduced expected long-term returns can trigger early repricing. Conversely, deliberate reductions in inefficient capex that improve free cash flow while core cloud revenue remains strong may receive a positive equity response.
When earnings expectations and valuation multiples both fall, equities decline far more than GDP's direct movement. If expected future earnings fall 10% and the target P/E falls 25% as risk premiums rise, the share price becomes 90% × 75% = 67.5% of its original level, a 32.5% decline. This does not require an equivalent macroeconomic contraction or imply actual corporate default.
Leading technology shares materially affect broad indexes. State Street's October 7 S&P 500 weights put Microsoft, Amazon, Alphabet's A/C classes and Meta at a combined 17.54%. Adding Nvidia, Broadcom and Micron as an illustrative semiconductor-inclusive basket brings seven companies to 30.59%. If each of the four falls 32.5%, a weighted 32.5% loss, with all other constituents unchanged, the S&P 500 falls approximately 5.7%. A simultaneous 32.5% decline in the seven-company basket would lower it approximately 9.9%. Broader earnings or multiple declines would amplify losses further.
A technology valuation adjustment is not equivalent to systemic financial crisis. The 2000–2001 telecom investment correction offers a reference. Richmond Fed data show annualized real US communications-equipment investment falling from over $135 billion in Q4 2000 to under $93 billion in Q4 2001, both at constant 1996 prices, a decline exceeding 30%. Communications-services consumption nevertheless kept growing. Supply expansion had outpaced actual demand and realized revenue, eventually forcing substantial equipment-investment adjustment.
That telecom downturn accompanied the 2001 US recession, but household consumption and residential investment helped it end after eight months. Technology adoption can coexist with upstream hardware-investment correction. Whether sector adjustment becomes broad crisis depends principally on economy-wide debt structures, leverage distribution and financial institutions' risk-absorption capacity.
In this AI buildout, credit risk is concentrated along particular financing chains. Large technology parents retain strong balance sheets and funding access, but project special-purpose vehicles (SPVs), emerging independent computing providers or neo-clouds, and some capital-intensive power-equipment suppliers depend heavily on external credit. An October Kansas City Fed study put broad AI-chain investment-grade issuance through Q2 2026 at approximately $330 billion, 10% of US investment-grade issuance versus around 2% in 2023. Coverage includes technology, utilities, power infrastructure and data-center operators.
Leverage is uneven. The study put debt/assets around 90% for computing-infrastructure SPVs and 85% for independent providers. In contrast, hyperscalers' investment-grade bonds issued from 2025 through August 2026 had a weighted-average maturity of approximately sixteen years, above the broader US market's roughly ten. Longer terms ease near-term refinancing pressure. Disappointing returns may therefore first appear as harder new financing for leveraged peripheral projects, lower asset valuations and wider secondary credit spreads, before gradually affecting existing debt.
Long leases, project loans and hardware residual-value guarantees separate capex adjustments from rigid cash obligations. Slower giant-company hardware purchases reduce suppliers' new orders, while project vehicles still owe interest and facility rent when downstream customers reduce computing rentals. Arrangements in which giants are simultaneously customers, shareholders and financiers also increase interconnectedness. An October BIS study of AI financing networks said tied supply relationships and equity links increase network endogeneity; major end-demand disappointment could pressure related entities through both slower revenue and impairments.
If end-use revenue and utilization disappoint while debt and long leases cannot adjust quickly, tighter credit can create negative feedback. Lower project valuations, harder extensions and greater default risk may cause private-credit funds, institutions and banks to reduce exposure. Employment adjustments and slower construction may weaken related incomes, while equity-related wealth losses suppress consumption, further pressuring end demand.
The macro policy environment is critical to absorbing adjustment. If cooling technology investment accompanies disinflation, lower rates can provide a buffer. Persistent supply-driven inflation, such as energy bottlenecks, may instead constrain monetary easing. High rates combined with credit contraction would substantially increase adjustment frictions.
5. Four monitoring dimensions: prices, receipts, issuance spreads and macroeconomic absorption
Over coming quarters, micro indicators of AI investment sustainability should focus on standardized computing-service prices, actual utilization, downstream customers' cash-collection cycles, incremental revenue per new capital dollar, and operating cash coverage of hardware and binding leases. RPO and booked contracts indicate commitments, not cash already received. Physical delivery and collection must convert them into cash supporting subsequent investment. Circular procurement tied to supplier investment and lending also requires examination of actual final demand.
| Monitoring dimension | Orderly cooling | Escalating risk |
|---|---|---|
| Operating returns | Better utilization, collections and revenue per unit of capital | Comparable service prices fall faster than costs; renewals and collections weaken |
| Real investment | Expansion slows; commissioned facilities are fully used; cash flow improves | Multiple companies simultaneously delay equipment orders, cancel projects or recognize impairments |
| Financing and contracts | Stable parent cash coverage; project income covers debt and rent | Wider spreads, more extensions and calls on guarantees |
| Macro transmission | Consumption, other investment and productivity gradually take over | Shutdowns, layoffs, wealth losses and credit contraction reinforce each other |
Current evidence suggests cloud revenue growth and construction deliveries still support near-term investment. Rising capex relative to operating cash flow, however, narrows financial buffers and raises the bar for monetized returns. Changes often appear first in new-order expectations, hardware purchasing, collection cycles and credit prices, then capex guidance, and finally with a lag in GDP data.
Adjustment from elevated technology capex may become an important checkpoint for US growth and capital markets. The key is whether existing computing capacity can produce sustained quality revenue as investment slows, and whether internal corporate buffers can absorb asset repricing smoothly. If technology diffusion and productivity gains gradually replace construction's early stimulus, the economy may move smoothly from infrastructure-driven growth to efficiency gains. If monetization, profits and external finance weaken together, direct GDP drag of a few tenths of a percentage point may be amplified by financial accelerators. The central indicator is whether the value chain achieves real returns consistent with capital costs before external funding dependence rises further.
For research and discussion only; this article does not constitute investment advice.