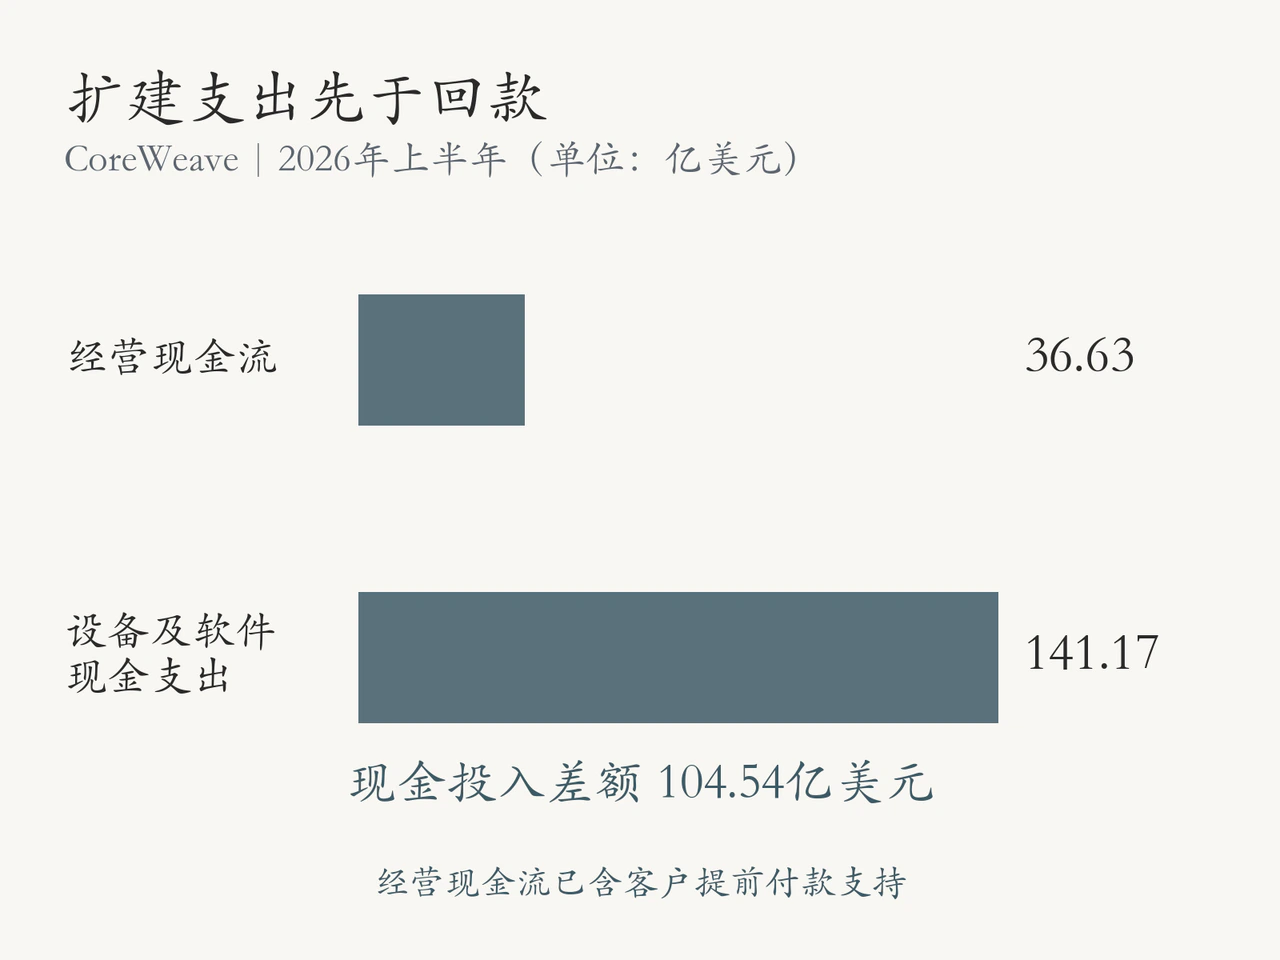
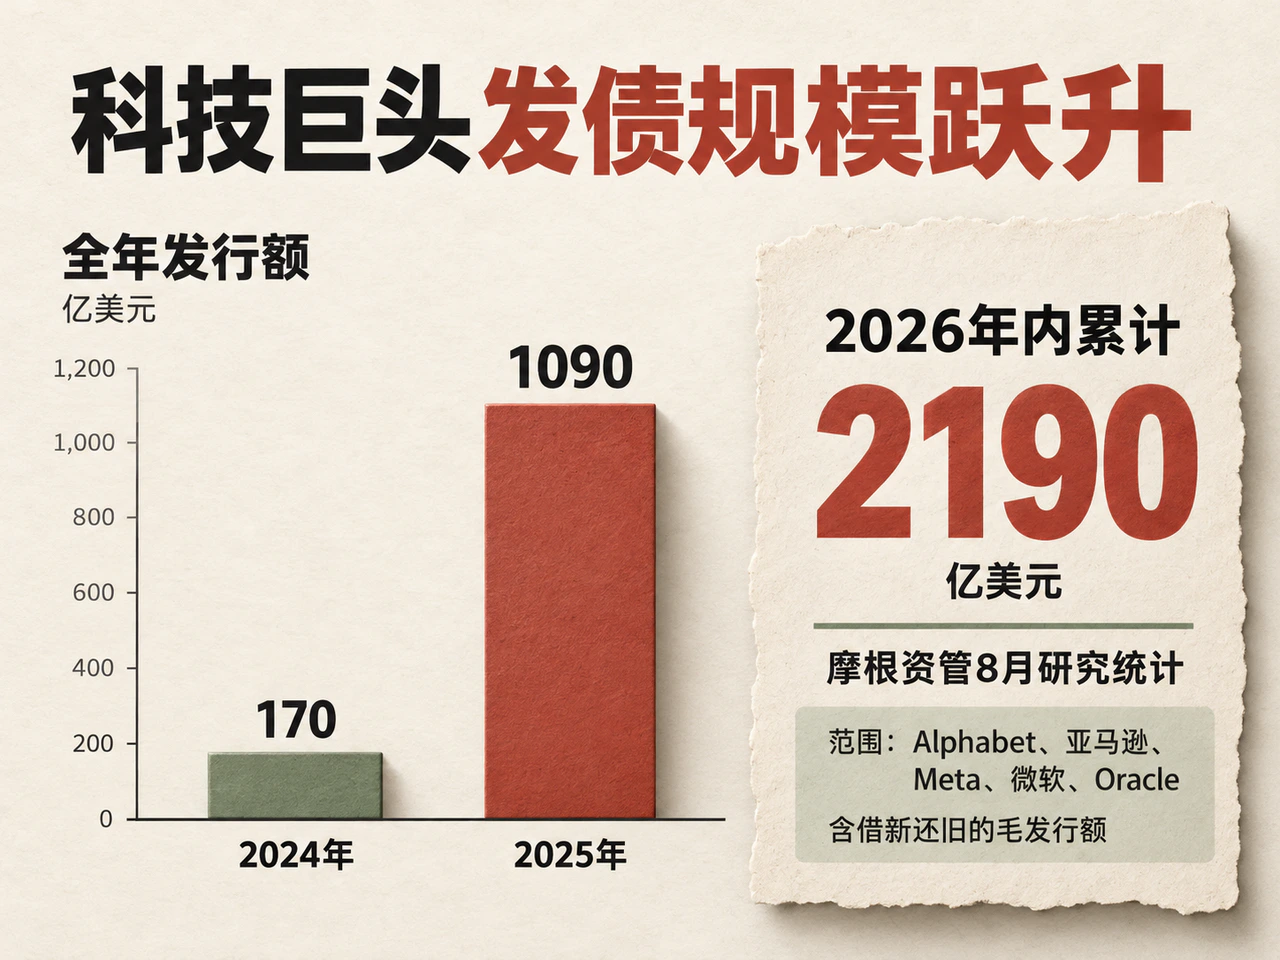
Goldman Sachs Research estimated in August that AI-related capital investment within the United States would reach $581 billion in 2026, encompassing data centers, computing equipment and related supply-chain construction. Microsoft, Amazon, Alphabet, Meta and Oracle—the main drivers of this expansion—are approaching a crucial financial turning point: their combined global capital expenditure is expected to exceed their operating cash flow for the year.
Paid demand for AI is expanding rapidly, and infrastructure spending is already giving the U.S. economy a tangible boost. The central question is whether cash generated by new business can cover the initial expansion and subsequent equipment replacement in time. Who can secure sustained cash receipts from end customers, and who must rely on the next financing round, will determine where the profits and losses from this investment cycle ultimately fall.
1. The five giants' capital expenditure approaches $800 billion and begins to exceed their own operating cash flow
The five technology giants' capital spending is not a steady extension of recent years. It accelerated sharply from 2024: after declining slightly year on year in 2023, capex rose to about $240 billion in 2024 and $416 billion in 2025, and is expected to approach $800 billion in 2026.
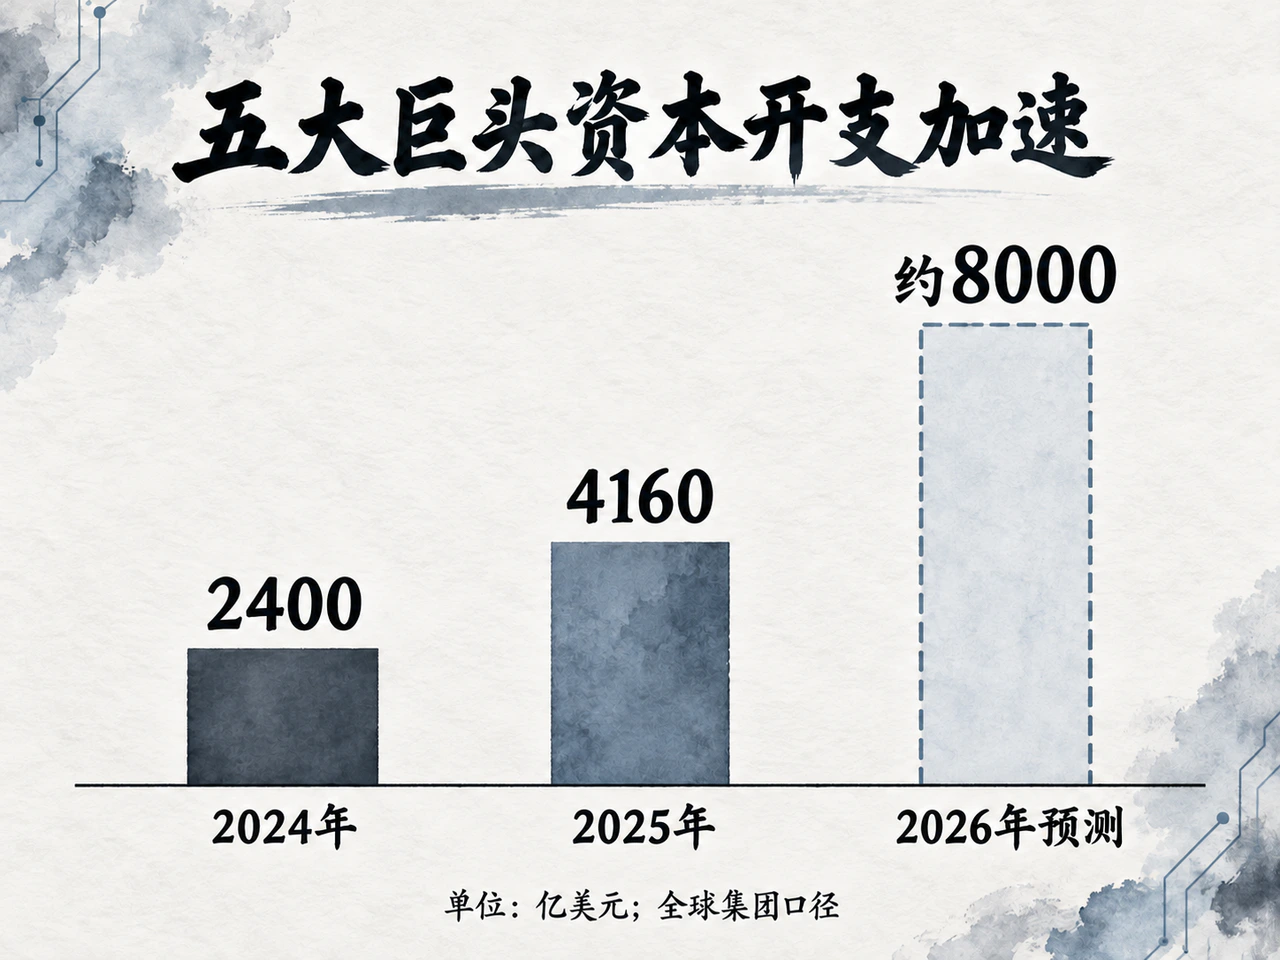
Research published at Brookings by Columbia Business School professor Stijn Van Nieuwerburgh compares the five companies' capex with operating cash flow. In 2026, capex is projected to grow about 93% year on year, versus only about 17% for operating cash flow. Additional investment of about $385 billion would be nearly 3.7 times the roughly $104 billion increase in operating cash flow. Capex as a share of operating cash flow rises from 41% in 2023 and 69% in 2025 to a projected 113% in 2026, with the latter year's amounts approximately $800 billion and $707 billion, respectively.
This changes the giants' allocation of funds. Cash from advertising, software, e-commerce and cloud services previously supported large buybacks, dividends and other investments even after infrastructure was paid for. The same sources must now give priority to soaring construction budgets. The roughly $93 billion gap is not an AI business loss: companies can draw on cash reserves, reduce shareholder distributions or sell assets. Nevertheless, capex has exceeded the previous balance of internally generated funding.
This global group-level series includes non-AI businesses. Historical figures use calendar-year cash capex and operating cash flow; the 2026 figures combine reported results, guidance and forecasts. Data centers built by third parties and subsequently leased are excluded. The series measures overall group budget pressure, rather than the funding accounts of individual U.S. AI projects.
Nearly $600 billion of investment within the United States brings this corporate budget expansion to a macroeconomic scale. Starting from the giants' budgets, Goldman expands the company sample, deducts part of the traditional-business baseline, seeks to remove lease double-counting and allocates spending by project location. It estimates that U.S. AI-related investment in 2026 will equal about 1.8% of GDP. This full-year forecast is not an amount already completed for the year.
The macroeconomic stimulus is already visible in official statistics. A July Federal Reserve study combines software, computers and peripherals, data-center buildings and electricity facilities into a broad proxy, including some traditional IT uses. After deducting related net imports, it estimates a contribution of about 0.73 percentage points to annualized quarter-on-quarter U.S. real GDP growth in the first quarter of 2026, demonstrating the strength of this technology construction cycle's support for aggregate demand.
A January 2026 St. Louis Fed study provides a historical comparison. Using the statistical vintage available then, on a consistent basis that includes non-AI activity and does not deduct imports, information-processing equipment, software and R&D contributed an average 0.81 percentage points to annualized quarterly real GDP growth across the four quarters of 2000, versus 0.90 percentage points in the first three quarters of 2025. Software's contribution rose from 0.11 to 0.35 percentage points. This suggests that the macroeconomic boost from the present technology investment cycle has reached the scale of the peak dot-com-boom year, with greater reliance on software.
High investment throughout the year does not, however, imply a constant contribution in every quarter. In the same vintage of BEA data revised in September, which does not deduct equipment imports and differs in coverage from the Fed study, the gross contribution of information-processing equipment and software to GDP growth fell from 1.39 percentage points in the first quarter to 0.52 in the second. Real GDP growth in those quarters was 2.5% and 2.2%, respectively.
In trade accounting, imported servers increase both U.S. investment and the import deduction; the foreign-manufactured portion does not create current U.S. value added. Local construction and subsequent operations count toward U.S. output, while Asian chip, memory and equipment companies receive orders at the same time. Because construction demand precedes operating returns, even persistently high spending could provide a weaker boost to GDP, related orders and employment if real investment growth slows.
2. AI data-center electricity use grew 50% in 2025; competition, grid delays and external finance encourage building ahead of demand
Tighter cash budgets have not slowed construction, primarily because actual computing loads continue to grow. The International Energy Agency estimates that global data-center electricity consumption rose 17% in 2025, including 50% growth at AI data centers. Electricity use is not a revenue measure, but provides physical evidence that new facilities are consuming power and carrying real computing workloads.
Model training is only part of that load; inference recurs as users make requests. Beyond text generation, long contexts, video, extended reasoning and agent tasks increase the resources consumed per use. Cheaper individual computations and greater total industry usage now coexist as a practical baseline for corporate capacity planning.
Goldman's scenario analysis of computing infrastructure identifies demand elasticity as a key variable. Technological progress can complete a fixed workload with less equipment, but cheaper computing also brings previously uneconomic tasks into the market. Companies reserving capacity in advance already factor in additional usage stimulated by lower prices.
A second driver is defensive competition. Meta builds AI infrastructure both to sell new model products and to improve recommendations and advertising. Google faces competition simultaneously in search access, model products and cloud markets. For companies with large existing businesses, investment returns include preventing the displacement of established revenue. Although difficult to isolate, this benefit materially affects capital budgets.
The Bank for International Settlements notes that when companies expect leaders to capture a large market share, each will invest early. The industry-level result is often several companies building capacity ahead of demand for similar future markets. Competition raises the business risk of not investing, while potentially reducing the returns ultimately earned by all participants.
A third driver is construction lead times. The IEA's 2025 report says data centers can be built in two or three years, while new transmission lines in advanced economies typically take four to eight years. Waiting until demand is fully established before securing power, land and grid connections often misses product and customer deadlines.
This explains why today's electricity shortages prompt longer capacity commitments, and why shortages do not automatically guarantee future project returns. What is secured today is future supply at a particular location, using particular equipment and for a specified period. Customer demand, technology choices and service prices may have changed by delivery.
A fourth driver is external capital's willingness to fund the waiting period. Integrated platforms use cash from core businesses; independent model companies gain purchasing power through equity financing; cloud providers and developers obtain loans and institutional funding against long-term customer contracts. Multiple funding streams flow through procurement chains into hardware and construction, allowing current building activity to exceed the cash generated by new AI products themselves.
OpenAI announced in March that it had completed a financing round with $122 billion in committed capital; Anthropic announced a $65 billion financing in May. Commitments and actual closing occur at different times, but these large arrangements have already become an important credit foundation for independent model companies' computing purchases.
3. Advertising, cloud and model subscriptions provide three cash-collection paths; investment has already absorbed the giants' incremental operating cash
Explaining the return on all AI facilities solely through model subscription fees understates mature platforms' monetization capacity. Much of Meta's and Google's investment serves core businesses with established customers, revenue and distribution. Independent model companies must build a paying market from scratch while paying for computing. They face similar hardware costs but have very different financial resilience while awaiting returns.
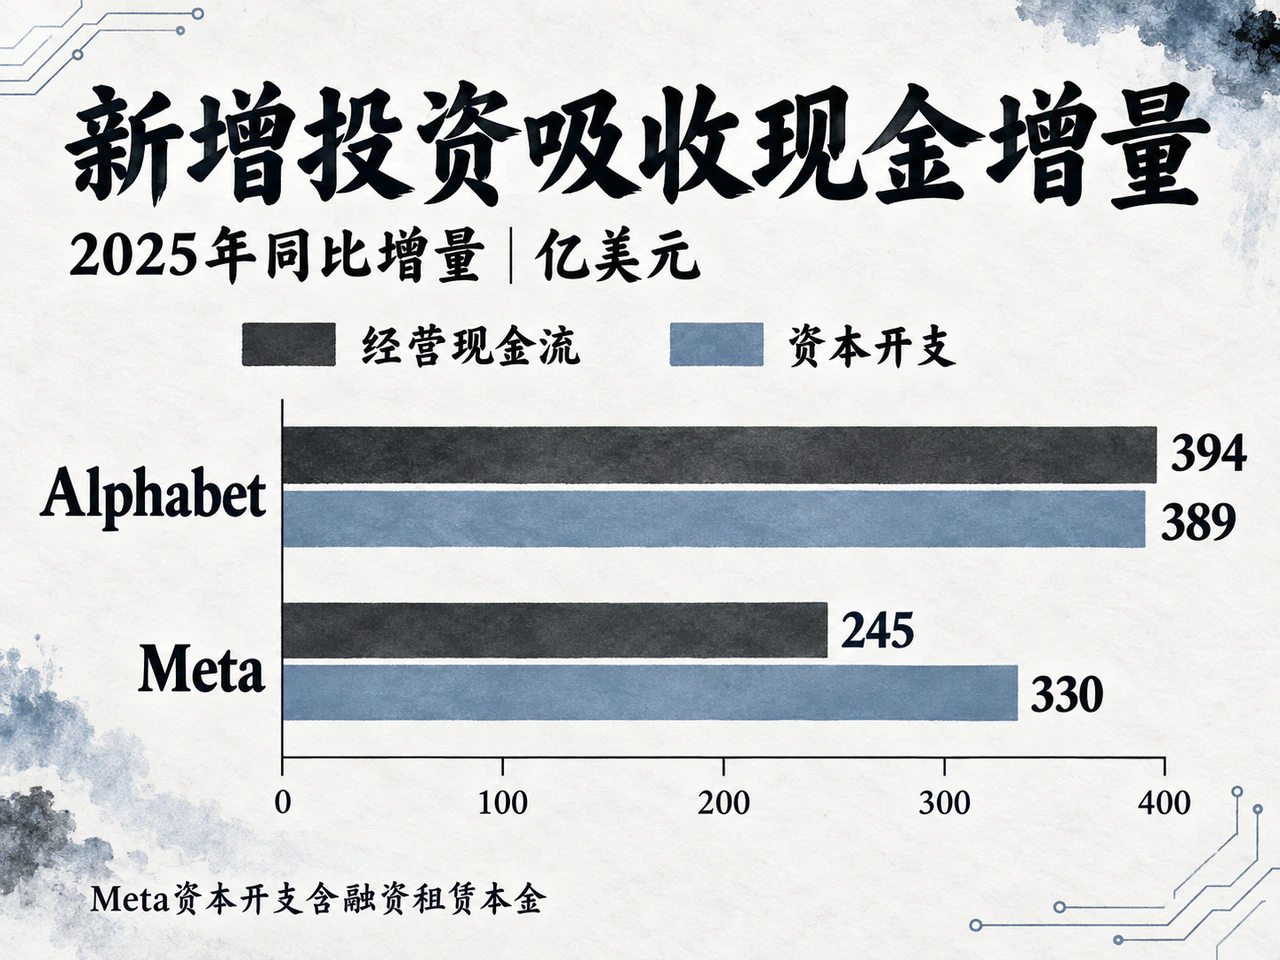
Annual group cash flows at the two platforms already show the cost of faster infrastructure expansion, without treating traditional-business cash as a return on new AI projects. In 2025, Alphabet's operating cash flow rose about $39.4 billion year on year, while cash purchases of property and equipment increased about $38.9 billion, absorbing almost the entire increment. Meta's operating cash flow increased about $24.5 billion, while capex including finance-lease principal rose about $33 billion, reducing operating cash remaining after investment by about $8.5 billion year on year.
The first route is advertising monetization, exemplified by Meta. Its advertising revenue was about $59.4 billion in the second quarter of 2026, up 27% year on year. The company said model improvements in user understanding, ad ranking and sequence learning improved conversion. Advertisers still pay ordinary advertising fees; AI contributes directly to receipts by improving the value of traffic and advertising efficiency, without first becoming a separately priced AI product.
Advertising growth also reflects traffic, macroeconomic conditions and exchange rates, and cannot all be attributed to AI. Nevertheless, Meta's new computing capacity can connect to a vast existing payment system. Intensive spending is still compressing its cash buffer: group operating cash flow was about $31.9 billion that quarter, against capex including finance-lease principal of about $31.1 billion. Cash remaining after investment plunged from roughly $8.5 billion a year earlier to about $0.8 billion.
Google also operates the second route: selling infrastructure externally. Google Cloud's second-quarter revenue was about $24.8 billion, up 82% year on year, with operating profit of about $8.8 billion. This includes traditional cloud, AI services and the first deliveries of TPU systems; shared AI R&D is borne separately by the group. Profit in this mixed cloud business coexists with a group funding gap. Alphabet generated about $39.1 billion of operating cash flow that quarter and spent $44.9 billion on cash purchases of property and equipment. Cash flow after investment swung from about positive $5.3 billion a year earlier to about negative $5.9 billion. Cloud-segment profitability does not yet establish that all AI assets have paid for themselves.
This gives Google a clear commercial rationale for supplying computing to external model companies. Serving its own models, outside model vendors and ordinary enterprise customers connects similar underlying infrastructure to diverse sources of demand. If contracts, prices and costs are attractive, a downstream customer can compete with Gemini at the application layer while still buying cloud services.
Cloud revenue must nevertheless be traced further downstream. An enterprise buying computing for a live business and a model company buying training for a next-generation product both generate cloud sales, but the basis of payment differs. The former relies more on normal operating budgets; the latter may depend heavily on financing. A cloud provider receiving payment does not mean that end-customer receipts can already sustain the entire industry chain.
The third route is direct charging for models, applications and software. Microsoft disclosed that Microsoft 365 Copilot had more than 30 million paid seats by the end of fiscal 2026, showing that existing enterprise-software customers are becoming paying users of AI tools. More usage also raises inference costs, so seat growth cannot all be treated as incremental profit.
Commercialization at independent model companies has expanded especially quickly. According to an October Reuters report, Anthropic told investors that first-, second- and third-quarter revenue was about $4.7 billion, $11.6 billion and $16.8 billion, respectively. Third-quarter revenue was about 3.6 times the first-quarter level, bringing the nine-month total to $33.1 billion. It also achieved adjusted profitability in the third quarter, indicating substantial enterprise and developer spending.
OpenAI's annualized revenue run rate based on September was also approaching $50 billion. A run rate is not actual full-year revenue, and differences in how the two companies recognize channel sales make headline revenue rankings an unsuitable basis for judging whose end demand is stronger. Both nevertheless confirm a rapidly expanding paying market.
Anthropic's progress toward profitability has strengthened confidence in commercialization, but public materials have not disclosed a complete reconciliation of adjusted profit or full-cycle cash flows. Current expenses from rented computing, future training, long-term purchase commitments and owned-equipment expenditure enter accounts and require cash payment at different times. One quarter's operating improvement can ease short-term pressure, while future contractual obligations still require growing cash flow.
These differences provide a clear map of who pays for AI. Advertisers, enterprise-software customers, developers and individual users are already paying at the end of the chain. Mature platforms invest some cash from traditional businesses in new facilities, while external investors supply incremental funding. These streams jointly support enormous current construction, but assessing the standalone return on new AI projects still requires a strict distinction from established group profits in traditional businesses.
Narrower cash headroom has not put the giants into an immediate funding shortage. At the end of June, Alphabet held about $55.9 billion in cash and cash equivalents; Meta's cash, cash equivalents and marketable securities totaled about $90.3 billion. Both companies' second-quarter cash-flow statements showed zero share repurchases, and both obtained external financing. They have actively adjusted cash allocation and retain asset and financing buffers. Directing more operating cash toward infrastructure does not mean funds are about to run out.
How quickly enterprise spending can expand ultimately depends on buyers' actual returns. McKinsey's 2026 survey found that 80% of respondents reported improved individual productivity, but only 37% reported a positive impact from AI on enterprise EBIT. Time savings have therefore not yet become corporate profit broadly. If technological savings are passed mainly to customers through lower prices, suppliers' revenue and profit will also fall short of the potential value of those savings.
4. Servers account for 60% of Alphabet's technical-infrastructure spending; cheaper computing and chip replacement narrow the recovery window
The assets purchased through enormous capex programs are not homogeneous. Alphabet said in the second quarter that approximately 60% of its technical-infrastructure investment went to servers and 40% to data centers and networking equipment. Land, power connections, buildings and cooling systems have very different economic lives from servers and accelerator chips. Continuous replacement of short-lived hardware undermines the traditional infrastructure logic of building once and collecting rent slowly thereafter.
Amazon's 2026 shareholder letter says expenditure at different construction stages typically precedes customer billing by six to twenty-four months. Its annual report also previously shortened the accounting useful life of some server and networking equipment from six years to five. Construction waiting periods tie up funds, commissioning is followed by a ramp-up, and hardware competition may shorten the period over which initial prices can be maintained.
There is therefore no uniform industry-wide minimum annual return. Cash operating costs determine whether current operations can continue, depreciation and other expenses affect current profit, and the full investment must be recovered gradually from operating net cash flow over many years. Depreciation itself no longer uses cash, but the equipment consumption and technological obsolescence behind it determine when companies must pay for replacement again.
Consider a simplified calculation for stable operations after commissioning, excluding construction waits and ramp-up. Assume an investment of 100, comprising equipment of 60 with a four-year economic life and facilities of 40 with a twenty-year life, both with zero residual value. At a 10% pretax unlevered cost of capital, annualizing principal recovery and financing cost over each asset's life and adding them produces about 23.6, implicitly allowing ongoing service and corresponding replacement. With fixed operating and maintenance costs of 3, and variable operating costs equal to 20% of revenue at the base price, required annual revenue is about 33.3. By comparison, if the entire investment of 100 could be used economically for twenty years, annual capital recovery would be only about 11.7, less than half the mixed-asset requirement. A large share of short-lived equipment directly limits how long a project can wait for cash receipts.
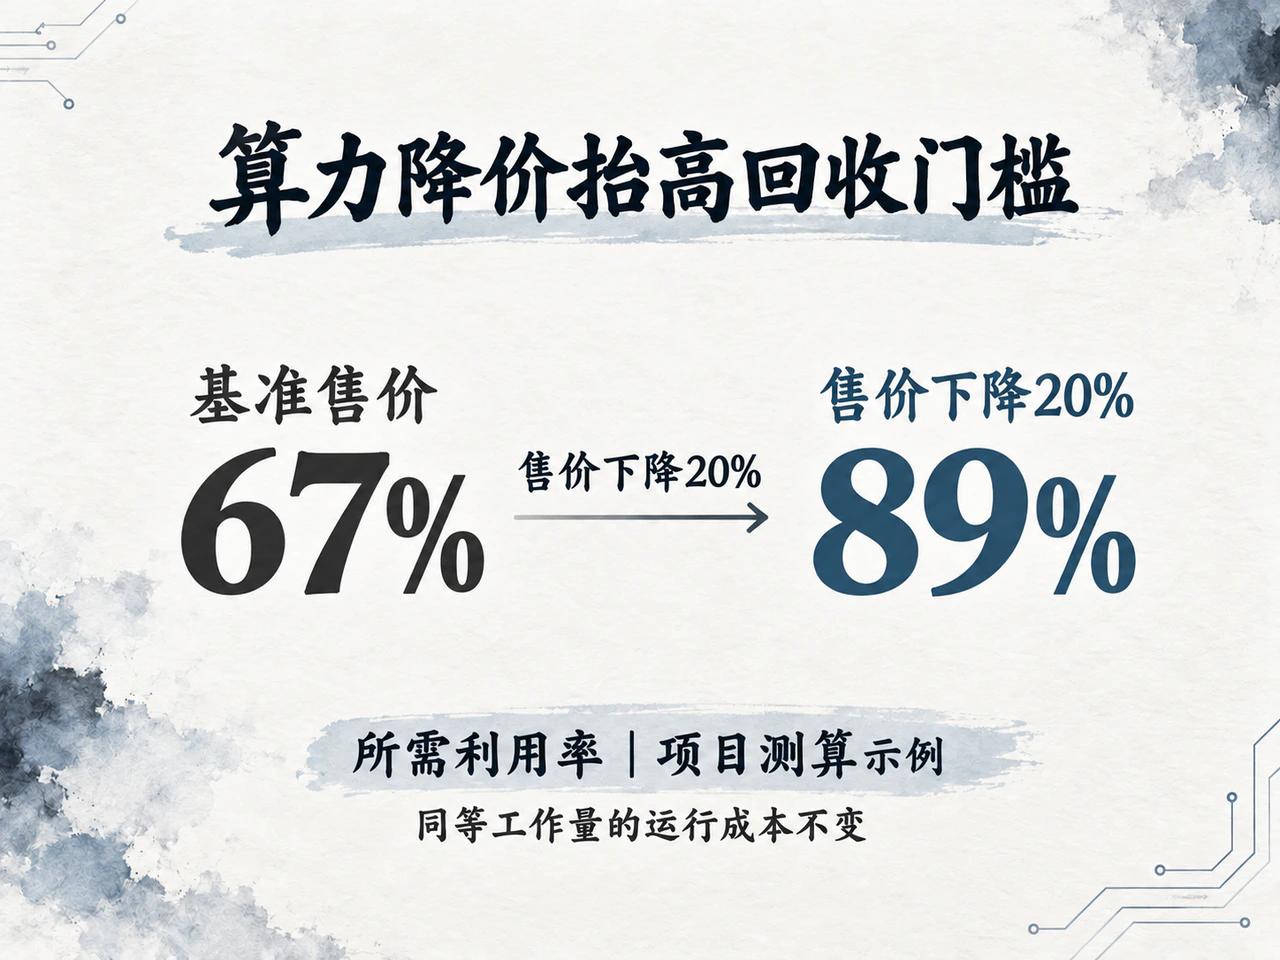
Assume full-capacity annual revenue of 50 and corresponding variable operating costs of 10. The project then needs about 67% utilization to meet its target. If only the service price falls by 20%, while operating costs for the same workload remain 10, required utilization jumps to about 89%. Asset lives, capital costs and prices are assumptions in this model, but it illustrates how cheaper computing can rapidly erode the margin for investment recovery.
More efficient new chips may reduce cost per computation while forcing down prices for older equipment. An older GPU's continued physical operation does not mean it can still be rented at the original rate. Reassigning it to less demanding inference tasks can extend its useful period, but requires new customers, software adaptation and appropriate pricing. Simply lengthening accounting depreciation schedules cannot replace these operating conditions.
The ability to reallocate computing assets among customers also depends on the form of supply. Shared public clouds can shift resources among clients, while dedicated clusters lock the right to use particular equipment to one customer. Property leases generally provide only the building, power and cooling; servers are separately owned by the cloud provider or customer. Leasing a building, using GPUs and recovering the cost of capital are consequently different outcomes.
For example, CoreWeave's publicly disclosed agreement with OpenAI provides designated computing configurations for OpenAI's exclusive use. After termination and transition, the servers can be sold or reassigned to new customers, but contractual handover, migration and repricing still carry costs. An exclusive-use agreement neither transfers equipment ownership nor eliminates the original holder's residual-value risk.
The two data-center buildings in Abilene's first phase illustrate another division of responsibilities. A property entity leases the buildings to Oracle, with OCI then hosting OpenAI workloads. The property owner recovers construction investment through rent; the cloud provider recovers equipment and service costs; the model company pays for computing with product revenue and financing. Project financial statements through the end of 2025 disclosed fifteen-year leases but construction debt maturing in 2028. A long lease can support financing, yet the project must still pass an earlier debt maturity. The tenant must also keep paying when usage is insufficient.
CBRE statistics show that vacancy in the eight primary North American data-center markets was only 1.4% in the first half of 2026, and 80.4% of capacity under construction had been preleased. This indicates continued scarcity of deliverable facilities and supports construction financing. But these statistics cover building leases and capacity reservations, rather than GPU utilization, rental prices for older equipment or customers' final profits.
Downstream customers can adopt new technologies gradually, while hardware owners have already incurred equipment-purchase costs. When service prices fall faster than usage growth and cost improvements can increase cash, pressure appears first in older equipment's rental income and residual value. Very low vacancy confirms demand for leased space, without securing a recovery price for each generation of computing hardware.
5. Bain's long-term AI infrastructure scenario implies a market near $6 trillion; related transactions extend cash-flow scrutiny across the chain
Putting these operating differences back into an industry-wide framework clarifies the disagreement among professional institutions. How much sustained capex can existing advertising, cloud and model markets support? If established markets cannot yet cover it, how quickly can new commercial revenue emerge?
Bain's September report projects that annual global AI-infrastructure spending could reach $1.5 trillion in 2031, including both new capacity and upgrades to existing GPUs, memory and networks. Applying the historical cloud-provider benchmark of capex at 25% of related revenue implies an annual global AI-related market approaching $6 trillion. The revenue required varies with this capital-intensity assumption.
Within the same 2031 framework, the report estimates consumer AI revenue opportunities of about $200 billion to $400 billion and supplier revenue from enterprise adoption of about $1 trillion to $1.4 trillion, totaling only $1.2 trillion to $1.8 trillion. These are scenarios for related infrastructure and application markets, rather than a transaction-deduplicated total of end-user payments. Even so, they demonstrate that a much larger incremental market is needed to connect current application expectations with future construction scale.
The calculation's value is to identify how much current construction expectations depend on new commercial activity. Expanding existing subscriptions and coding-tool sales covers only part of the requirement. Larger-scale process automation, physical-world applications and new products must also develop paying markets. Capital budgets thus embed a substantial assumption: future applications will not merely expand usage, but establish sufficiently large charging systems.
Goldman places more emphasis on near-term spending and the scope for diffusion of a general-purpose technology, projecting that U.S. AI-related investment will rise from 1.8% of GDP in 2026 to 2.8% in 2028. These are not simply opposing bullish and bearish positions. Goldman's construction outlook asks how much can be invested; Bain's revenue scenario asks how large a market is required to sustain that investment. Higher construction forecasts impose more demanding requirements on subsequent operating cash flow.
Capital markets are bridging the timing gap. Anthropic has committed to purchase more than $100 billion in technology services from AWS over the next decade, while Amazon is investing in Anthropic. Equity gives the customer purchasing power, and long-term procurement contracts help the supplier plan construction. The orders and financing are real at project level, but industry-wide this purchasing power still includes investors' bets on future revenue.
An October IMF analysis reviewed fourteen related transactions since 2023 and found that large equity and debt arrangements had become linked to about $1.4 trillion in future revenue commitments. This multiyear transaction sample is not current-year demand, but reveals a change in funding structure. More computing investment is tightly interconnected through cross-shareholdings, long-term orders and financing, allowing downstream operating outcomes to transmit across several links in the chain.
If model-company revenue disappoints, subsequent procurement and refinancing may be affected first, with pressure spreading to cloud renewals, equipment rental rates and project credit. Long-term contracts can leave some idle-capacity risk with customers. If customers' payment capacity weakens, however, suppliers and creditors must still reassess cash flows. Fully leasing a data-center building cannot interrupt this transmission chain.
Profit realization also occurs at different times upstream, midstream and downstream. Hardware deliveries meeting revenue-recognition conditions allow equipment makers to book sales, while buyers must recover cash through use over subsequent years. Cloud providers recognize revenue after supplying contracted training services, while model companies still have to convert training results into paid products. This timing favors early upstream revenue, but cannot guarantee that suppliers maintain their original growth after customers reduce budgets.
Integrated platforms with abundant advertising, software and traditional-cloud cash flows are better placed to withstand a waiting period for returns. Computing operators with concentrated customers and rapid asset replacement, and independent model companies continually bearing training and inference expenses, are more sensitive to incremental revenue and financing conditions. Even with the same industry demand growth, companies' cash headroom and investment margins of safety can diverge substantially.
These differences call for assessing this investment cycle at several levels. Advertising and enterprise services have the clearest established payment base, while surging model-company revenue and Anthropic's improved profitability provide positive evidence of realized demand. Yet the two major platforms' cash-flow evolution also shows that operating growth does not automatically increase cash remaining after investment. What can be established now is a fundamental change in capital budgets and funding structures; that alone does not prove that economic returns across the entire industry will be inadequate.
The adjustments most likely to appear first are reductions in other cash distributions, more external financing, or rescheduling marginal projects. The two giants' suspension of buybacks in the second quarter already provides a real example. If operating projects persistently miss expected operating cash flows and fresh capital cannot take over, pressure may spread to service rental rates, customer performance of obligations and asset impairments. Projects with concentrated customers, rapid equipment replacement and earlier debt maturities are most exposed.
Ultimately, the current payers for nearly $600 billion of U.S. AI investment are technology giants using core-business cash and investors providing equity, debt and project funding. End customers already pay for advertising, software, cloud and model services, but how much construction cost the incremental returns from these businesses can recover still depends on cash performance after commissioning. Shareholders, creditors and parties bearing contractual obligations will absorb any shortfall. The two platforms' cash flows in 2025 and the second quarter of 2026 show that capital expansion is already compressing existing cash headroom; financial constraints arise before demand stops growing.