On October 26, 2026, Claude developer Anthropic publicly filed a listing application with the U.S. Securities and Exchange Commission (SEC), proposing to trade on Nasdaq under ANT. The prospectus disclosed that day gave markets their first relatively complete view of the frontier model company’s financial structure. First-half 2026 revenue was US$16.286 billion, increasing by approximately 13 times the year-earlier amount. Its reported net loss reached US$80.748 billion, yet it generated US$974 million of operating profit in the second quarter.
Those contrasting figures trace the actual progress of large-model commercialization. Enterprise payments were expanding rapidly, and the financial-statement notes imply an 85.4% gross margin. Revenue growth on the existing compute pool had carried the company past quarterly operating breakeven. At the same time, substantial continuing research to preserve its lead across model generations, advance commitments for future compute and employee share compensation recognized following the listing would continue to reshape future income statements and cash flows.
The prospectus highlighted three strengths. First, revenue increased by roughly 13 times the prior-year amount in the first half, as enterprise payment demand expanded rapidly. Second, operating leverage began to materialize: the second quarter produced US$974 million of operating profit after share-based compensation. Third, the customer base broadened. By the end of September, more than 11,900 customers had each contributed at least US$100,000 over the preceding 12 months, while the top five customers’ revenue share fell from about 36% in the first quarter to approximately 21% in the third. Improving growth, profitability and customer composition together gave large-model commercialization firmer financial support.
Four concerns accompanied that progress. Maintaining model competitiveness required substantial ongoing research, while cloud distribution revenue sharing further reduced retained profit. Usage-based revenue also had a different time horizon from multiyear compute spending committed in advance; converting newly delivered capacity promptly into revenue remained a test. At the end of June, about US$26.6 billion of restricted stock unit compensation awaited recognition after listing and other conditions were satisfied, with subsequent expense and share settlement affecting profitability and earnings per share. Finally, public shareholders had limited influence over capital allocation. Turning commercial growth into common-share returns consistent with the valuation would still depend on sustained profits, reinvestment needs and dilution.

1. Financing revaluations drive the US$80.7 billion net loss; second-quarter operating profit reaches US$974 million
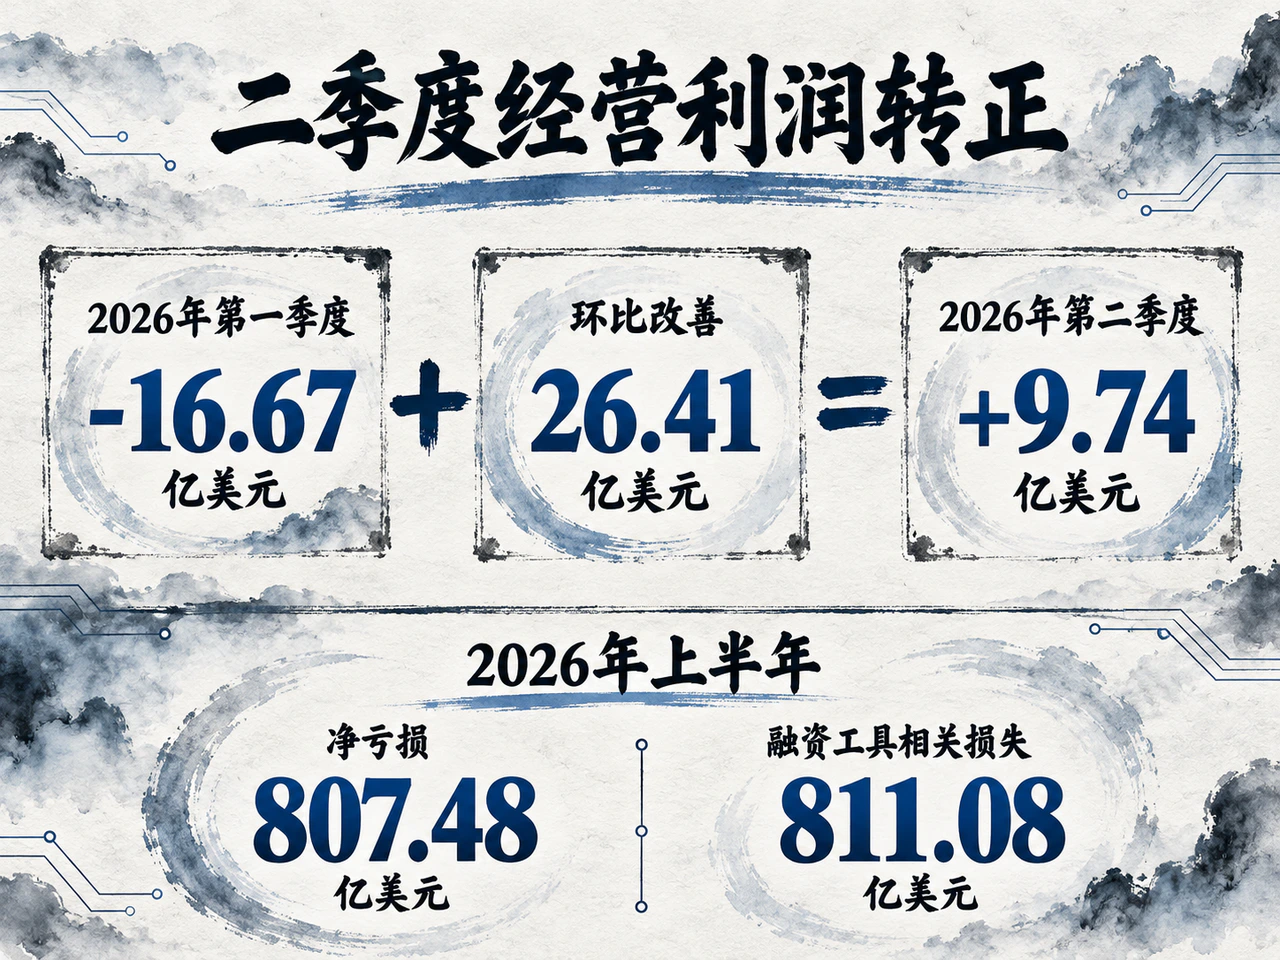
The first-half net loss of US$80.748 billion arose mainly below the operating line. Fair-value changes in convertible notes, derivative liabilities, simple agreements for future equity (SAFEs) and related financial instruments generated US$72.388 billion of losses. Other financial instruments produced a further US$8.720 billion of noncash net losses. Together, the two categories totaled US$81.108 billion, exceeding the period’s entire net loss.
The huge loss reflected the company’s earlier financing structure. Certain financing liabilities were measured at fair value. As Anthropic’s valuation increased sharply, the fair values of the associated liabilities and rights rose as well, with revaluation changes recognized directly in current earnings. These accounting losses required no equivalent current cash payment and did not represent cash bleeding from the core business. They nevertheless corresponded to conversion and preferential rights attached to earlier financing. They can be separated when evaluating operating efficiency, but the resulting conversion dilution must be included when assessing the ultimate value of common shares.
The operating inflection appeared in the second quarter of 2026. The company reported an aggregate first-half operating loss of US$693 million, but unaudited quarterly data in the filing showed a shift from a first-quarter operating loss of US$1.667 billion to a second-quarter profit of US$974 million. Second-quarter revenue increased 144% sequentially to US$11.555 billion, while total operating expenses rose 65% to US$10.581 billion. Revenue substantially outpaced compute and other expense growth, beginning to release operating leverage.
| Metric | First quarter 2026 | Second quarter 2026 |
|---|---|---|
| Revenue | US$4.731 billion | US$11.555 billion |
| Compute and infrastructure expenses | US$3.387 billion | US$5.558 billion |
| Total operating expenses | US$6.398 billion | US$10.581 billion |
| Operating profit / loss | −US$1.667 billion | US$974 million |
| Operating margin | −35.2% | 8.4% |
Crucially, the second quarter’s US$974 million of GAAP operating profit was after US$1.261 billion of share-based compensation. Excluding that expense, adjusted operating profit was US$2.235 billion. This suggested that once enterprise payment demand crossed a sufficient scale, the existing compute base could support positive operating earnings, providing initial evidence of the commercial viability of large-model services. The next test was whether revenue could continue to grow faster than costs as new compute capacity arrived and personnel compensation continued to be recognized.
2. The 85.4% gross margin deducts only direct service costs; US$9.7 billion of research and cloud revenue sharing determine overall profitability
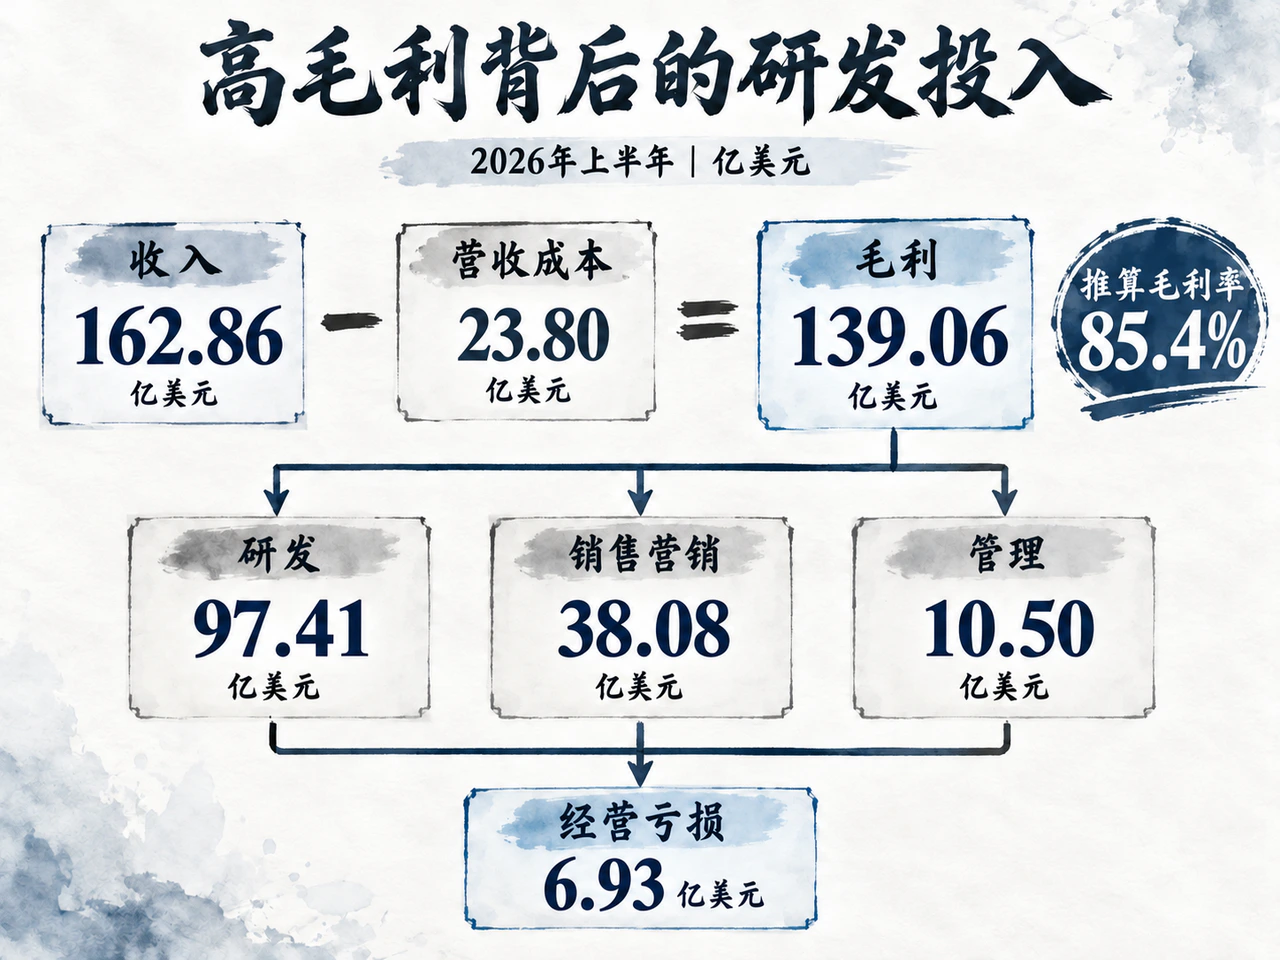
Anthropic’s primary income statement presents compute, personnel, sales and partner expenses by nature, while its notes also allocate cost of revenue, research and development, sales and marketing, and administration by function. On that functional basis, first-half revenue of US$16.286 billion against US$2.380 billion of cost of revenue implies a gross margin of approximately 85.4%. Cost of revenue mainly covers compute and infrastructure used to serve paying customers, alongside some personnel-related and allocated expenses. That level indicates substantial pricing headroom relative to the direct costs of paid model services.
The full economics of large models extend well beyond direct service costs. First-half research and development was US$9.741 billion, sales and marketing US$3.808 billion, and general and administrative expenses US$1.050 billion. Deducting those three categories produces the US$693 million operating loss discussed above.
Model research serves both to develop future capabilities and maintain current revenue. The filing said models released within the six months ended September generated more than 80% of third-quarter revenue. The company explained that enterprises’ selection and retention of Claude depended heavily on its capabilities remaining at the frontier. Continuing training, model iteration and foundational algorithm research were therefore difficult to cut without affecting existing revenue. Reclassifying all research as current cost of revenue would nevertheless lack a sound accounting allocation basis. Profitability assessment must therefore combine direct-service gross profit, the continuing research requirement and overall operating margin, rather than rely solely on the 85.4% gross margin.
Distribution channels also captured substantial economic value. In the first half, 48% of Anthropic’s revenue was distributed through cloud marketplaces. Cloud platforms collected payment from end customers, deducted related fees and remitted the balance to the company. Anthropic recognized this revenue gross and recorded the distribution share in sales and marketing. The year-on-year increase in fees paid to channel partners alone was about US$2.7 billion in the first half of 2026; the filing did not separately state total channel fees for the period.
Cloud companies are distribution channels that bring Claude into enterprise procurement systems, but they are also compute suppliers, strategic investors and potential competitors. A dispersed end-customer base does not imply dispersed distribution channels. Cloud platforms’ revenue shares, recommendation mechanisms and procurement terms will continue to affect the profit the model company ultimately retains.
3. A 900% net revenue retention rate and 11,900 major customers: enterprises move from pilots to scale
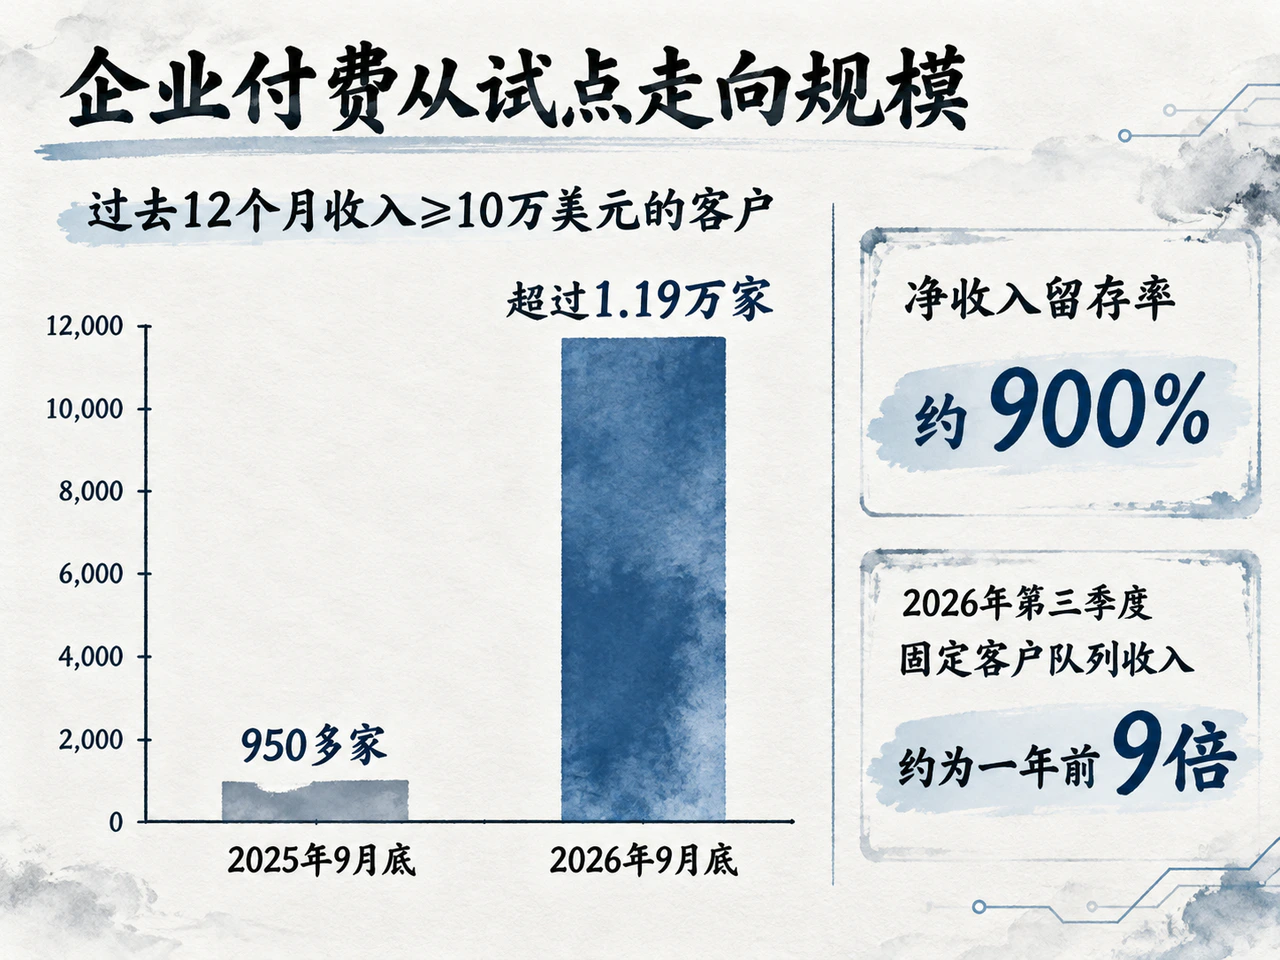
The most striking demand metric was approximately 900% net revenue retention at the end of September. Under the prospectus definition, this used a fixed cohort of customers generating at least US$1 in the third quarter of 2025, excluding fixed-price Claude Pro and Max subscribers. After expansion, contraction and churn, the cohort’s aggregate revenue in the third quarter of 2026 was about nine times its year-earlier level. Because the entry threshold was only US$1, the extremely high reading also reflected customers moving from small early tests into larger deployments. It did not mean every customer increased spending equally ninefold, nor did it represent locked-in revenue for the following year.
The expansion of higher-paying customer groups and declining concentration provided broader evidence of demand spreading than retention alone. By the end of September, over 11,900 customers had each contributed at least US$100,000 over the preceding 12 months, compared with more than 950 a year earlier. Over 1,900 had each contributed at least US$1 million. Meanwhile, the top five customers’ revenue share fell from approximately 36% in the first quarter to about 21% in the third, even as each of those five generated record revenue. Growth was extending beyond a few large customers into a wider paying base.
Better model capabilities and lower costs per task could together broaden use cases. The company said newer models reduced the cost of completing particular tasks, enabling enterprises to introduce AI into more activities. In coding, data analysis and workflow automation, customers pay for the economic value of completed work. Cheaper, more reliable task completion can make previously uneconomic long-tail tasks suitable for automation. However, model and product launches, expanded deployments and pricing changes occurred together during the reporting period. The financial data could not isolate demand’s price elasticity from lower prices. Total revenue growth after price cuts still depended on incremental usage consistently outpacing lower unit prices and competition.
This consumption-based model has precedents. At its 2020 listing, Snowflake recognized revenue mainly from actual compute, storage and data-transfer consumption. Its prospectus likewise showed how expanding customer usage and cloud-cost optimization could improve product gross margins together. Revenue in a consumption model can rise rapidly as customers’ businesses scale, but it can also come under immediate pressure when usage slows.
About 80% of Anthropic’s first-half revenue was usage-based, although noncancelable purchase commitments locked in some future demand. At the end of June, remaining performance obligations (RPO), including deferred revenue and future revenue under noncancelable commitments, totaled US$10.8 billion. Approximately 75% was expected to be recognized over the following 12 months, providing some near-term visibility. The company also estimated that roughly 5%–7% of revenue in the first three quarters came from customers later identified as violating usage policies or commercial terms. As detection and access restrictions strengthened, that historical service revenue could not be treated as a reliably continuing future base. Growth momentum would still depend on compliant mature customers expanding usage and new customers moving into higher-spending groups.
4. Usage revenue and committed compute have different horizons: vast purchase obligations and pending share compensation
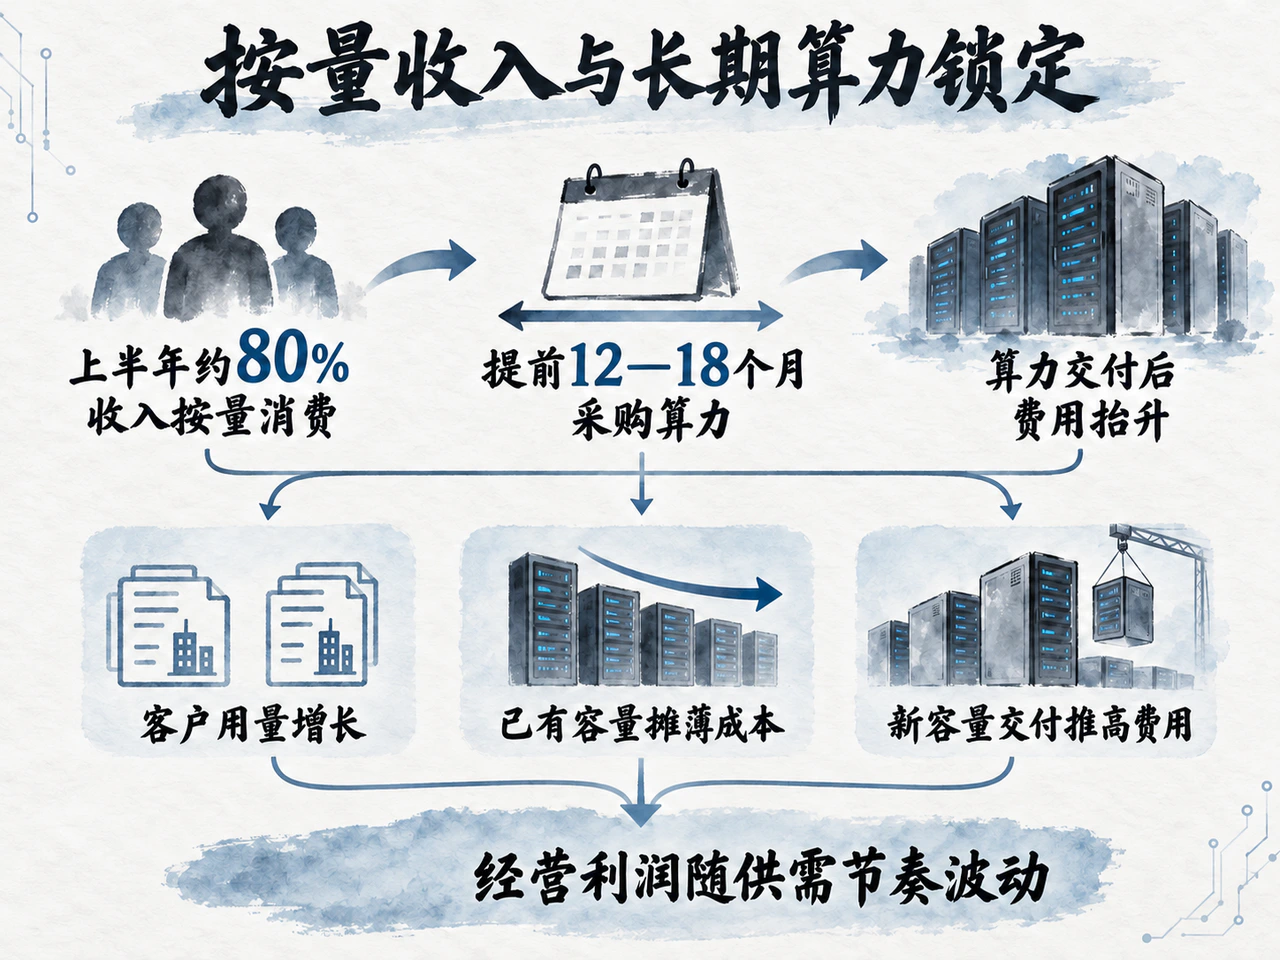
Revenue is mainly consumption-based, but compute must be secured in advance. That difference in timing is a major source of earnings volatility. Anthropic typically procures capacity 12–18 months ahead. Multiyear contracts make near-term costs relatively rigid, with expenses broadly recognized as capacity becomes available. When customer usage grows quickly, more revenue spreads across the existing compute costs. When another large tranche of capacity arrives, expenses step up again.
From the first quarter of 2025 to the second quarter of 2026, revenue per US$1 of compute and infrastructure expense rose sharply from approximately US$0.40 to US$2.08. The improvement combined model and system efficiency, stronger customer demand and timing differences in compute delivery. It could not simply be equated with the reduction in the cost of a single inference.
Having previously constrained product development and deployment by underestimating compute demand, Anthropic chose to secure supply through multiple clouds, multiple chip architectures and unified resource scheduling, allowing technical advantages to become revenue quickly when demand surged. If demand growth slowed, however, the room to adjust would differ substantially across contracts:
- Long-term Amazon and Google commitments: the Amazon agreement requires minimum spending of US$110 billion from May 2026 through April 2036. The basic Google arrangement entails approximately US$114.5 billion of minimum purchases from April 2026 through July 2033. Both contracts include shortfall-payment provisions for underutilization. Weaker-than-expected downstream demand would directly reduce returns on committed spending.
- Flexible SpaceXAI agreement: approximately US$120.5 billion represents potential maximum spending. After the initial noncancelable period, either party may terminate with 90 days’ notice, making it substantially less rigid than long-term minimum purchase commitments.
- Broadcom equipment leases: five-year equipment leases entail approximately US$161.2 billion of total payments excluding interest. Payments generally begin when equipment is ready for service, but certain facility delays may trigger obligations earlier. Lease payments can therefore become misaligned with the pace of revenue ramp-up.
The contracts span different periods and include minimum purchases, cancelable capacity and lease obligations. Simply adding them as immediate rigid debt would obscure the actual financial questions: when each tranche of compute arrives, when payments begin, what exit conditions apply and how much customer cash is collected over the same period.
The company currently had a substantial funding buffer. Cash, cash equivalents and short-term investments totaled approximately US$131.7 billion at the end of June, largely supported by US$110.774 billion of net financing cash inflows in the first half. Operations had also begun generating cash: first-half net operating cash flow was US$3.929 billion, including a net US$1.168 billion contribution from changes in operating assets and liabilities. That contribution included working-capital timing effects such as consuming prepayments and increases in payables and deferred revenue. The remainder reflected the net loss adjusted for noncash items. Capital expenditure would still require payment, and finance-lease principal repayments were classified as financing cash flows. Current operating cash flow alone therefore could not establish coverage of all future cash obligations.
Listing would also trigger recognition of substantial share compensation. At the end of June, approximately US$26.6 billion of restricted stock unit (RSU) compensation awaited satisfaction of listing and other performance conditions. Of that amount, US$2.9 billion related to service conditions already wholly or partly satisfied; the remaining US$23.7 billion was expected to be allocated over a weighted-average period of approximately 2.1 years after the conditions were met. After June, the company approved further listing-contingent RSUs with total fair value of US$5.8 billion. It also recognized US$2 billion of third-quarter operating expenses for employee donation-matching obligations, settled in shares in October. These amounts represent pending compensation, grant value and already-recognized operating expense, respectively. They cannot be added into a single cash payment at listing, nor should they be deducted retrospectively from second-quarter profit. Subsequent expense recognition and share settlement would nevertheless affect reported profits and per-share economic returns.
5. At a discussed US$1.5 trillion–US$2 trillion valuation, common-share returns face earnings and governance constraints
With the financial data public, private-market investors and academics quickly focused on the relationship between improving fundamentals and valuation. In an October 26 interview, Redpoint partner Erica Brescia welcomed the profitability trend and expansion of major customers. University of Maryland professor Daniel McCarthy also highlighted larger deployments and profitability under high compute utilization. Before the filing, on October 22, New York University professor Aswath Damodaran had warned in discussing AI-company pricing that even using revenue run rates rather than profit as the valuation denominator still embeds assumptions about eventual margins, reinvestment and business risk. Changing the revenue metric does not remove the valuation problem; it places the central assumptions behind the denominator.
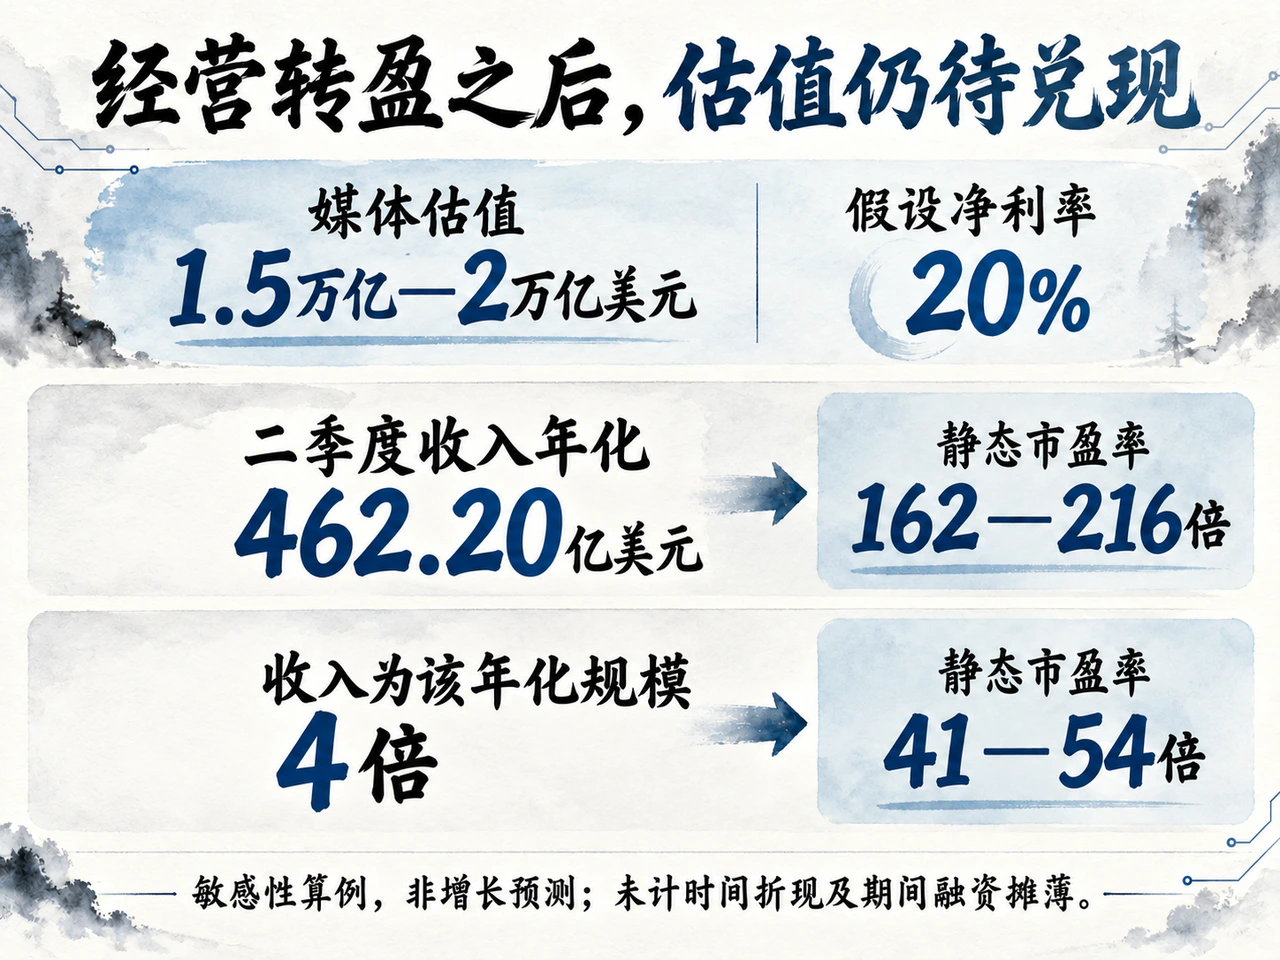
The public filing had not fixed an offer price or share count. Using the media-reported US$1.5 trillion–US$2 trillion valuation range and mechanically multiplying the latest complete quarter’s revenue, second-quarter 2026 US$11.555 billion, by four gives US$46.220 billion of annualized revenue. The equity valuation range is approximately 32–43 times that amount. The annualization is neither a full-year 2026 forecast nor the company’s defined revenue run rate, and the multiple has not been adjusted for post-listing cash, debt or conversions to become an enterprise-value multiple.
Supporting that valuation would require very high future earnings. In a static sensitivity illustration, not a growth forecast and excluding discounting and intervening financing dilution, holding revenue at the US$46.220 billion annualized level and assuming a 20% steady-state net margin produces US$9.244 billion of annual net profit. A US$1.5 trillion–US$2 trillion valuation would then imply approximately 162–216 times earnings. If revenue reached four times that annualized level at the same 20% net margin, the ratio of equity value to hypothetical annual profit would fall to about 41–54 times. The second quarter’s 8.4% operating margin demonstrated an ability to turn profitable, but absorbing a trillion-dollar valuation still required both substantially larger revenue and sufficient sustained net profit.
The company defines its revenue run rate as the latest 28 days of usage-based charges multiplied by 13, plus the current month’s subscription charges multiplied by 12. During rapid expansion, that measure can reflect the immediate pace of activity better than historical annual revenue, but it remains a linear extrapolation of short-term usage rather than a firm commitment to future cash receipts. Ultimate investor returns still depend on the additional compute and research needed for each stage of growth, net cash retained at maturity and the number of new shares issued along the way.
Public shareholders would also have tightly limited influence over capital allocation. Under the structure described in the filing, the Long-Term Benefit Trust generally has the right to appoint and remove a majority of directors. Before the listing completes, the company also plans to issue special Class F shares to entities holding the interests of seven founders, giving them 50.1% of voting power on general shareholder matters. After listing, the trust and Class F shares would together dominate board appointments and removals. Ordinary shareholder voting would offer public investors little scope to redirect research and capital expenditure. The structure aims to protect long-term safety research and public-benefit goals, but it also requires secondary-market investors to account for weaker control rights in valuation. Earlier preferred-share financing valuations likewise include special protections such as liquidation preferences and conversion terms and cannot directly serve as a floor for post-listing public common-share value.
The most substantial advance in Anthropic’s filing was verifiable financial reporting of progress in large-model commercialization: rapidly expanding higher-paying enterprise groups, falling revenue concentration and a quarterly operating profit after substantial share compensation. Converting that progress into common-share returns at a trillion-dollar valuation still required navigating the next cycle of model research, additional compute delivery and recognition of pending share compensation. The key measures to watch were whether operating margins held after new capacity entered service, whether mature customers continued increasing payments, and how much operating cash remained after capital expenditure and finance-lease principal repayments.