From October 5 to October 11, 2026, global markets combined modest recoveries in stocks and bonds with deep divergence within asset classes. The S&P 500 gained 1.15%, led by energy and financials; Nasdaq 100 gains narrowed to 0.24%, while the small-cap Russell 2000 fell 0.91%. The US 10-year Treasury yield edged down 4 basis points to 5.24%. Quality corporate spreads narrowed while high-yield premiums widened. Brent rose 2.42% to $104.72 a barrel, COMEX gold gained 1.30% to $4,216.30 a troy ounce, and the dollar index stayed elevated at 102.21, up 0.27% for the week. Resilient demand underpinned corporate fundamentals, but high energy costs and persistently high rates intensified scrutiny of cash-flow quality and debt-servicing capacity, concentrating capital in assets offering greater certainty.
September service costs hit a more-than-two-year high; cooling consumption and inflation expectations constrain rate cuts
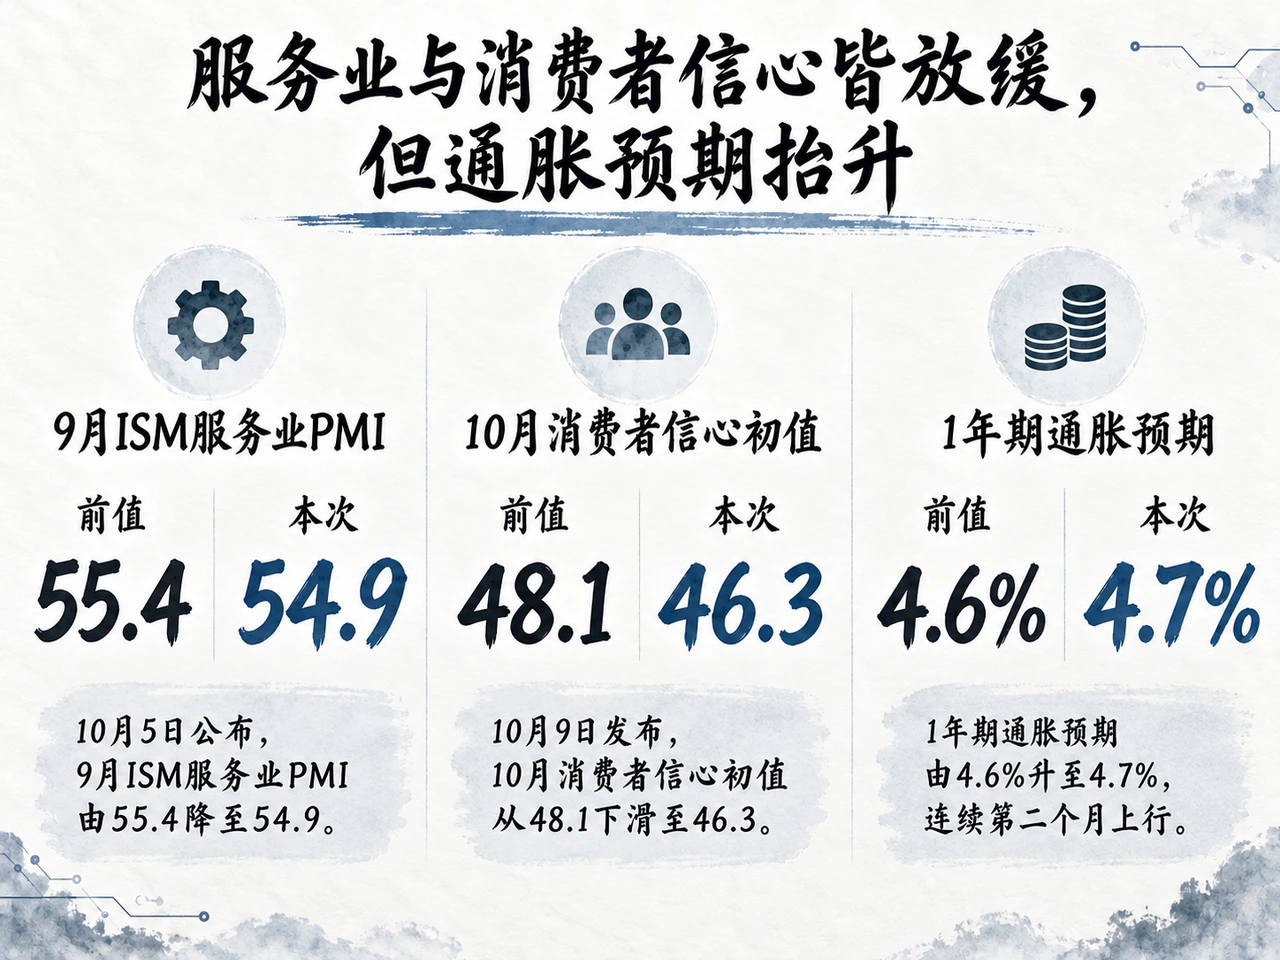
US data released last week showed slower service-sector expansion but a solid order and employment base. September ISM services PMI, released October 5, fell from 55.4 to 54.9 and business activity from 61.7 to 56.5. New orders remained at 59.8, however, while employment returned to expansion, rising from 47.8 to 50.1, indicating that businesses still faced growing final demand.
Cost pressure presented a sharper tension. September's services prices index jumped from 72.6 to 74.0, its highest since July 2022; supplier deliveries rose from 51.3 to 53.2, indicating longer delivery times. ISM identified higher fuel costs and tariff disruptions as respondents' most prominent supply-chain difficulties. Delays and upstream price increases reduced the scope for slower demand to moderate costs naturally.
Household living-cost pressure was fully evident in surveys. University of Michigan data released October 9 showed preliminary October sentiment falling from September's 48.1 to 46.3, with current conditions dropping from 50.9 to 44.7. The survey explicitly identified high prices and borrowing costs as substantially worsening durable-goods buying conditions, with confidence particularly damaged among lower-income households and those holding fewer stocks. One-year inflation expectations rose from 4.6% to 4.7%, and long-term expectations from 3.4% to 3.5%, both increasing for a second consecutive month.
The labor market and business spending continued to offset weakness. Initial US jobless claims were 197,000 in the week ended October 3, down 2,000 from the revised previous week and better than Reuters' 200,000 forecast. Continuing claims increased 17,000 to 1.716 million in the week ended September 26. Low layoffs protected working households' basic cash flow, while reemployment friction helps explain why income resilience failed to reverse weakening confidence. BEA data released October 6 showed the August trade deficit widening from a revised $92.8 billion to $105.6 billion. Imports rose 4.3% month on month, far above exports' 1.4%, including increases of $6.2 billion in capital-goods imports and $2.4 billion in semiconductors. Trade data suggest domestic demand shifting toward business capex: equipment purchases and restocking support fixed investment, contrasting with households' living-cost pressure.
Markets therefore focus closely on September CPI and PPI scheduled for October 14 and 15. Whether surging service inputs and rising household inflation expectations have already fed inevitably into broader final prices will directly test the subsequent policy-rate path and determine whether the Treasury recovery window can remain open.
10-year Treasury yield falls to 5.24%; auctions steady but credit spreads diverge
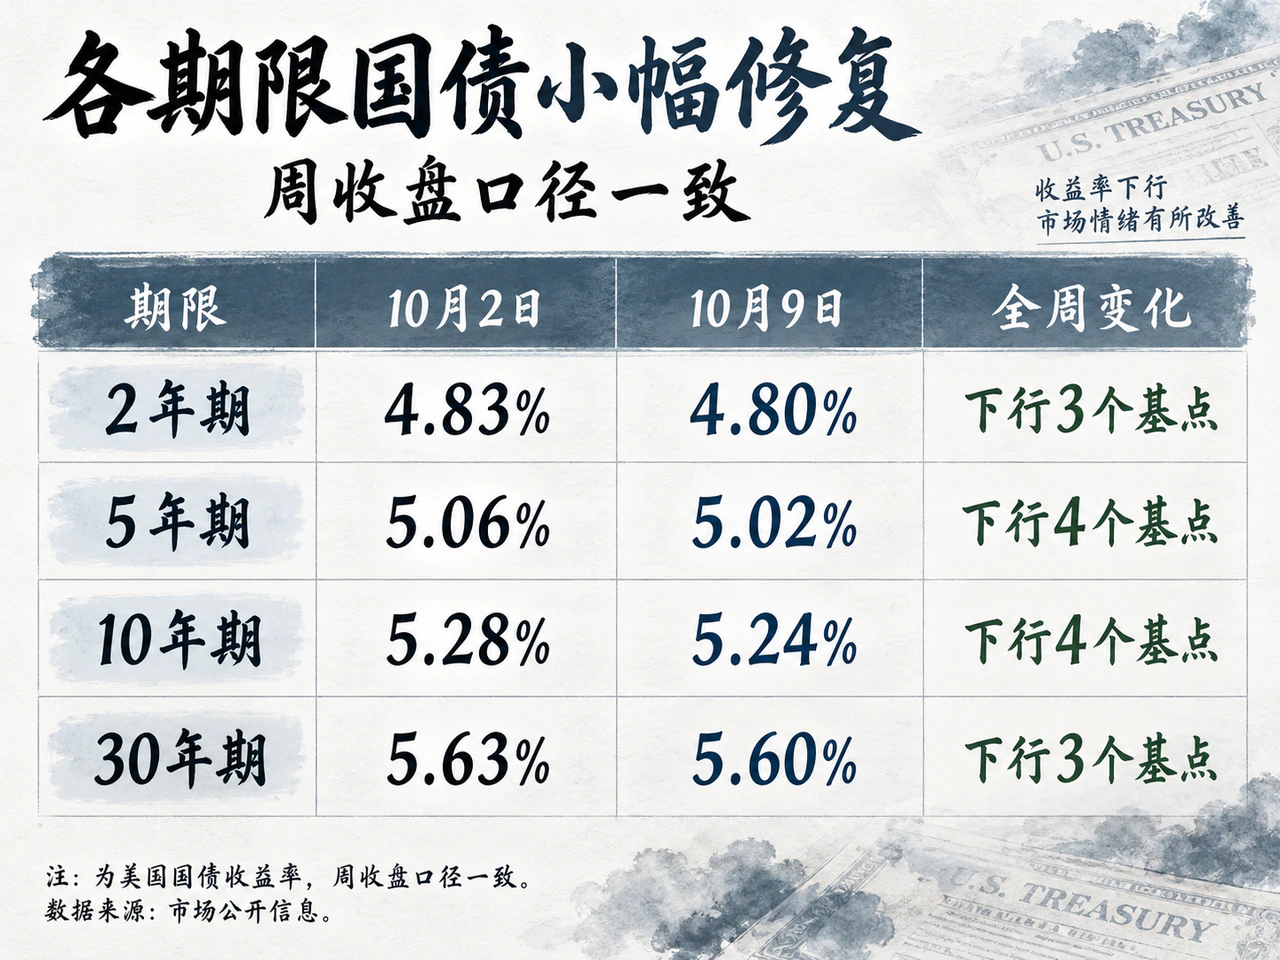
The Treasury Department's daily yield-curve measure showed narrowly lower yields across the week. On October 9, the 2-year closed at 4.80%, down 3 basis points from October 2; the 10-year at 5.24%, down 4 basis points; and the 5-year and 30-year fell 4 and 3 basis points, respectively. The overall curve shift was restrained.
| Maturity | October 2 | October 9 | Weekly change |
|---|---|---|---|
| 2-year | 4.83% | 4.80% | -3 basis points |
| 5-year | 5.06% | 5.02% | -4 basis points |
| 10-year | 5.28% | 5.24% | -4 basis points |
| 30-year | 5.63% | 5.60% | -3 basis points |
Intraweek moves showed intense competition between expectations. The 2-year dipped to 4.75% on Thursday before rising 5 basis points Friday as inflation expectations shifted; the 10-year edged up after Thursday's weekly low of 5.22%. Short rates repeatedly balanced slowing growth against hiking concerns, while firm auction demand supported lower long yields. Reuters reported that the Treasury's $39 billion 10-year auction October 7 cleared at 5.30%, below pre-auction expectations. The bid-to-cover ratio was 2.77, above the preceding six-auction average of 2.54; primary dealers took only 2.5%, indicating strong real-money end-investor appetite at these absolute yields.
Standard Chartered's October 9 weekly report said marginal labor-market cooling temporarily eased near-term tightening fears, but sticky service prices and crowded short positions amplified weekly volatility. Elevated inflation expectations limited scope for deep rate declines. At October 8, the 10-year TIPS real yield was 2.87%, down 5 basis points from October 2, providing limited relief in real financing costs.
Rate improvements did not benefit corporate credit evenly. Through October 8, ICE BofA US investment-grade corporate option-adjusted spreads narrowed 3 basis points from October 2 to 82, while high-yield spreads widened 5 basis points from 310 to 315. Investors were willing to reduce premiums only for quality issuers with sound balance sheets; weaker, lower-rated borrowers still required more compensation for default risk.
Offshore and overseas sovereign borrowers also faced financing pressure. Bloomberg reported October 8 that no Asia-Pacific company had yet priced a syndicated dollar bond that month; regional dollar yields had touched 6.1% earlier in the week. Asian companies with cheap local-currency funding preferred to wait, but issuers facing hard offshore maturities remained under pressure. A few basis points of Treasury relief were insufficient to reopen issuance. In Europe, Reuters reported October 8 that France's 10-year yield approached 5%, nearly 80 basis points above early September. With a €340 billion issuance plan for 2027, uncertain budget approval and deficit adjustment intensified scrutiny. Even within a shared high-rate cycle, sovereign credit and fiscal-capacity differences increasingly determine final risk pricing.
Energy and financials lift S&P 500 by 1.15%; technology capex faces revenue-delivery scrutiny
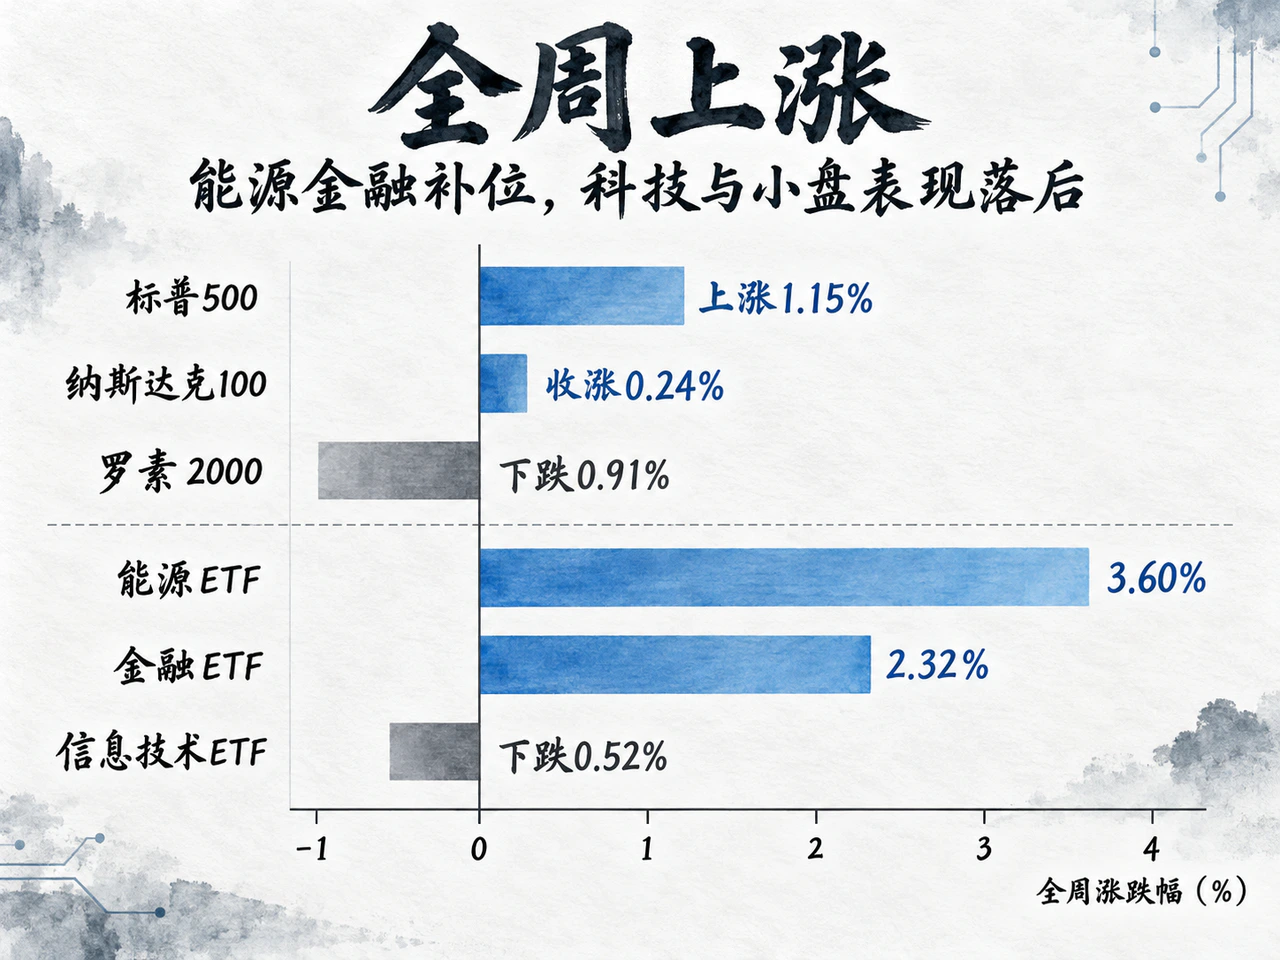
Relative to the October 2 close, US large-cap indexes rose but sectors diverged sharply. The S&P 500 gained 1.15% to 7,811.54; the Dow 0.93% to 51,654.95; the Nasdaq 100 just 0.24% to 30,883.15; the Russell 2000 fell 0.91% to 2,806.98. Energy ETF XLE gained 3.60% and financials XLF 2.32%, while technology XLK fell 0.52%. Rotation into energy and financials lifted broad indexes, while high-rate discounts persisted for unprofitable and small-cap stocks.
AI infrastructure investment continues extending materially into energy. Google and Constellation announced October 6 that a 20-year power-purchase agreement would support an 890-megawatt expansion of an existing nuclear plant, involving investment above $4.3 billion and first additional power expected in 2028. They separately signed a 15-year supply assurance covering 2,700 megawatts. Computing expansion's need for grid accommodation has deeply linked capex to baseload supply such as nuclear power.
Alongside massive spending, public markets intensified scrutiny of AI monetization and revenue quality. CNBC reported OpenAI recently disclosed annualized revenue of $50 billion at end-September; the previously widely cited $68 billion figure included partners' gross revenue. The differing definitions prompted recalibration. Monetization concerns accompanied Thursday's sharp tech retreat: AMD fell approximately 5%, semiconductor ETF SOXX 3.5% and Nvidia nearly 3%. With capex enormous, markets increasingly scrutinize profit distribution within the value chain and whether corporate free cash flow can keep pace.
High earnings expectations also increased share-price sensitivity. Reuters, citing LSEG October 9, estimated S&P 500 third-quarter earnings growth around 31% year on year, with roughly two-thirds of incremental earnings attributable to technology giants including Alphabet, Amazon and Meta. US semiconductor earnings were expected to rise about 136%, still high but slower than approximately 158% in the second quarter. The Nasdaq 100 retreated after Tuesday's 31,224.47 high, touched 30,725.81 Thursday and rebounded Friday without regaining Tuesday's level. Meanwhile VIX fell from the previous Friday's 15.31 to 14.84. Technology's retreat did not spread panic; investors were primarily rotating tactically across industries. Upcoming bank results will test whether traditional cyclical sectors can deliver substantive earnings support.
Supply disruptions lift Brent 2.42%; safe-haven and allocation demand support gold
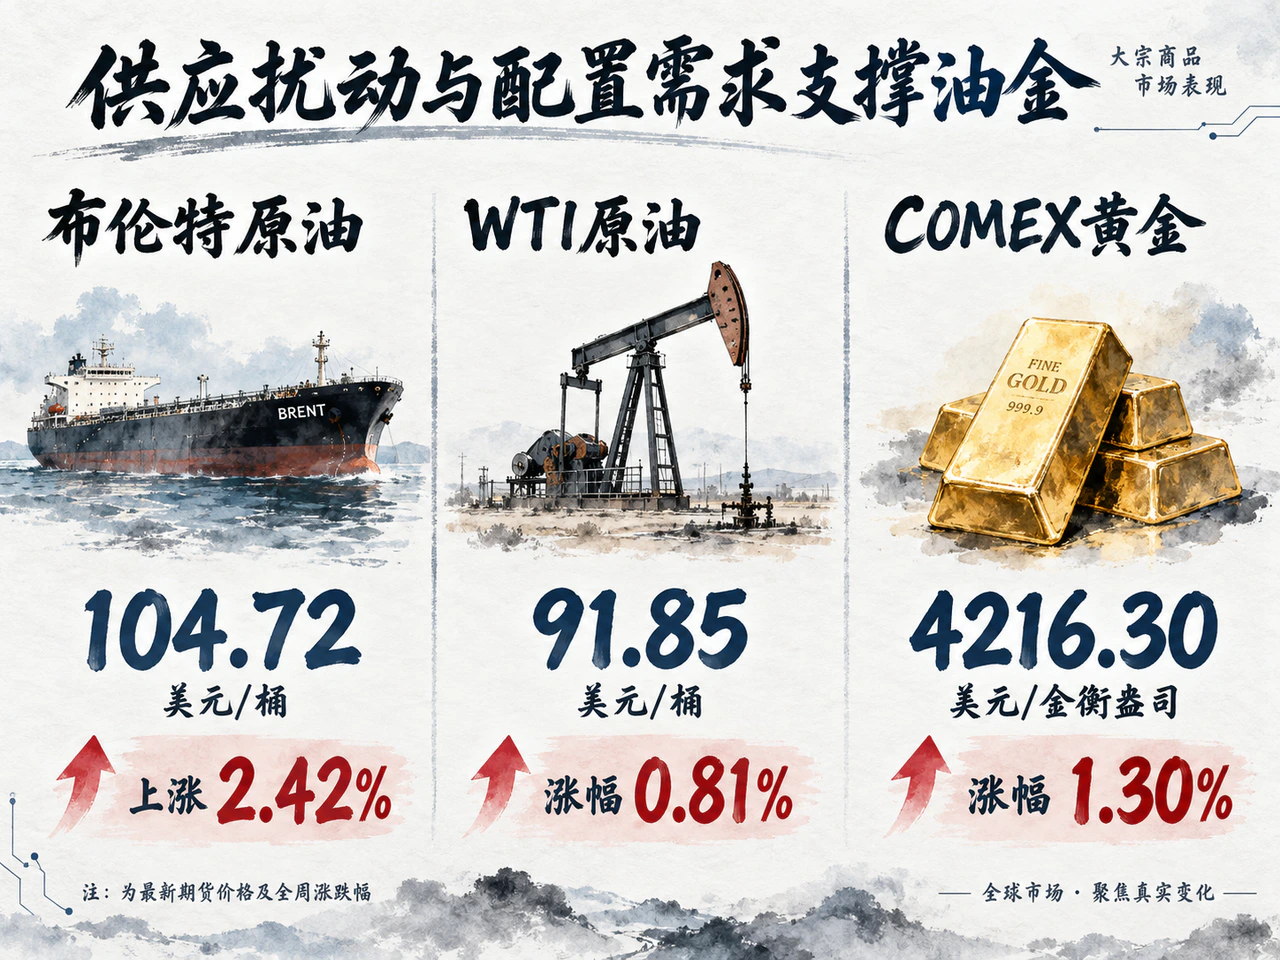
On vendor daily continuous-futures closes, both oil and gold rose for the week. Brent increased from $102.25 to $104.72 a barrel, +2.42%; WTI from $91.11 to $91.85, +0.81%; COMEX gold from $4,162.30 to $4,216.30 a troy ounce, +1.30%. Thursday supplied most of oil's gains, while gold recovered its midweek pullback before the weekend.
Oil reflected the contest between emergency supply buffers and unexpected disruptions. On October 7, the IEA agreed to accelerate previously planned stock releases; Reuters said full on-schedule delivery would inject approximately 100 million barrels into spot markets, briefly depressing prices. Extreme weather and geopolitical shipping premiums quickly reversed expectations. Reuters disclosed October 9 that a hurricane had shut approximately 1.3 million barrels per day of US Gulf of Mexico crude production, 62.9% of regional output. Insurance and transport-disruption risks around Iranian waters compounded a substantial physical premium. The EIA's October outlook raised its fourth-quarter 2026 average Brent forecast $14 to $105 a barrel to reflect hard supply constraints, while setting 2027's average at $84 on expected capacity recovery.
New energy-policy uncertainties emerged over the weekend. Reuters reported that Trump announced October 9 that Russia would supply diesel to US and international markets, with temporary import authorization issued by the US Treasury. On October 11, seven bipartisan US senators jointly questioned its legality and sought revocation, while Treasury Secretary Bessent said it would continue. The same day, Trump announced agreement on a Russia-Ukraine energy-infrastructure ceasefire, but Ukraine said it awaited implementation details. The authorization's durability and execution of ceasefire terms will be central near-term fuel-cost variables.
Gold strengthened despite the dollar index's 0.27% rise to 102.21. Lower nominal and real Treasury yields reduced the opportunity cost of holding non-yielding assets. World Gold Council data released October 7 showed $10 billion of September inflows into global physically backed gold ETFs, taking third-quarter net inflows to $31 billion; holdings rose 67 tonnes to 4,256 tonnes at month-end. By contrast, total COMEX gold net longs fell approximately 100 tonnes in September, reflecting different timing between sustained institutional allocation buying and profit-taking by futures speculators.
Asian indexes retreat from highs; Chinese fiscal policy and reverse repos support domestic demand
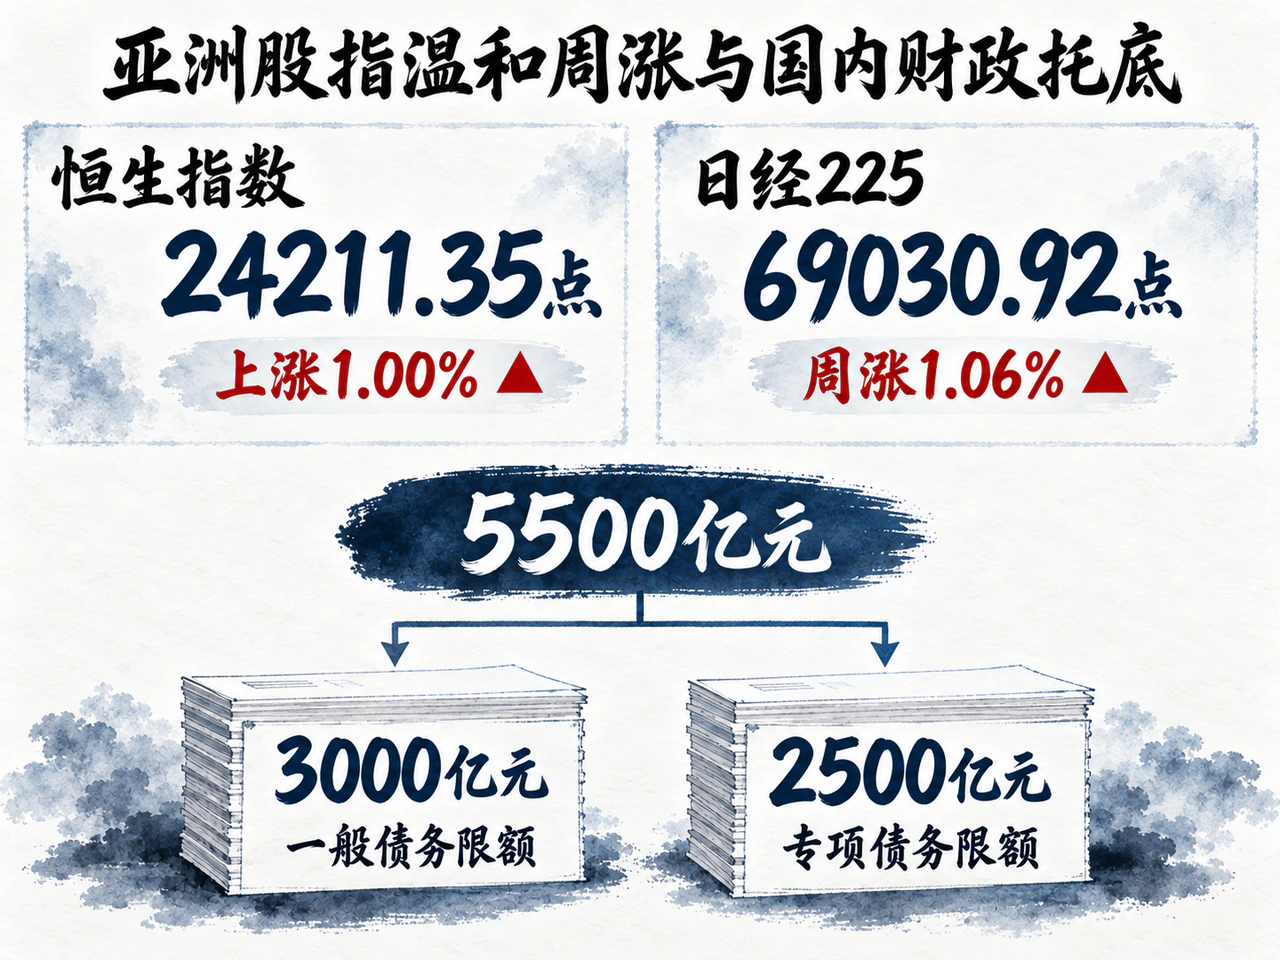
Asia-Pacific equities met resistance after rising, then consolidated unevenly. The Hang Seng closed October 9 at 24,211.35, up 1.00% for the week. The Nikkei 225 closed at 69,030.92, up 1.06%, but well below Tuesday's 70,683.98 close. Massive US technology capex continues stimulating demand for Japanese semiconductor equipment and Korean memory chips. Yet elevated prior expectations make small changes in order growth, currencies and margins amplify asset-price swings during this sensitive period.
Samsung guidance illustrated different profit transmission across the supply chain. Reuters reported expected third-quarter operating profit of KRW 107.4 trillion, slightly above LSEG SmartEstimate consensus of KRW 106.1 trillion. Markets nevertheless worried about slower sequential profit growth, won appreciation reducing translated overseas revenue and rising memory prices squeezing Samsung's own smartphone margins. Upstream component inflation is becoming a cost burden for end-device manufacturers.
Hong Kong equity pricing benefited from coordinated domestic policy and liquidity support. Xinhua reported October 9 that the Finance Ministry had arranged deployment of RMB 550 billion of unused local-government debt quota. The RMB 300 billion general-debt allocation went entirely to counties and districts, strengthening basic livelihood and operating finances. RMB 250 billion in special-debt quota targeted regions with effective fourth-quarter construction demand, prioritizing continuation of major projects and larger provincial economies to turn investment into actual construction activity.
Monetary policy maintained targeted support. Dongxing Fund's October 8 monitoring showed the PBOC conducting RMB 1.2 trillion of 3-month outright reverse repos, a net RMB 200 billion injection after matching maturities. Medium-term funding and fiscal-quota allocation jointly smoothed post-quarter-end liquidity and improved project-financing conditions.
Consumption showed modest marginal improvement. On October 9, People's Daily cited Commerce Ministry data showing that during the October 1–6 National Day holiday, foot traffic at 78 monitored major shopping districts and pedestrian streets rose 2.5% year on year and sales 4.7%. Consumer-goods trade-in support generated RMB 33.48 billion in related sales, gradually supporting durable-goods and service consumption.
External trade also sent easing signals. High-level China-EU economic and trade consultations October 8–9 reached consensus on hybrid-vehicle trade rules, corporate minimum-price commitments and easier export licensing for critical items. Subsequent China Daily and CNBC reports said specific auto-access arrangements still awaited final internal European legal approval, while critical raw-material export facilitation entered detailed implementation. Open negotiating channels reduced the immediate tail risk of escalation; actual earnings benefits for supply-chain companies depend on how quickly final agreements are signed and executed.
Across the week, modest global asset rebounds remained constrained by high energy costs and stubbornly high borrowing rates. Structural divergence within asset classes outweighed uniform market beta. With September US inflation and a new earnings season approaching, capital's choices among dependable cash flows, high-yield premiums and returns on real investment will become clearer.


