Bitcoin regained 83,000 USDT and Ethereum recovered toward 2,500 USDT as major crypto assets rebounded together after the previous day's sell-off. Against a backdrop of heavy selling in Asian technology and semiconductor shares, crypto displayed a degree of independence and resilience. Over a week, however, substantial drawdowns in major coins remained, and Bitcoin's relative strength within asset allocation was intact. With continued institutional ETF outflows weighing on the market, this rebound was largely driven by spot buying at lower levels. Whether the recovery could broaden further still depended on sustained spot demand and the forthcoming September US inflation data's impact on rate expectations.
Major assets recover broadly, but a one-day bounce leaves weekly divergence intact
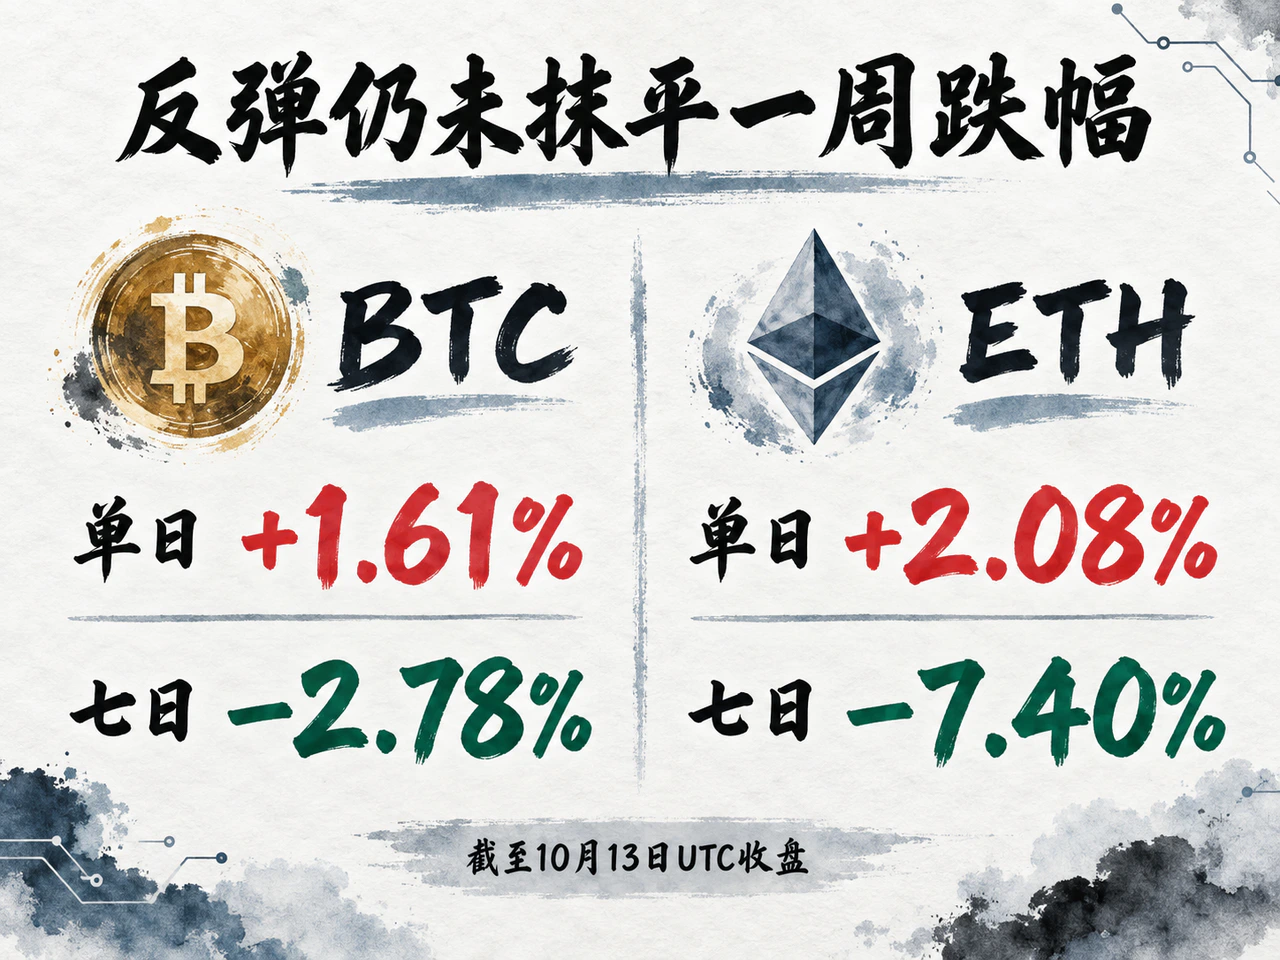
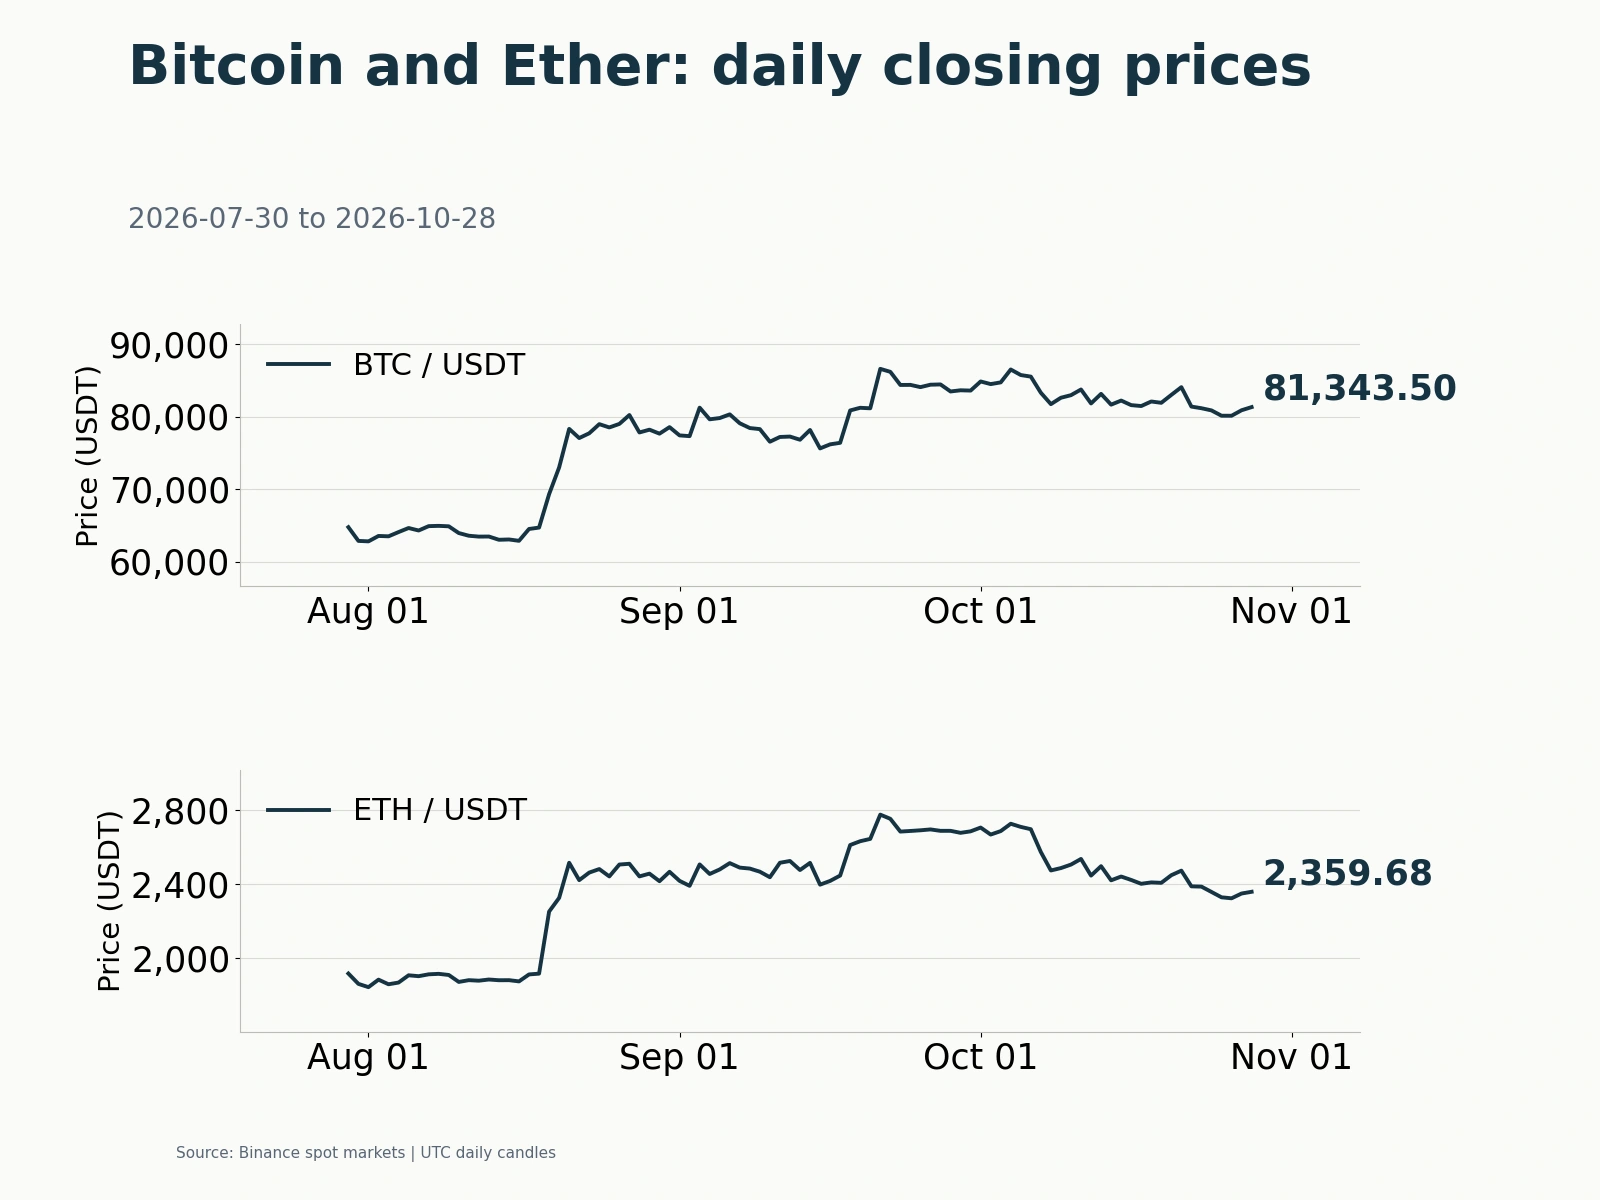
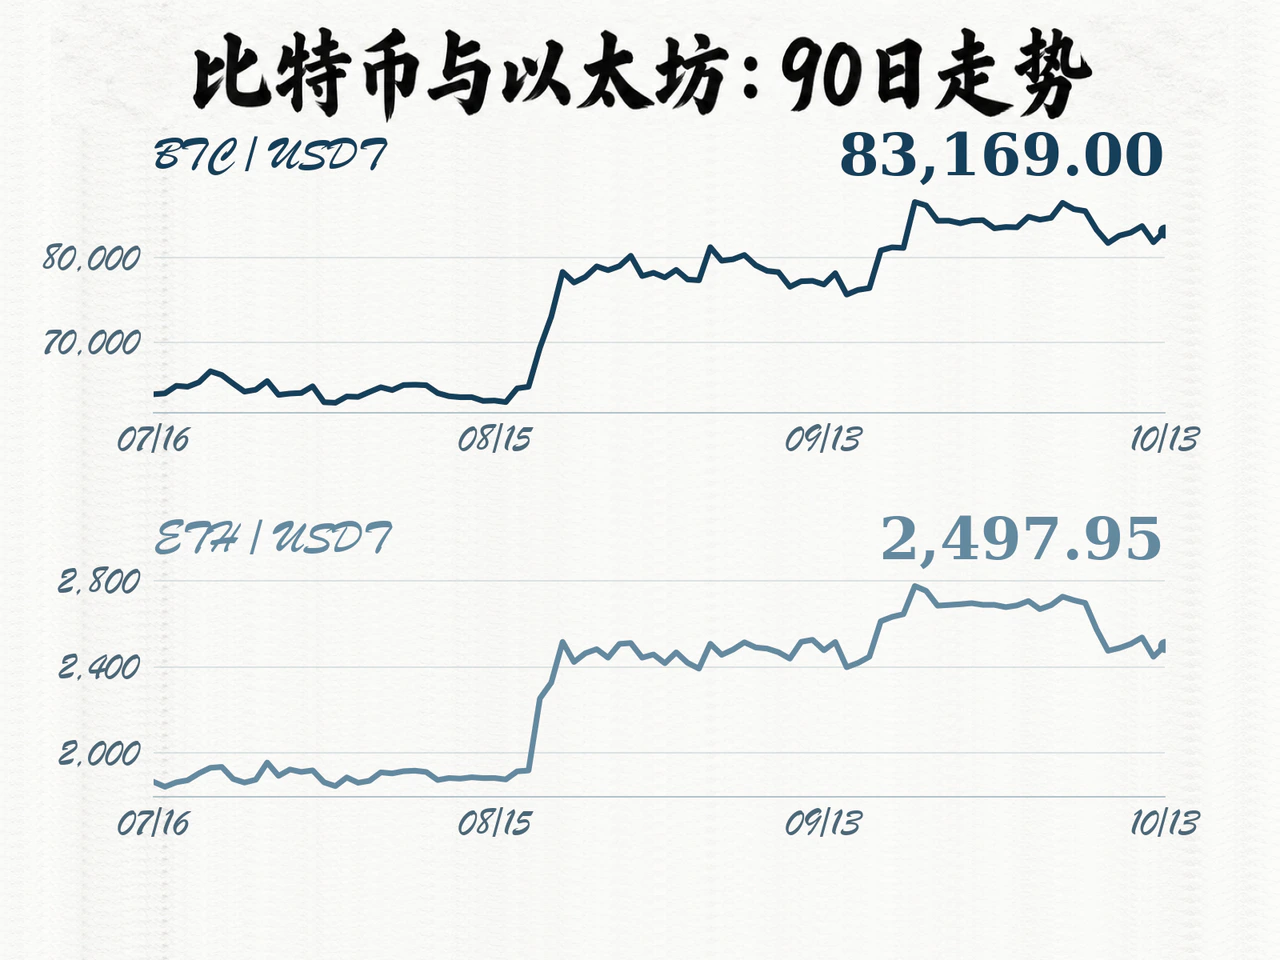
Using Binance spot UTC daily candles, as of 08:00 Beijing time on October 14 Bitcoin closed at 83,169 USDT, up 1.61% for the day, while Ethereum closed at 2,497.95 USDT, up 2.08%. Bitcoin's daily low was 81,033.66 USDT and its high was 84,168 USDT. Despite a strong rebound from the lows, it closed around 1,000 USDT below its peak. Ethereum traded between 2,409.09 and 2,538.52 USDT; its close likewise suggested some overhead selling pressure.
The rebound was broad. All eight highly liquid assets tracked—BTC, ETH, BNB, SOL, XRP, DOGE, ADA and LINK—rose on the day. DOGE gained 2.63%, XRP 1.78%, BNB 1.20% and SOL 1.01%.
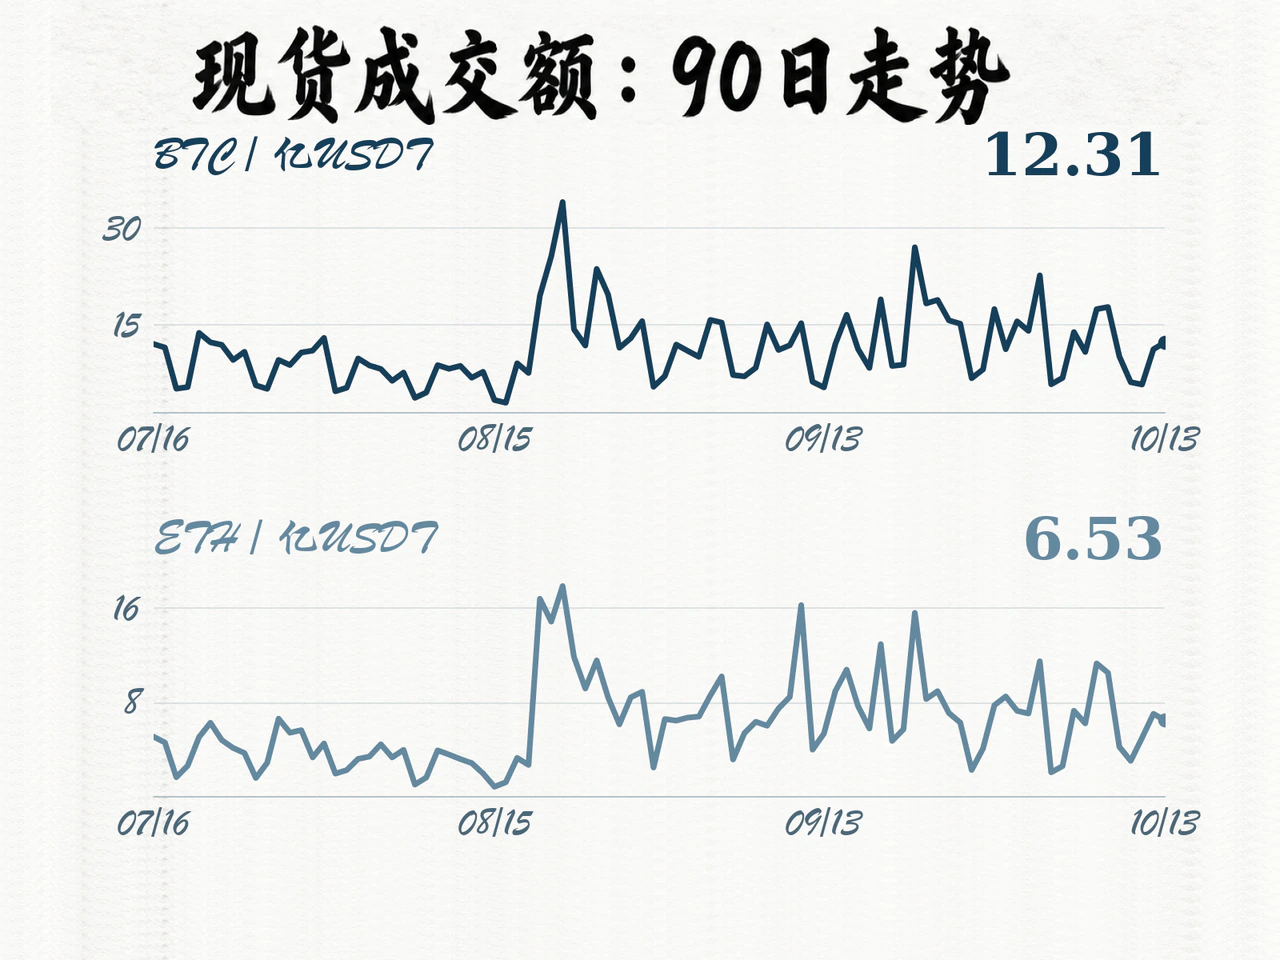
Divergent turnover, however, revealed differences in buying patterns. Binance BTC/USDT spot turnover reached 1.231 billion USDT, up 9.31% from the previous day, while ETH/USDT spot turnover contracted 7.69% to 653 million USDT. Ethereum's slightly stronger price bounce lacked a corresponding increase in volume. ETH/BTC recovered to 0.03003, up a modest 0.46%, reflecting a limited short-term improvement for Ethereum, but the overall ratio remained weak.
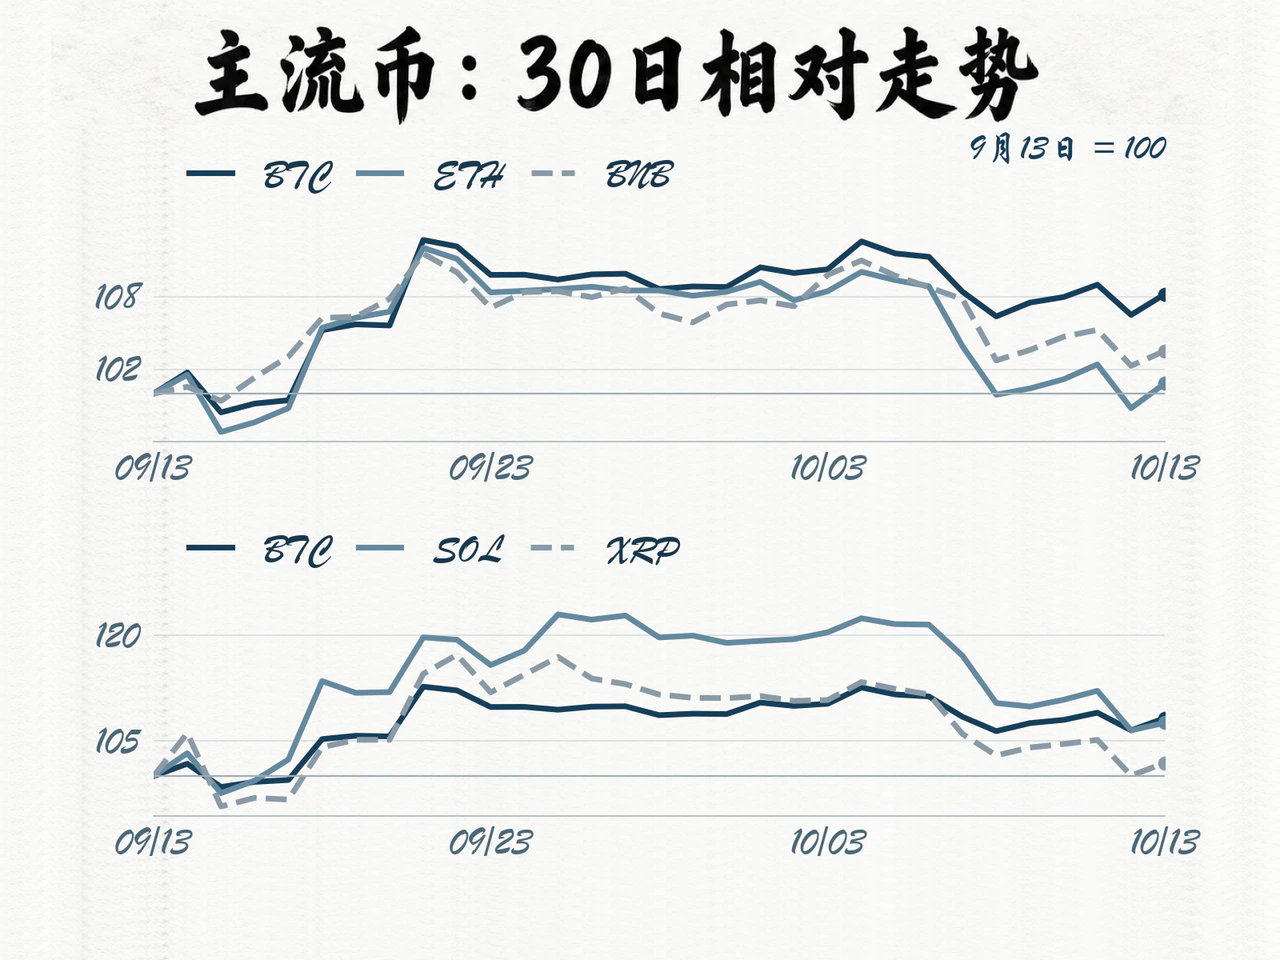
Over a longer horizon, one day's broad gains were far from reversing the past week's correction. Measured using consistent closing prices over the past 7 trading days, every sampled asset was lower: Bitcoin fell 2.78%, Ethereum 7.40%, BNB 4.85% and XRP 8.75%, while SOL and ADA lost 11.50% and 11.74% respectively. Given the wide differences in prior drawdowns, a synchronized rebound of 1% to 2% recovered only a very small portion of losses in the more deeply corrected non-core major coins.
The past 30 days showed an even clearer contrast: Bitcoin rose 8.23%, while Ethereum gained just 0.84%. The preference for the core asset was evident. CoinGecko data as of this morning put total crypto market capitalization at around $2.82 trillion, with Bitcoin accounting for 59.25% and Ethereum 10.82%. Bitcoin retained a firm grip on price leadership. Without meaningful strengthening in ETH and other major coins relative to Bitcoin, the breadth of the overall recovery would remain limited.
Spot demand offsets external shocks; the rebound still faces a CPI test

Cross-market transmission was a significant backdrop that day. During Asian trading, warnings from Broadcom's CEO about speculative AI investment and concerns over intensifying memory-chip competition helped send South Korea's KOSPI down around 5.5%. Heavyweights SK Hynix and Samsung Electronics plunged roughly 10% and 7% respectively. According to Stocktwits, Fundstrat co-founder Tom Lee warned that severe swings in external equity markets could increase investors' leverage and margin pressure, forcing them to sell holdings in liquid markets such as crypto to raise cash.
The market ultimately showed strong spot absorption. Citing trader Ted Pillows' analysis of spot cumulative volume delta (CVD), reporting indicated aggressive spot buying during Bitcoin's decline and recovery. This corroborated the 9.31% rise in Binance BTC spot turnover, suggesting clear active buying support at lower prices.
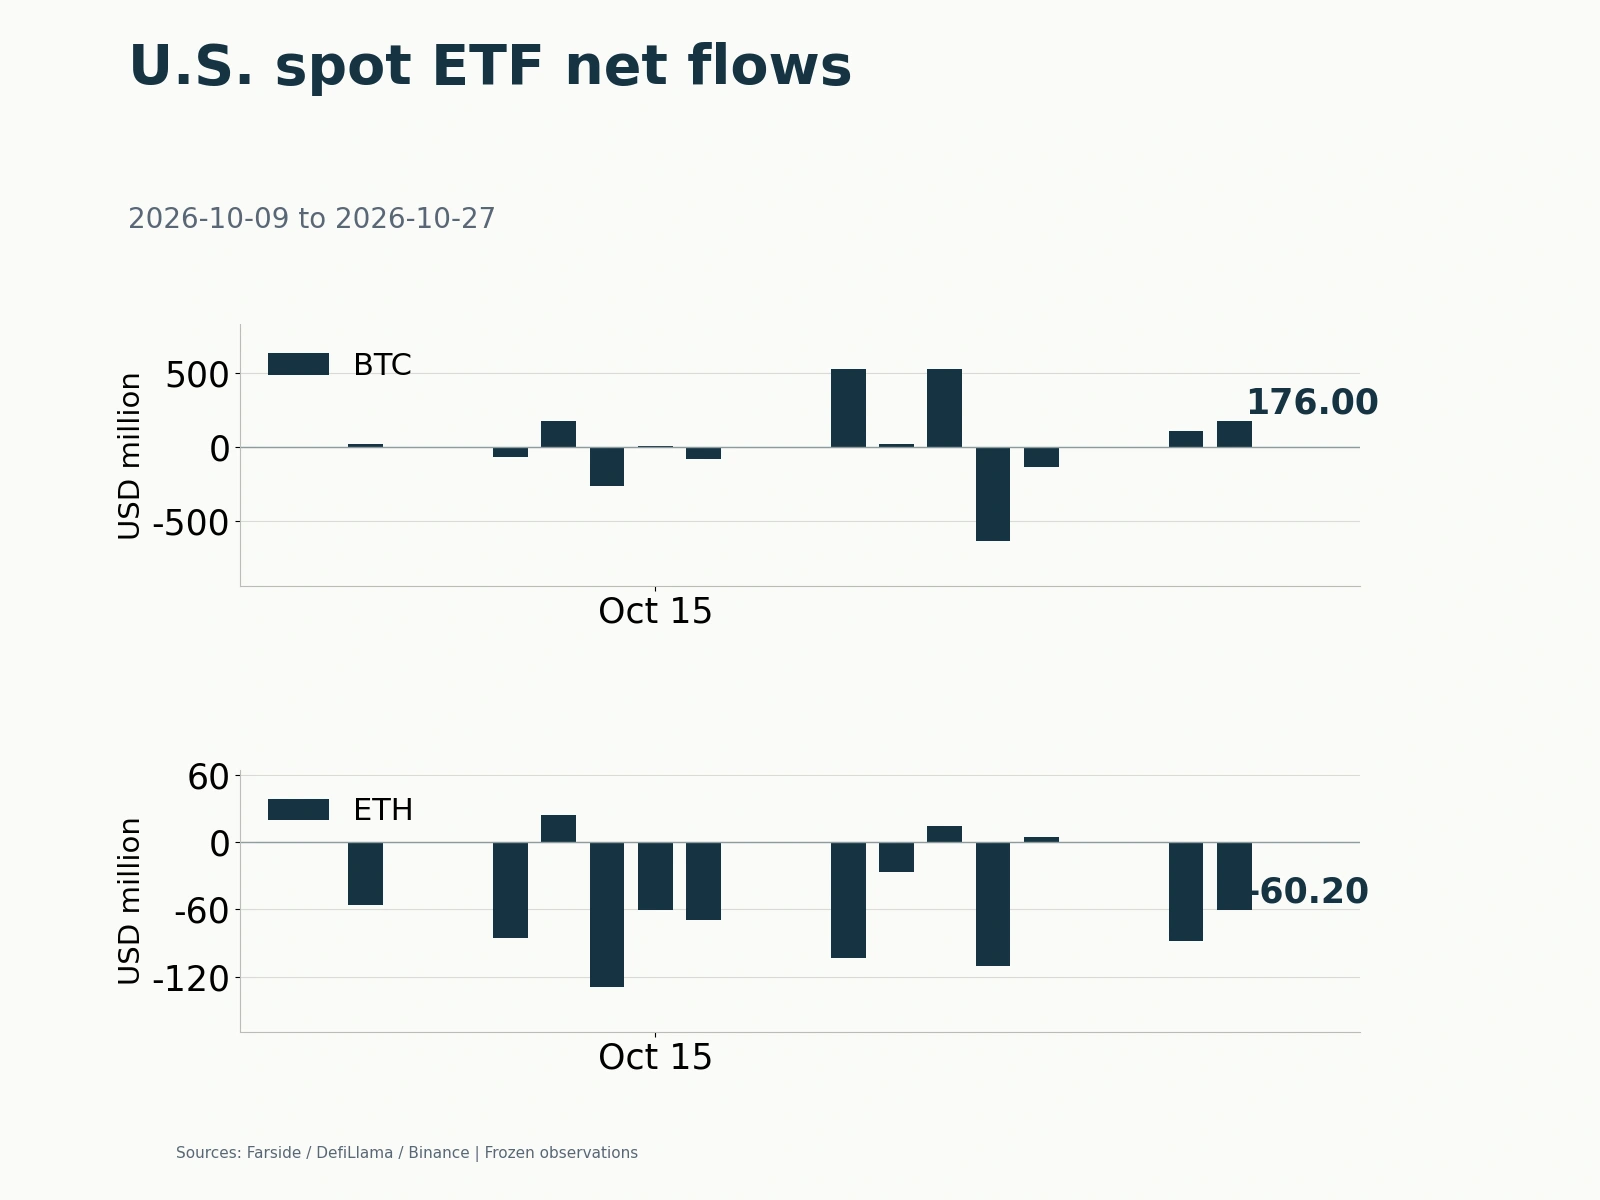
The macro and institutional funding backdrop had yet to turn comprehensively. SoSoValue data showed $681 million in net outflows from US spot Bitcoin ETFs in the week ended October 9, followed by approximately $65.4 million of net outflows on October 12. With allocation-oriented institutional money continuing to leave, the day's recovery looked more like a structural spot rebound after an oversold decline than evidence of a new wave of trend-following inflows.
The near-term focus had shifted to macroeconomic data. The US Bureau of Labor Statistics calendar scheduled September consumer price index (CPI) data for October 14 at 20:30 Beijing time, or 08:30 US Eastern time. Inflation would directly reshape pricing of the Federal Reserve's subsequent rate-cut path. A larger-than-expected cooling would offer relief for risk-asset valuations; unexpectedly sticky core inflation could suppress easing expectations and test the rebound again.
The next phase depends both on Bitcoin retaining the gains supported by spot demand and on Ethereum and major altcoins turning a one-day rally into sustained recovery from weekly losses. Otherwise, the market will retain its existing pattern of Bitcoin strength alongside volatile, divergent performance elsewhere.
Click 'Read original' for full details.