AI industry's reported revenue is still growing, but capital markets are asking a different question: how much profit can that revenue ultimately retain, and can it cover the enormous computing investments already committed?
On October 8, media reported that OpenAI's annualized revenue at the end of September was about $50 billion, below the widely circulated $68 billion. Nvidia fell nearly 3% that day, Oracle more than 5%, and the Philadelphia Semiconductor Index 3.4%. CNBC identified the downward reset in OpenAI revenue expectations as an important catalyst for pressure on AI stocks, alongside rising oil and interest rates.
The roughly $18 billion gap arose mainly from whether partner sales were counted gross or net. Under gross accounting, the revenue belonging to partners carries an equal channel-sharing expense; switching to net presentation does not change the transaction's actual cash flow. Investors who had extrapolated OpenAI's retained earnings from gross revenue, however, overstated future profit and capital-expenditure coverage, requiring valuation models to adjust.
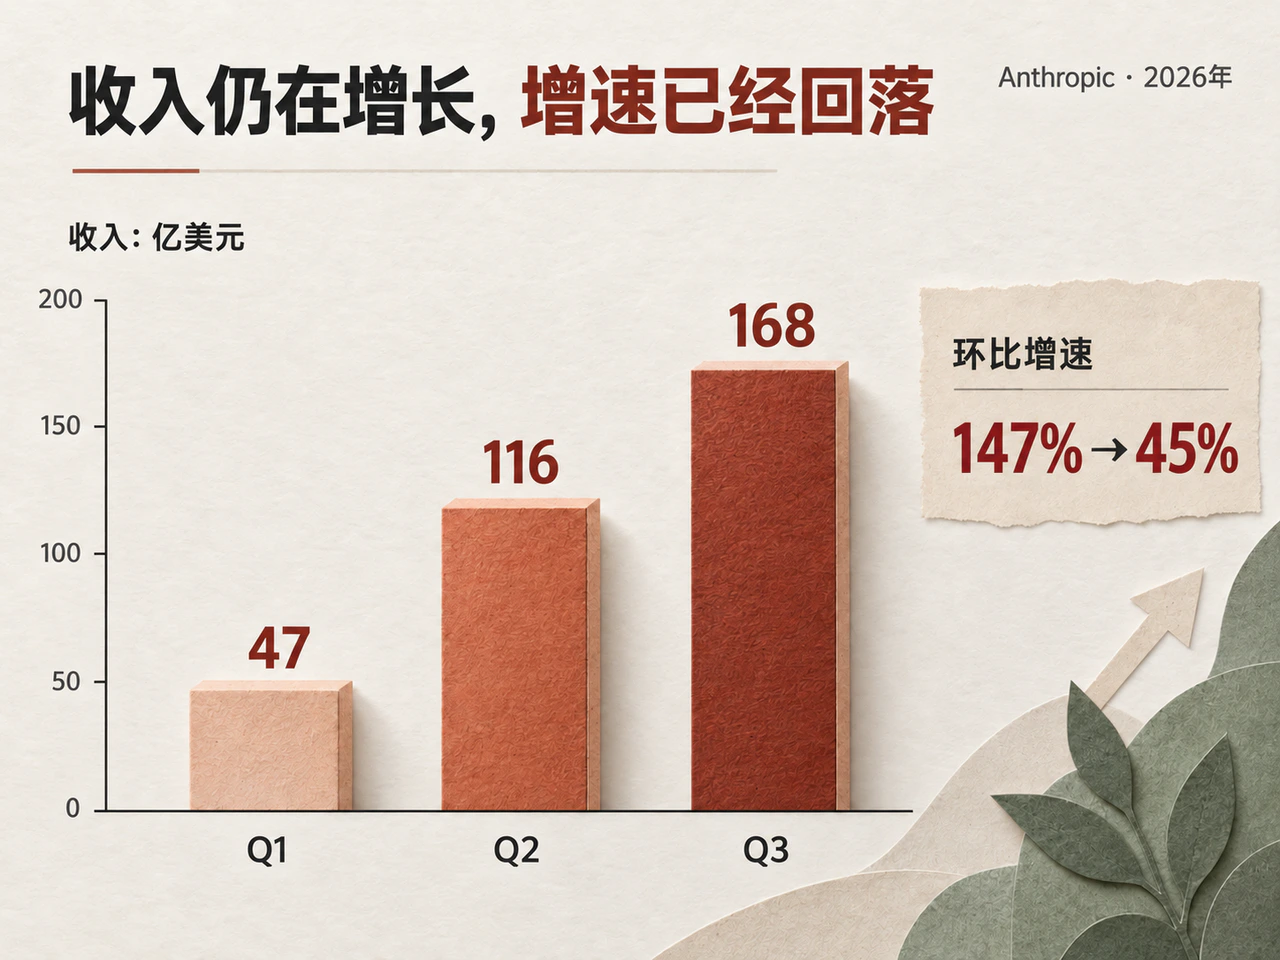
Anthropic's latest results further highlighted growth quality. Third-quarter revenue reached $16.8 billion; quarter-on-quarter growth of about 45% remained substantial but was markedly below the second quarter's roughly 147%. For companies already carrying huge long-term computing commitments, continued revenue growth is only the starting point. Investment returns depend on whether growth rates, profit retention and capital-recovery periods align.
2027 will be a crucial testing window. New computing capacity will start coming online, and assets commissioned in 2026 will bear a fuller year of expenses. Gaps between some companies' valuations, cost structures and project returns may emerge first. How much profit customer payments retain and how much cash mature projects recover will determine whether the adjustment stops at valuation resets or spreads to financing conditions and upstream computing orders.
OpenAI's net annualized revenue is about $50 billion; Anthropic's third-quarter growth slows to 45%
OpenAI's recent revenue figures span different dates and definitions, tracing relatively weak second-quarter growth, faster third-quarter sales and a recalibrated net-revenue base.
The Wall Street Journal reported actual OpenAI second-quarter 2026 revenue of $6.7 billion, above the first quarter's $5.7 billion, but roughly 18% sequential growth disappointed some investors. CNBC subsequently confirmed from investor materials that the company's total annualized revenue run rate grew 77% during the third quarter and its enterprise business 107%. A run rate extrapolates sales around a particular point into a full-year figure; growth in that measure during the quarter differs from quarter-on-quarter growth in actual recognized third-quarter revenue.
The approximately $50 billion announced in October referred to net annualized revenue at the end of September. The earlier $68 billion–$70 billion included gross partner sales to align with Anthropic's presentation. Bloomberg separately reported that OpenAI hoped to reach or exceed a $70 billion annualized run rate by the end of 2026, a forward target. Connecting these different measures into one curve can mistake a gross-to-net adjustment for business contraction.
Anthropic's quarterly sequence, by contrast, shows the slowdown more directly. Reuters verified with investor-meeting attendees revenues of $4.7 billion in the first quarter, $11.6 billion in the second and $16.8 billion in the third. The quarterly revenue increment fell from $6.9 billion to $5.2 billion, about one quarter lower, while sequential growth slowed from roughly 147% to 45%. A larger revenue base contributed, but incremental expansion also slowed.
Even so, $16.8 billion remains a substantial single-quarter revenue figure. Earlier claims that Anthropic had 'absolutely no revenue growth in August and September' arose from secondary interpretations of third-party tracking charts. The tracker's original public summary on September 29 estimated annualized Anthropic revenue of $76.8 billion, up 1.8% month on month; it was not an official company disclosure of two months' actual revenue.
Profit performance at the two leading model companies has also diverged. Anthropic said at its latest investor meeting that it achieved adjusted profitability in the third quarter. The Wall Street Journal's earlier account of OpenAI's second quarter showed further deterioration in operating margin. Anthropic has not publicly provided full profit adjustments or cash-flow details, so whether its improvement covers model training, research and multiyear computing payments remains to be seen. Assessing long-term competitiveness and pricing power requires placing model providers within industry-wide paid demand and pricing trends.
Ramp's blended token price falls over 40% in six months; higher AI usage need not translate equally into revenue
Enterprise paid adoption continues to rise. In July results for the quarter ending June, Microsoft disclosed more than 30 million paid Microsoft 365 Copilot seats, with net additions more than doubling from the preceding quarter. Financial automation platform Ramp's payment sample released October 14 likewise showed 55.9% of companies paying for AI products in September, with penetration continuing to increase. Yet the heaviest 1% of buyers in that sample contributed 80% of payments to OpenAI and Anthropic, revealing heavy concentration in a few large customers.
The same Ramp report recorded a divergence: enterprise token usage—the billable units for content processed and generated by models—continued rising in August and September, while related dollar spending was broadly stagnant. Ramp attributed this mainly to lower blended prices and improved efficiency. Greater use of inexpensive lightweight models, cache pricing and commercial discounts can lower realized prices per token. Better task efficiency can also reduce the tokens needed for the same work, lowering the bill per task even at unchanged token prices.
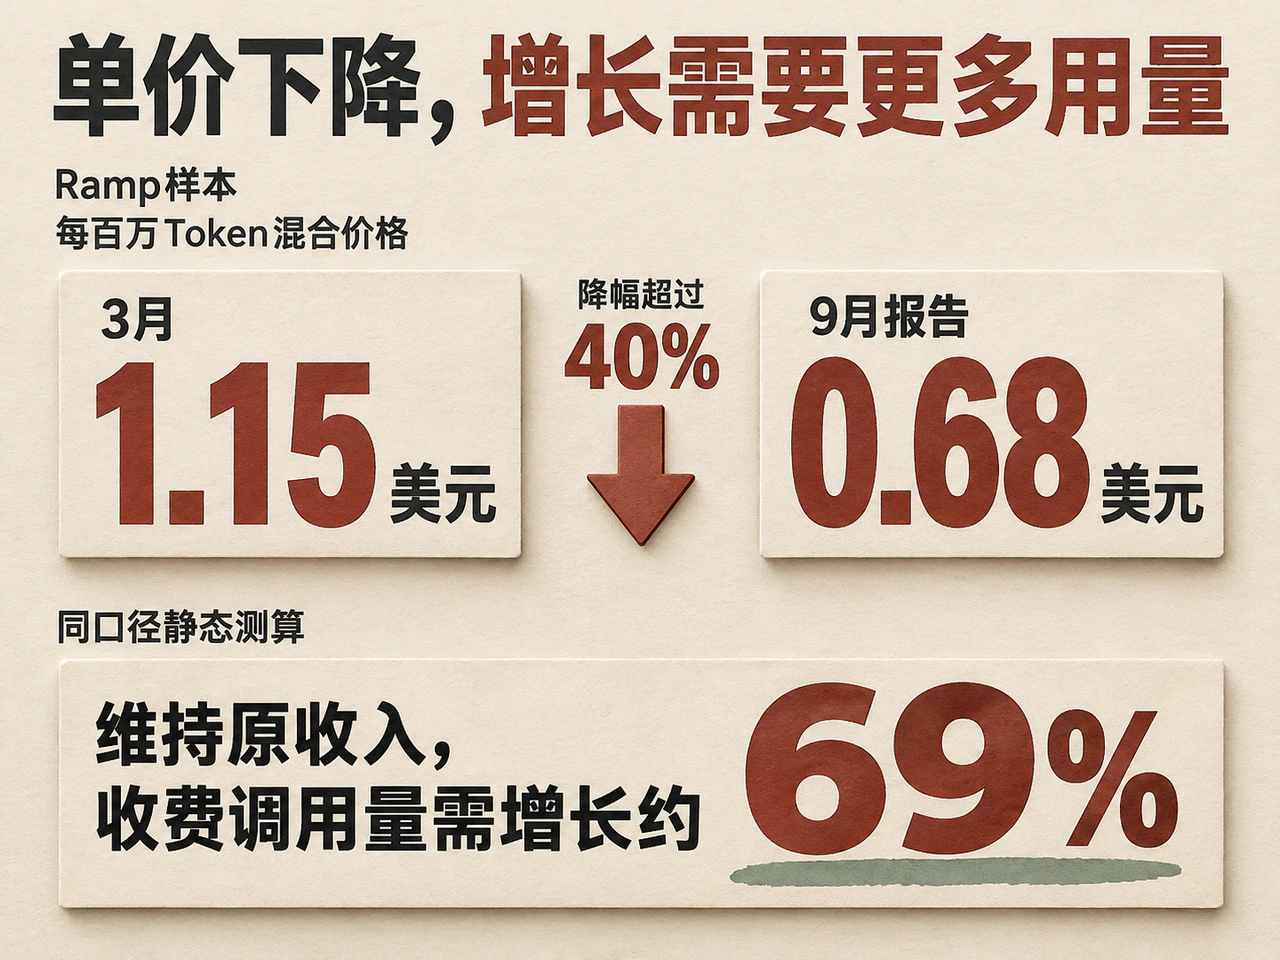
Ramp's September report showed the effective blended AI-model price falling from $1.15 per million tokens in March to $0.68 at publication, a decline of more than 40% in six months. A static calculation using these prices implies that, with comparable billing units and product mix, paid token volume must rise about 69% merely to maintain revenue. As customers obtain the same service more cheaply, providers need greater usage growth to offset price declines.
The margin impact depends on how quickly underlying costs fall. If inference efficiency, chip costs and computing utilization improve faster than prices decline, model providers can still expand gross margin. If competition forces prices down faster, margins are squeezed. Microsoft previously disclosed that surging Copilot use had pressured gross margin, while GitHub Copilot's shift to usage-based billing improved it. Aligning billing models with actual service costs is now a practical operating challenge.
At the end-demand level, enterprises must turn efficiency gains from AI procurement into financial returns. McKinsey's 2026 survey found that 80% of respondents believed AI improved personal productivity, but only 37% reported a positive contribution to enterprise earnings before interest and tax (EBIT). These are respondents' subjective attributions rather than audited financial results, yet the gap shows that saved employee hours must become saleable additional output, lower outsourcing and overtime bills, or reduced hiring through workflow changes, quality control and organizational adjustments before reaching the income statement. If faster generation instead increases manual review, rework and correction costs, continued willingness to pay and acceptable prices will be constrained.
This also means that more of AI's economic value may remain with users. Customers doing more work at lower cost represents continuing technological adoption, while model-provider revenue growth and pricing power may face downward pressure.
New computing capacity is planned for 2027; rigid long-term payments test revenue delivery
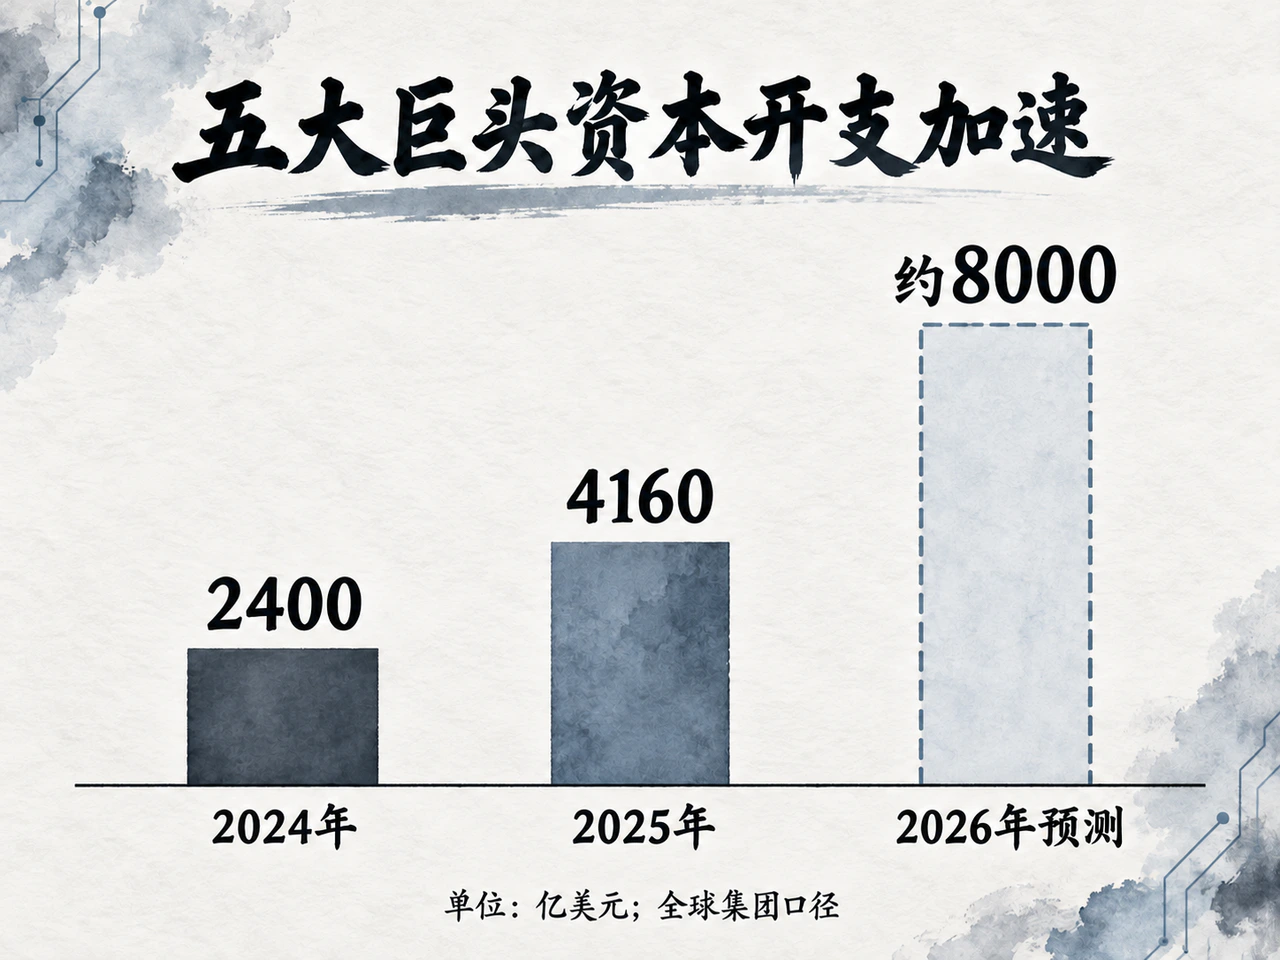
While demand-side billing faces pressure, enormous supply-side investment is raising the industry's cost base. Alphabet's latest estimate puts 2026 capital expenditure at $195 billion–$205 billion; Amazon management has also raised planned cash capital expenditure to approximately $220 billion. These budgets cover AI computing, conventional cloud computing and other businesses, including hardware and infrastructure with different depreciation lives.
Leading cloud providers still have strong revenue growth. In the quarter ending June 2026, Microsoft Azure revenue grew 43% year on year, Amazon AWS 36.7% and Google Cloud 82%. Google Cloud revenue included sales of complete TPU systems using Google's own AI chips, so recurring cloud services and hardware deliveries jointly lifted quarterly growth.
Cash-flow figures reveal the other side of peak construction. Alphabet's second-quarter free cash flow was negative $5.855 billion; Amazon's trailing-12-month free cash flow through the second quarter was negative $7.604 billion. Cash generated by existing-business expansion was being absorbed by larger new data centers and equipment purchases.
As construction projects become operating assets, financial cost pressure is already appearing. Alphabet had $122.8 billion of assets not yet in service at the end of June 2026, sharply above $78.6 billion at year-end 2025. Once usable, those assets begin depreciating through the income statement. Microsoft's property and equipment depreciation rose from $22 billion in fiscal 2025 to $34.3 billion in fiscal 2026. Accounting depreciation allocates historical investment to earnings without new current-period cash outlays. Equipment balances, lease repayments, facility rents and daily operating expenses, however, consume cash at their own contractual dates, so earnings and cash-flow pressure do not coincide exactly.
Two cohorts of computing assets will face concentrated operating tests in 2027. First, new TPU capacity deployed by Anthropic with Google and Broadcom is expected to start coming online in 2027, testing whether paid usage and revenue ramp alongside capacity. Second, assets commissioned in the second half of 2026 will bear a full year's depreciation and operating expenses in 2027, testing whether cash contribution keeps pace with costs.
New capacity will also test the quality of earlier demand. Anthropic disclosed peak-period reliability pressure in April and raised Claude Code and API limits after adding computing capacity in May. If paid use, revenue and cash contribution expand together as 2027 capacity arrives, that will support the view that supply bottlenecks constrained earlier growth. If ample capacity still requires discounting and promotions, or even brings idle resources and weaker collections, demand and investment-return assumptions will face a direct challenge.
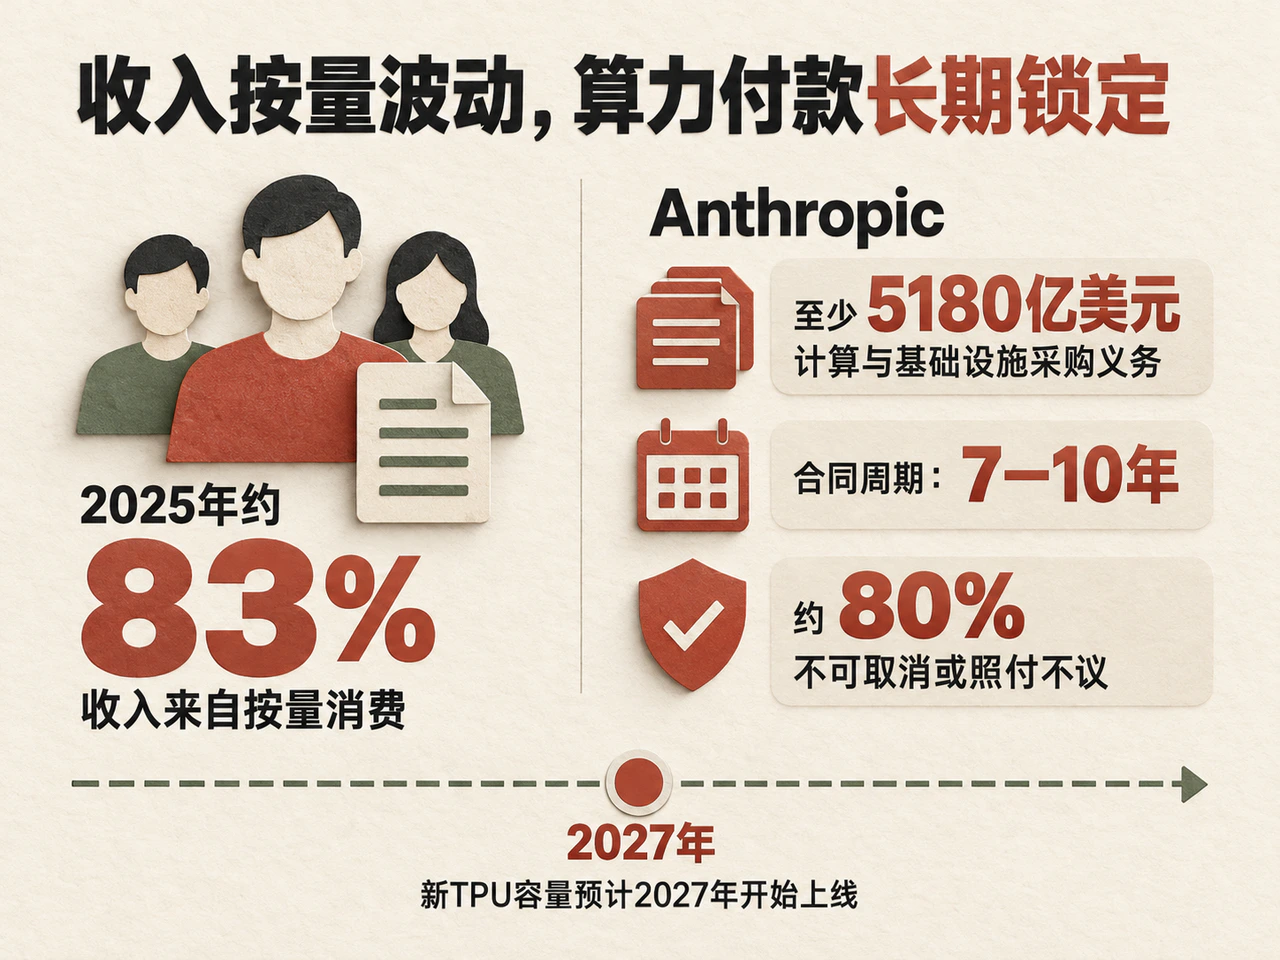
Independent model companies face a particular maturity mismatch between highly flexible revenue and rigid procurement. Anthropic's prospectus reviewed by Reuters showed at least $518 billion in computing and infrastructure purchase obligations across seven- to ten-year contracts, about 80% non-cancellable or take-or-pay: minimum contractual payments apply regardless of whether actual use reaches the agreed floor. Yet about 83% of its 2025 revenue came from consumption-based usage. Customers can change spending with business needs and prices, while upstream costs are locked in years ahead. Revenue growth falling below assumptions made when contracts were signed can rapidly narrow cash buffers.
Computing break-even calculation: $100 billion of equipment needs about $26.4 billion annual cash contribution
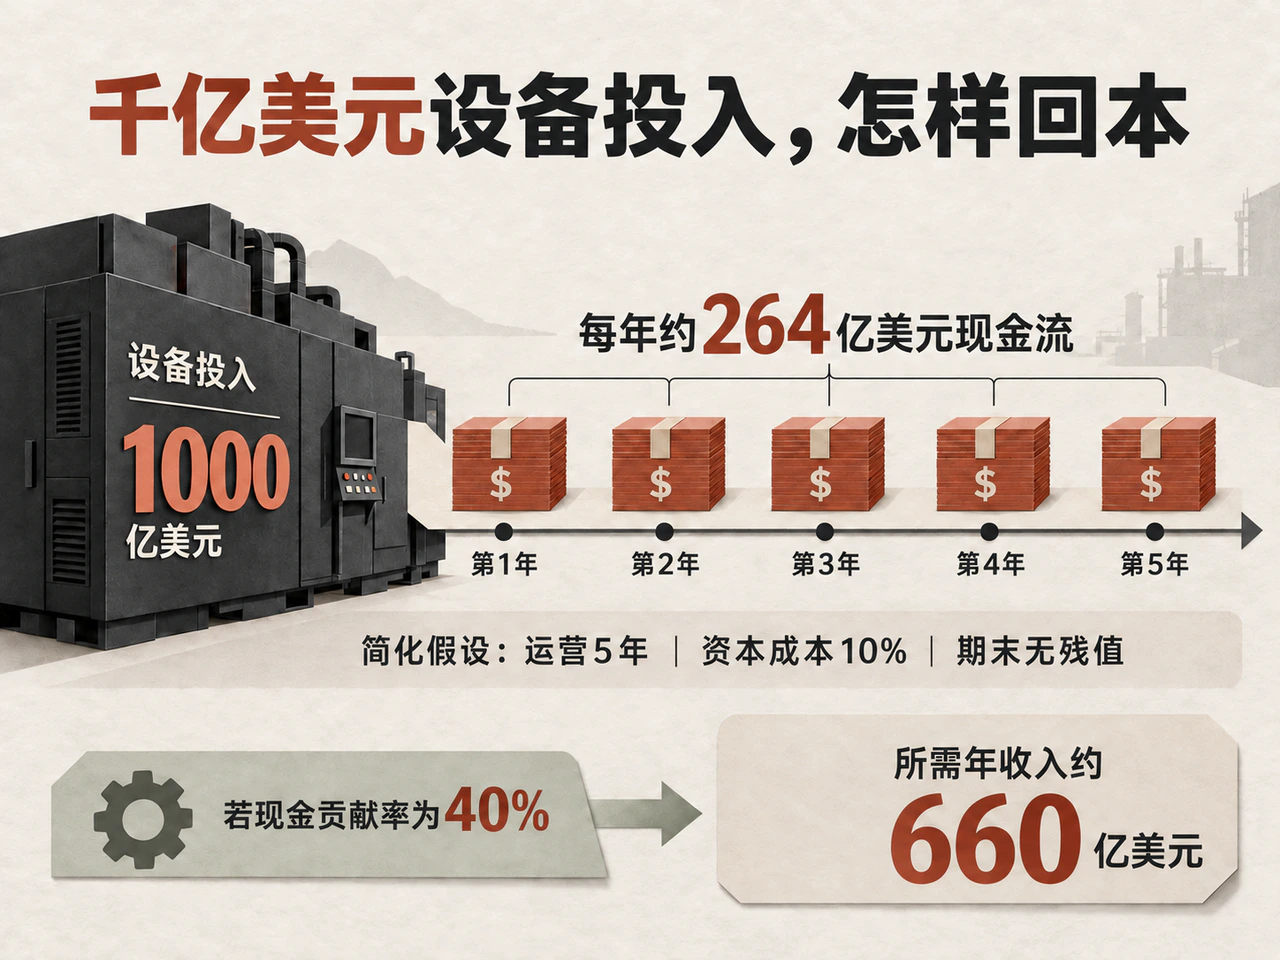
A simplified project model quantifies the capital-recovery threshold. Assume an initial $100 billion equipment investment, five years of stable operation, no terminal residual value, no taxes, working-capital changes or additional maintenance investment, and a 10% annual cost of capital. A discounted-cash-flow calculation requires approximately $26.4 billion of equal annual operating cash flow: discounted at 10% over five years, those flows just cover the $100 billion initial investment.
The corresponding revenue threshold follows. At a 40% operating cash contribution margin after electricity, facility operations and other cash costs, $26.4 billion of annual cash requires about $66 billion of annual revenue. If revenue is only $50 billion, a 40% contribution yields $20 billion cash, exactly matching straight-line depreciation of $100 billion over five years—accounting break-even—but below the $26.4 billion needed to cover the 10% capital cost.
Revenue growth, accounting break-even and excess economic returns are therefore separated by measurable gaps. In practice, long construction waits, ramp-up losses and early obsolescence from chip development raise the annual cash-recovery threshold. Longer equipment service lives, higher residual values or much better inference efficiency reduce that pressure.
Changing accounting depreciation lives can improve reported profit without increasing customer cash payments. In 2025, Meta extended the estimated lives of most servers and network equipment, reducing that year's depreciation by $2.92 billion. Amazon shortened the depreciation life of some equipment from six years to five that year, increasing depreciation by $1.4 billion. Beyond accounting estimates, the core variables are how long equipment remains commercially competitive amid technological change and whether computing rents and service prices hold up.
2027 is not a universal payback deadline for all computing assets. Amazon management says servers and network equipment have an average payback period slightly below three years and useful lives of at least five to six years, while data center facilities can last over thirty years. Recovery differs by asset category and commissioning cohort: 2027 will first test whether early mature projects recover capital on schedule, while many new projects are only entering their investment phase.
Who pays for AI's enormous investment: a $26.4 billion annual cash threshold in a simplified $100 billion equipment scenario, and paths to end-user monetization
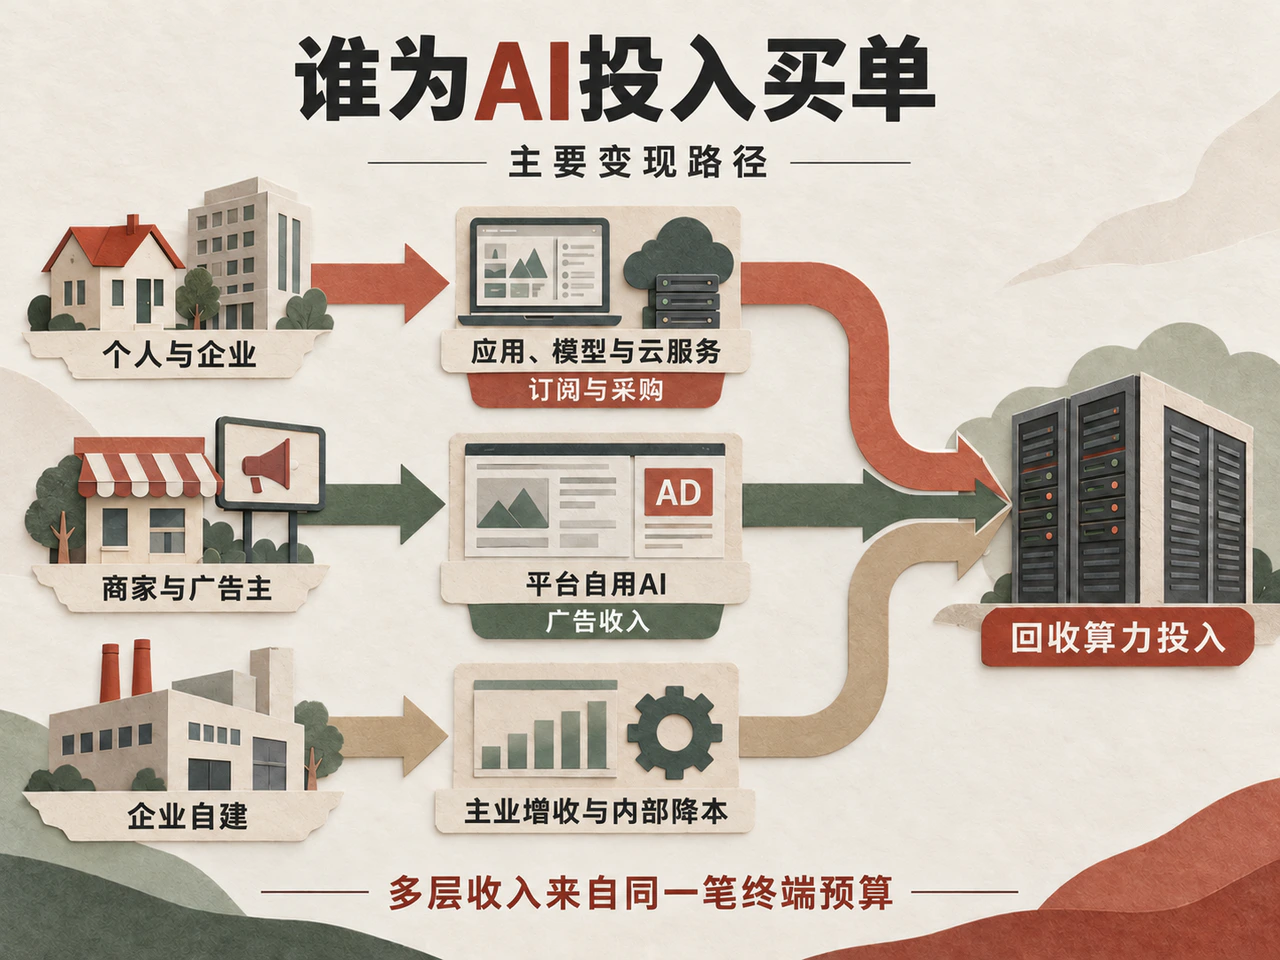
In the simplified scenario of $100 billion initial equipment investment, five operating years, 10% annual capital cost and no residual value, roughly $26.4 billion of equal annual cash flow is needed to recover capital. Its economic foundation lies both in continuing household, corporate and public-sector budgets and in actual improvement to existing business profits. Asset owners and capital providers fund construction first, then recover it through product charges, business procurement, advertising gains and internal cost savings. Final users, direct payers, initial funders and potential bearers of investment losses are often different parties.
End demand is monetized through personal subscriptions, enterprise procurement and improvements to existing businesses, beyond independent model-company revenue
OpenAI and Anthropic revenue is an important window on AI demand, but their direct customers include both final users and application developers buying underlying models to sell downstream products. The wider market also includes enterprise-built systems, open-model deployments, features embedded in conventional software, advertising recommendations and AI in phones, vehicles and industrial equipment. These consume computing resources and produce commercial returns too. Classified by payment path, end demand mainly covers five settings:
| Final use case | Direct payer and budget source | Supplier receipts and user benefits |
|---|---|---|
| Personal assistants, creation, education and entertainment | Individuals or households pay subscriptions, in-app purchases and usage fees; employers or schools cover some spending | Suppliers earn product revenue; users gain convenience, creative capability or entertainment value |
| Enterprise office and industry applications | Companies use software, IT, R&D and outsourcing budgets to buy seats, model services or industry systems | Suppliers earn software and service revenue; buyers recover spending through additional output and actual cost savings |
| Search, recommendations, advertising and e-commerce | Merchants and advertisers fund customer acquisition; platforms provide free or inexpensive services to end users | Platforms recover investment through advertising charges; merchants recover advertising spending through higher conversion and sales |
| Enterprise-built and device-embedded AI | Enterprises buy servers, cloud resources and implementation services; device customers buy or lease complete hardware products | Equipment, cloud and service providers earn sales revenue; user businesses recover investment through improvements to their operations |
| Public services and institutions | Fiscal or public-institution budgets buy software, models, computing and systems services | Suppliers earn government and public-procurement revenue; public institutions assess spending through service capability, efficiency and public benefit |
Direct consumer payments already have considerable scale. Sensor Tower estimates global generative-AI mobile-app in-app revenue in major app stores exceeded $5 billion in 2025, excluding direct web subscriptions and enterprise contracts. Some personal-account spending is actually funded by institutions and education: Menlo's 2026 U.S. survey found that about two in ten paying users had at least one AI tool paid for by an employer or school. AI embedded in end-user hardware is generally sold with the whole device and associated services, with commercial contributions reflected mainly in shipments, product prices, retention and usage costs.
Enterprise application spending extends well beyond general chat tools. Menlo's 2025 enterprise generative-AI application market model, based on U.S. decision-maker surveys and supplier information, estimated $8.4 billion for horizontal office tools and assistants, $7.3 billion for departmental tools and $3.5 billion for vertical applications, respectively about 44%, 38% and 18% of that model. Coding applications within departmental tools were about $4 billion; healthcare and legal vertical applications were approximately $1.5 billion and $650 million. Beyond these standalone applications, AI features in conventional software, advertising recommendations and internally built enterprise systems appear in other IT budgets and accounts.
For major internet platforms and technology companies, internally used AI often pays off directly within existing business models and cost structures, without a separately billed AI service. On revenue, Meta disclosed that advertising-model and other improvements lifted Facebook ad conversions by 15.7% in the second quarter of 2026. Advertisers still pay for advertising even when end users do not buy model subscriptions. Better matching can attract fresh ad budgets, shift budgets from other channels or help merchants obtain more orders for the same spending. The platform's retained incremental profit depends on the balance among revenue gains, computing costs and competition.
On costs, internal AI deployment can directly reduce operating spending. In a 2024 code-migration case, Amazon estimated AI-enabled performance improvements could save about $260 million annually. Users' AI returns can enter the cost side of the income statement, but cash for capital recovery arises only when saved hours become actual avoided cash spending, additional orders or other realizable benefits.
AI capital recovery therefore follows several paths. With outsourced model services, companies or households pay applications, applications buy model services, model firms rent cloud computing, and cloud firms buy equipment and pay operating costs. Platforms and enterprises using self-built systems build computing or rent cloud resources directly, recovering investment from ad gains, core-business profit improvements and internal savings. Device makers embed AI in hardware and services and charge final users. Every path must ultimately cover equipment, software, energy and operating costs, but not all flows pass through independent model providers' revenue accounts.
The same end-user budget creates several layers of corporate revenue as it moves through the chain. Gartner forecast in September 2026 that global AI spending would reach $2.67 trillion in 2026, including $1.48 trillion of infrastructure such as servers, chips, networks, IaaS and devices. This describes the sum of expanding upstream and downstream spending. Measuring true final demand requires looking through and eliminating intermediate transactions to trace actual final-user budgets.
About two thirds of Microsoft's quarterly capex goes to short-lived equipment; ongoing operations and R&D determine retained cash
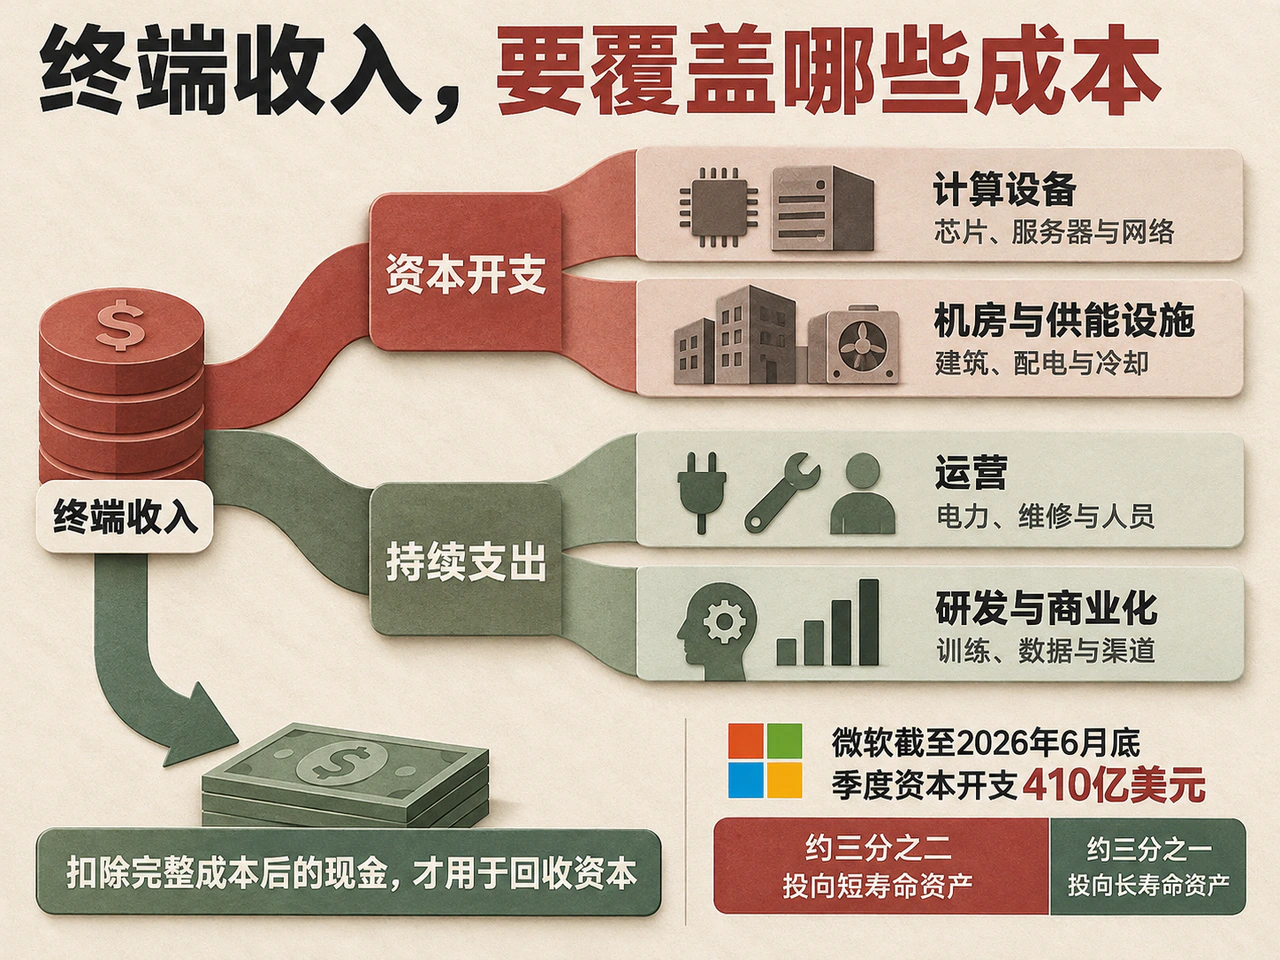
Once end revenue enters the chain, cash available to recover capital depends on asset-life composition and continuing operating expenses. Capital expenditure first becomes physical assets. The International Energy Agency (IEA) divides data center investment into IT equipment, non-IT facilities and energy systems. After projects launch, electricity, staff, maintenance, research and commercialization continue consuming operating cash.
| Cost layer | Main spending items | Capital recovery and responsibility |
|---|---|---|
| Computing equipment | Accelerators and servers, CPUs, memory, storage, interconnects and networks | Purchased before use; directly exposed to technological change, computing utilization and replacement investment |
| Facilities and power infrastructure | Land and buildings, distribution systems, transformers, cooling, backup power, plus new generation, storage and grids | Generally longer lives and construction periods than computing equipment; facility owners or utilities can invest and recover costs through rent, electricity tariffs and long-term contracts |
| Ongoing operations | Electricity, bandwidth, repairs, operating staff and customer support | Paid continuously as services are delivered; deducted from revenue before remaining cash can recover earlier capital |
| R&D and commercialization | Researchers, experimental training, data, retraining, software development, distribution and marketing | Maintain competitiveness and customer acquisition, directly affecting the earnings ultimately retained by the full business |
Leading cloud companies' disclosures show parallel investment in short-lived equipment and long-lived infrastructure. For the quarter ending June 2026, Microsoft reported $41 billion of capex including finance leases, about two thirds in short-lived assets such as CPUs and GPUs and the remainder in long-lived assets. Of Alphabet's same-quarter technical-infrastructure investment, about 60% went to servers and 40% to facilities and networking. These ratios refer respectively to Microsoft's quarterly capex and Alphabet's quarterly technical infrastructure investment; the infrastructure serves both AI and other activities.
Training and inference both use these hardware and software assets. Servers completing one training job can undertake other work afterward, while inference continuously uses equipment, power, memory and networks. When a model provider rents cloud computing, its rent already embodies upstream depreciation and operating costs. The cost of the same computing resources can therefore be assessed through actual cloud rent or through consumption of owned capital and operating expenses; simply adding both ends would double count.
Returning to the $100 billion equipment scenario, its assumed 40% cash contribution margin already deducts electricity and routine operations. Applying that framework to real companies also requires checking whether research staff, data procurement, experimental retraining, channel support, necessary equipment replacement and any project-funded facilities and power infrastructure are included. Financial-statement gross profit, cash contribution from a single equipment project and free cash flow ultimately available to shareholders have different cost boundaries.
Amazon says AWS investment precedes billing by 6–24 months; 2027–2028 incremental cash will test recovery
Computing infrastructure construction and delivery require early funding from technology companies' existing operating cash, equity, debt and leases. In his 2025 shareholder letter, Amazon CEO Jassy said AWS infrastructure investment generally precedes customer billing by 6–24 months, and expected a substantial portion of 2026 AWS capex to monetize in 2027–2028. The lag explains pressure on free cash flow during concentrated construction and why recovery must span subsequent operating years.
Financing can bridge the gap between capital spending and customer receipts, but cannot replace the long-run ability of end businesses to create cash. The current pattern of suppliers investing in customers that then buy computing can generate real equipment deliveries and service revenue today. Sustained repayment nevertheless requires external-user cash or incremental returns within companies' own operations.
A rigorous investment appraisal should count new service charges, existing business defensively preserved and realized internal savings on the benefit side, and deduct incremental operations, research, implementation and necessary equipment replacement on the cost side. Funding AI with existing advertising and software cash demonstrates internal financing capacity; whether the new project creates economic value depends on incremental cash flow versus a no-investment scenario. Counting all existing core profit as AI return, or focusing only on model API revenue and missing internal efficiency benefits, both misstate the economics.
Ultimately, AI's economic value is divided among end users, application businesses, suppliers and capital owners. Competition can turn efficiency gains into lower prices and better services, while scarce technology or strong distribution may let some firms retain more profit. No economic rule guarantees that all upfront investment can be passed to consumers. If project cash falls short, shareholders' residual value is impaired first; losses for creditors, lessors or guarantors depend on contracts and recourse. For public investment, the relevant fiscal budget bears the opportunity cost of disappointing spending.
Changes in OpenAI and Anthropic revenue expectations will test the important independent-model monetization channel. Returns across the entire AI capital cycle will also depend on enterprise application fees, better platform advertising, internal cost savings, and purchases of AI hardware and industry systems. The key 2027 test is whether these final budgets and operating improvements produce sufficient incremental cash, after full operating and replacement costs, to recover capital on schedule for different computing-asset cohorts.
Valuations adjust first; financing and computing-order pressures diverge through the chain
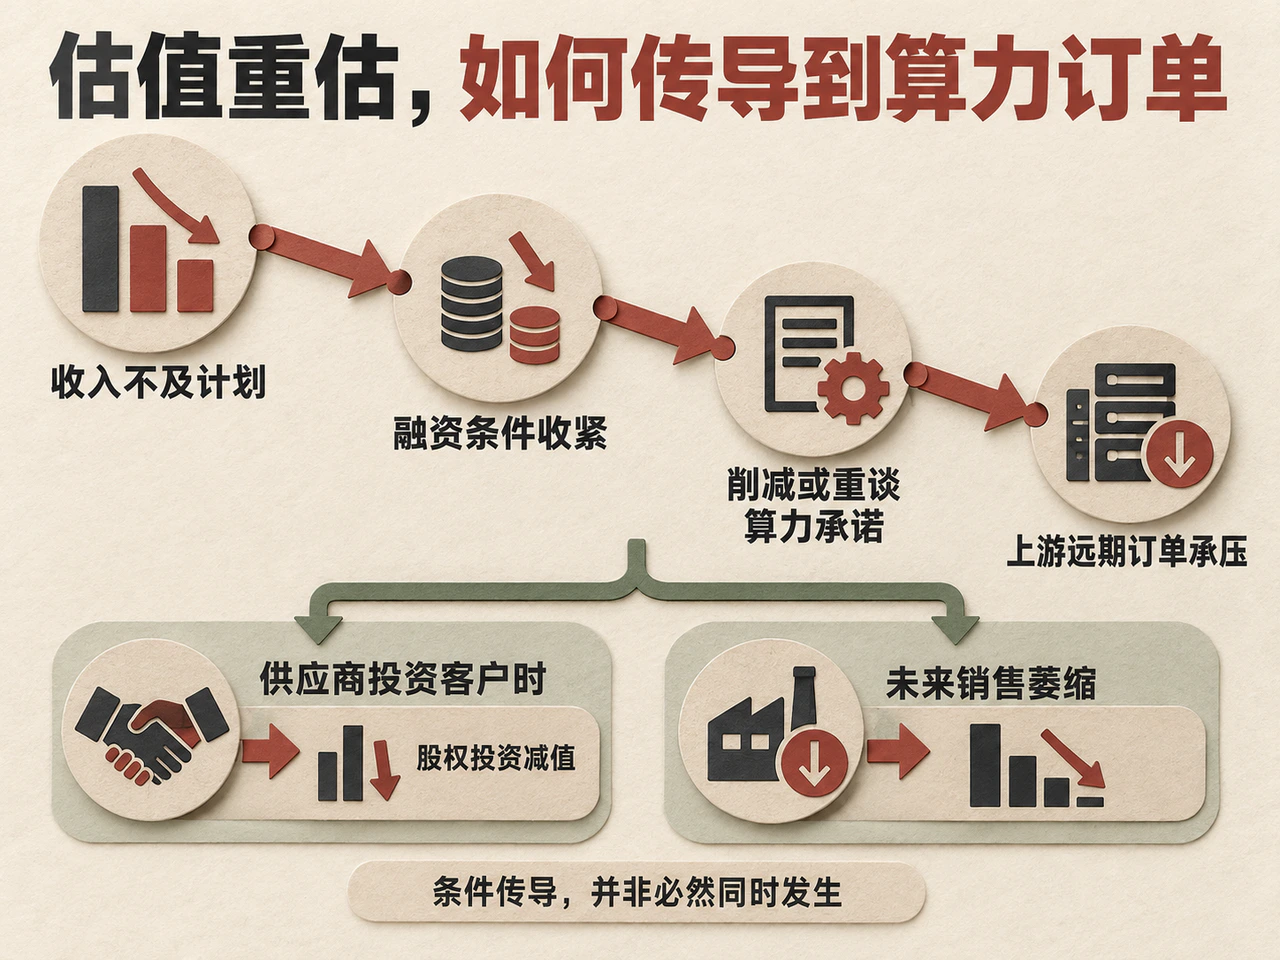
An AI equity correction need not wait for industry revenue to decline year on year. High valuations already embody optimistic assumptions of rapid growth, high margins and continuing expansion. Even with strong industry growth, a reporting adjustment that reduces the retained-profit base, or growth below expectations, is enough to weaken valuation foundations.
Deeper industrial pressure travels through financing, contracts and upstream orders. If model-company revenue falls short, private-market valuations may decline and equity fundraising become harder. Lenders may demand higher interest, stronger collateral or more reliable downstream payment commitments. Tighter funding can prompt cuts in new computing commitments and renegotiation of delivery and payment schedules, transmitting pressure to future hardware and cloud-infrastructure orders. This can occur even while chipmakers earn very high margins on current deliveries.
Cross-shareholdings and circular procurement can amplify contagion in a downturn. BIS research published in October noted that suppliers investing in customers while depending on those customers to buy their products face both equity impairments and weaker future sales if customers struggle. Such investments may have real commercial synergies, but sustainable computing demand ultimately depends on enterprises' and consumers' ability to pay actual cash. Model API procurement, cloud rental and chip sales are successive settlements of the same end demand, and cannot simply be added as independent final revenue streams.
Risks are distributed unevenly across the chain:
Leading chipmakers have already realized rich current returns. Nvidia's latest quarter through July 26 had a GAAP gross margin of 75% and operating profit of $63.7 billion. Its shares remain sensitive to lower future-order growth and profit expectations, but its financial buffer differs fundamentally from currently loss-making companies.
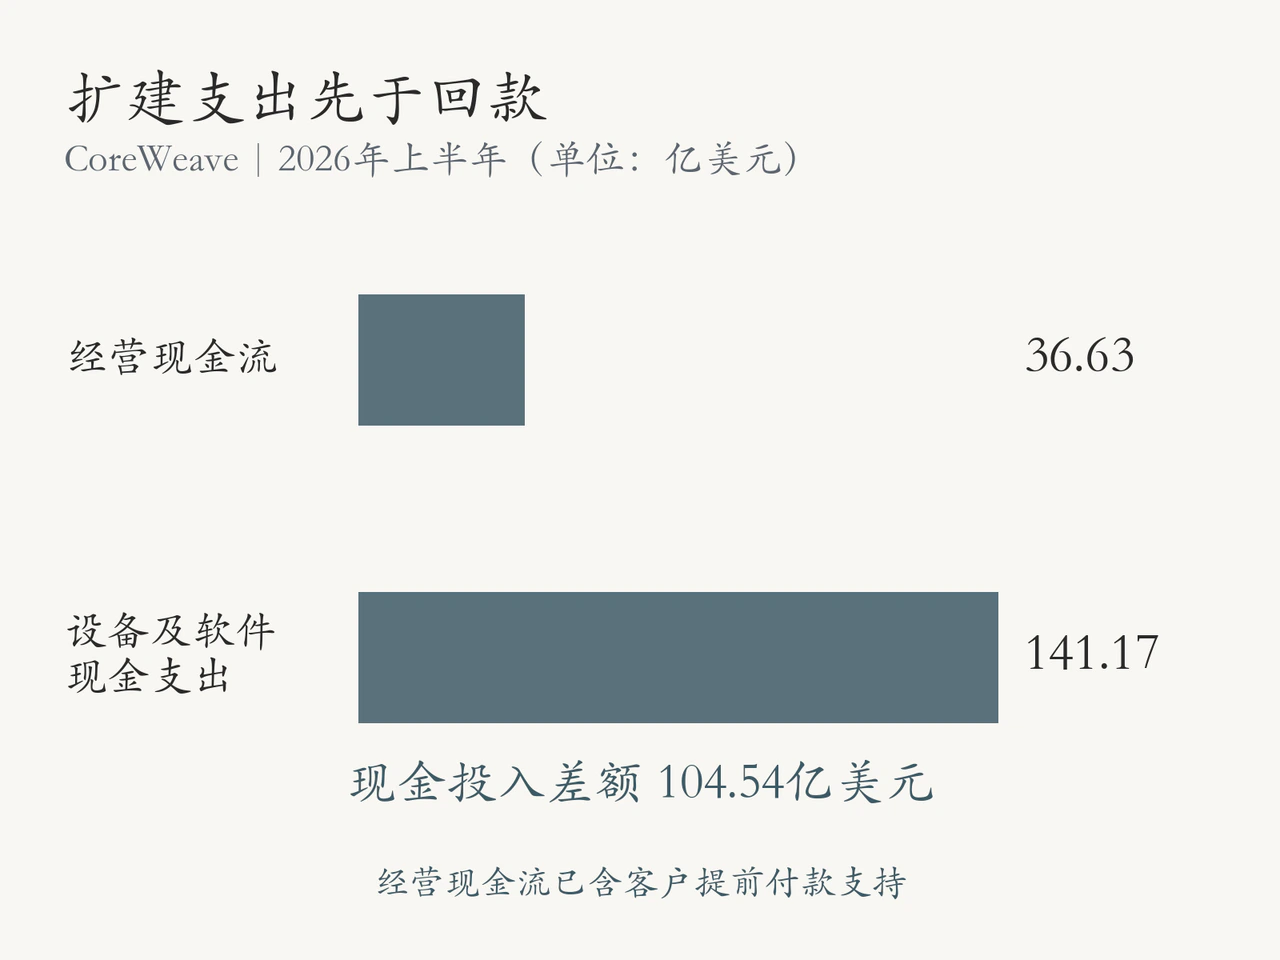
Highly leveraged computing lessors reveal the vulnerability of heavy assets and financing dependence. CoreWeave's second-quarter adjusted EBITDA margin was 59%, but net interest expense alone absorbed about 25% of revenue and quarterly net loss reached $626 million. Strong operating indicators failed to become net profit after large depreciation and interest costs, while continued expansion consumed cash. Order conversion, old-chip residual values and refinancing conditions directly affect these firms' survival room.
Large cloud providers can tolerate longer recovery periods through diverse cash flows from office software, digital ads, conventional cloud and e-commerce, and can use AI internally to improve existing businesses. Microsoft disclosed that nearly 90% of its broad cloud revenue in fiscal 2026 came from customers beyond frontier-model companies, so changes in one model firm's procurement affect only part of demand. Downstream application-software firms may gain margin from cheaper models, or lose pricing power as native foundation-model capabilities replace existing functions. Future divergence will revolve around capital intensity, external-funding dependence and real monetization.
Lessons from the 2001 telecom cycle: Growing end demand need not protect early capital returns
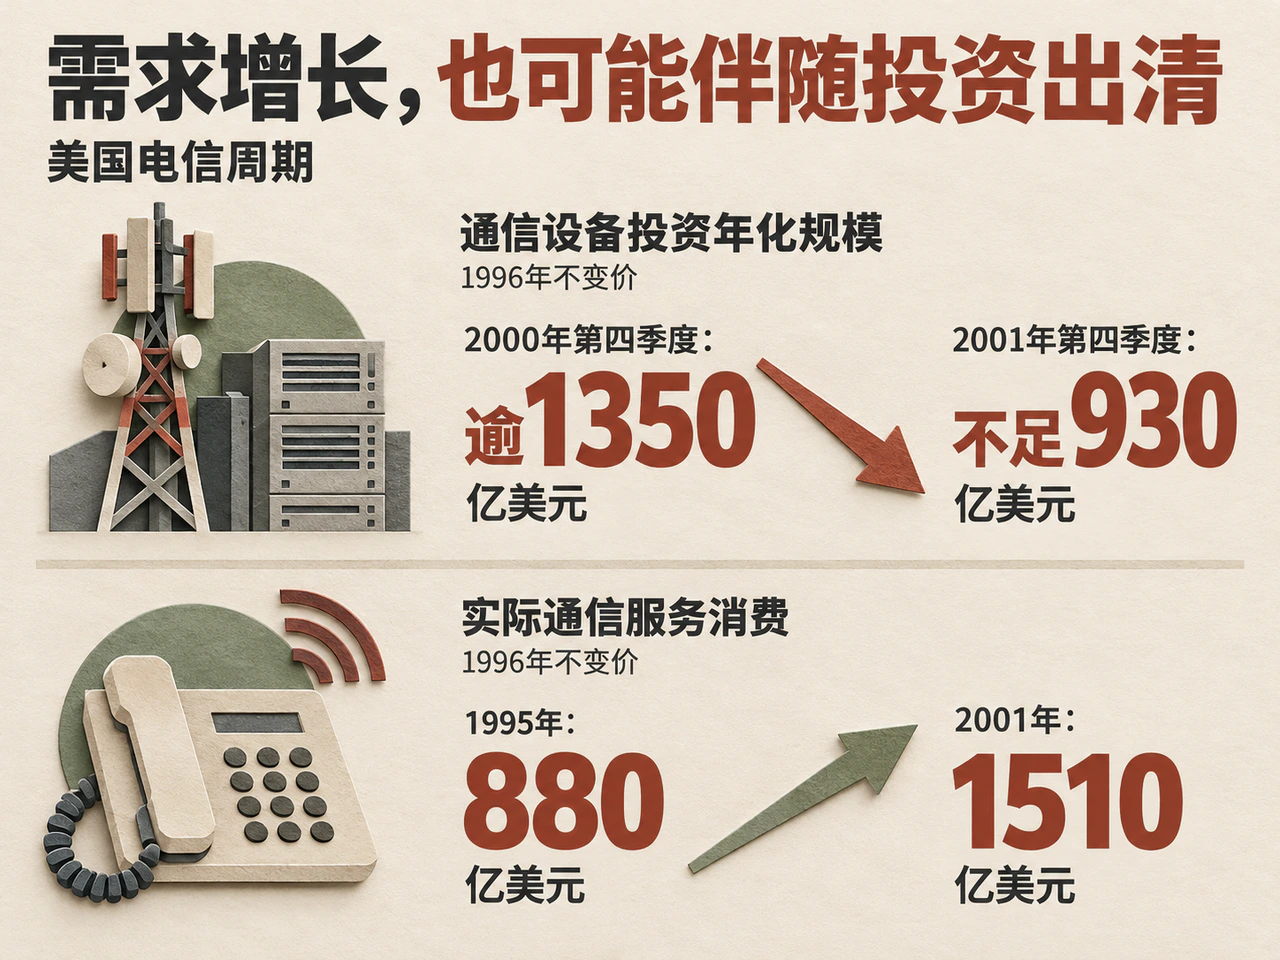
The U.S. telecom investment cycle around 2000 provides a historical parallel. Richmond Fed research showed annualized communications-equipment investment, in constant 1996 dollars, dropping from over $135 billion in the fourth quarter of 2000 to below $93 billion in the fourth quarter of 2001. Yet real communications-service consumption reached $151 billion in 2001, well above $88 billion in 1995. End demand kept expanding over the long term while upstream equipment investment underwent a sharp shakeout.
The mechanism is that infrastructure built far ahead of currently profitable demand, combined with competition passing technological gains into lower prices, can benefit users while leaving early heavy-asset investors unable to recover expected returns. Today's large cloud companies have much stronger balance sheets and earnings bases than many telecom operators did, and AI chips, data centers and long-haul fiber have different economic lives. History will not simply repeat, but the financial relationships among supply expansion, declining prices and capital returns still apply.
Five indicators for 2027: Paid demand, cash returns and financing conditions
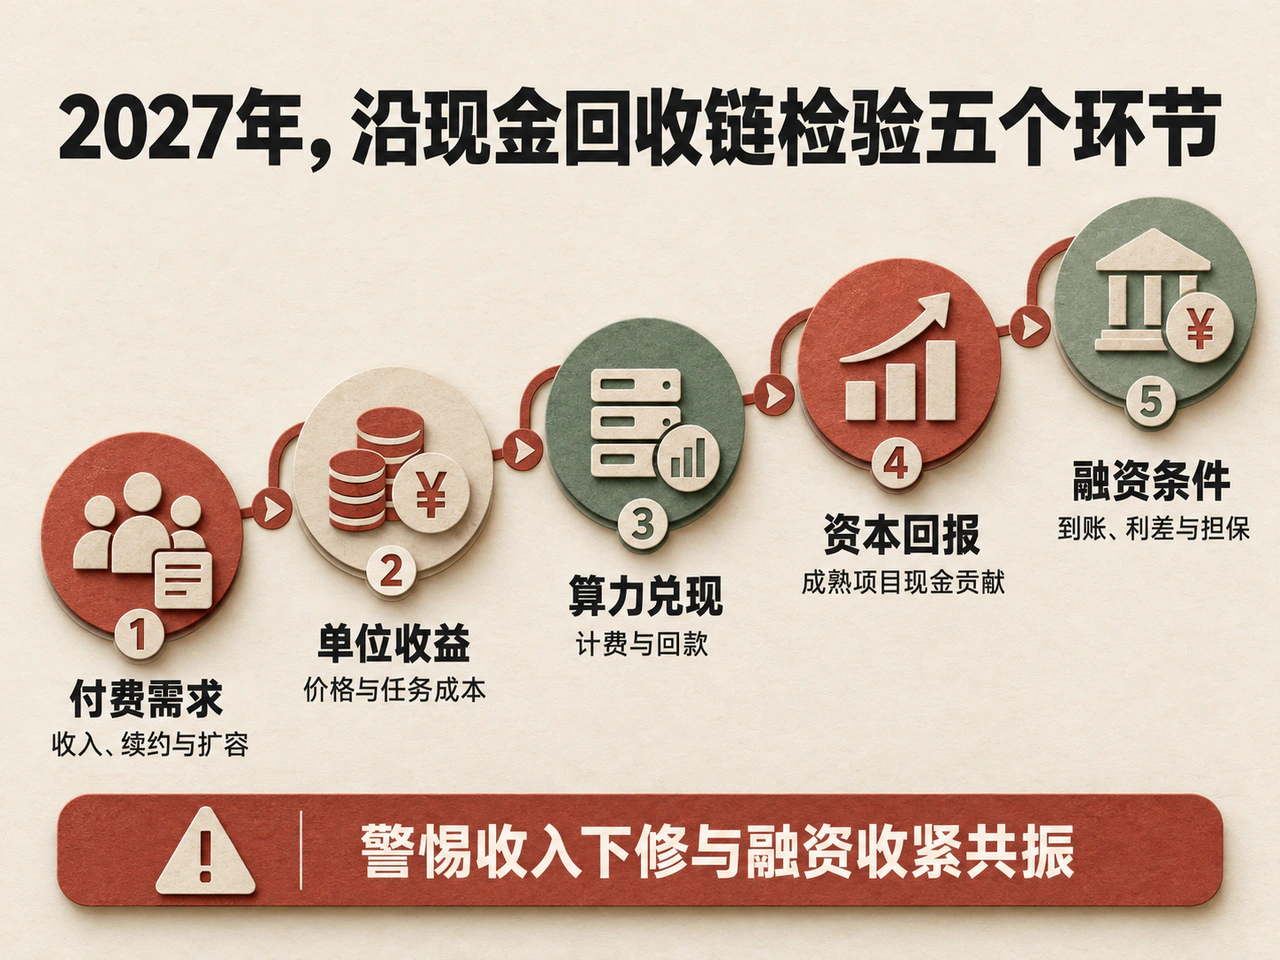
In 2027, testing AI returns will focus on operating data for paying customer cohorts and commissioned asset cohorts. Enterprise applications face renewals and seat expansion; model providers must retain sufficient operating cash as prices fall; computing infrastructure must convert orders into actual billing and collections. Cross-checking the following five dimensions is more informative than tracking one revenue growth rate in isolation:
| Test | Changes to track | More consequential negative signals |
|---|---|---|
| Paid demand | Actual quarterly revenue on a consistent basis, renewals, net spending per customer and expansion | Revenue below plan for several quarters; renewals and new use fail to offset price cuts and customer contraction |
| Unit economics | Realized prices, cost per effective task and contribution after inference and channel expenses | Usage keeps growing but contribution profit and cash consumption fail to improve |
| Computing delivery | Revenue from commissioned capacity, actual rents, order conversion and cash collections | Discounting and idle capacity appear together; key customers delay, renegotiate or reduce procurement |
| Capital returns | Mature-project cash contribution, replacement needs, depreciation and capital costs | Projects past ramp-up still fail to meet recovery requirements, while new investment remains dependent on external funds |
| Financing conditions | Actual receipt of new funding, debt spreads, guarantees and collateral requirements | Equity and debt financing weaken together; suppliers must keep investing or increase guarantees to sustain customer purchases |
The most concerning situation is several negative signals reinforcing each other: continuing revenue downgrades, persistent failure of unit economics to improve, major customers cutting or postponing commitments, and tighter external equity and debt financing. If slower growth, credit contraction and capex cuts form a negative feedback loop, the correction will spread from valuations to earnings and upstream hardware orders.
Conversely, returns can emerge in stages if enterprise renewals and actual spending expand steadily, inference costs fall faster than prices, and cash returns from mature facilities beyond ramp-up improve. Strong current cloud growth, broader enterprise paid adoption and rich upstream profits provide real support for that path.
Overall, the revenue reset has already triggered AI valuation adjustments. Slower growth at leaders will further test earnings quality and financing plans, while 2027 will be a dividing point for validating or disproving aggressive investment assumptions. In the baseline case, valuation corrections come first, followed by deeper divergence in fundamentals and capital returns. The adjustment's depth depends on whether operating disappointments become contractual defaults and a financing squeeze. Even with long-run technological progress and adoption intact, markets will reassess heavy-asset investments bought too expensively or carrying excessive costs.
This article is for research discussion only and does not constitute investment advice.