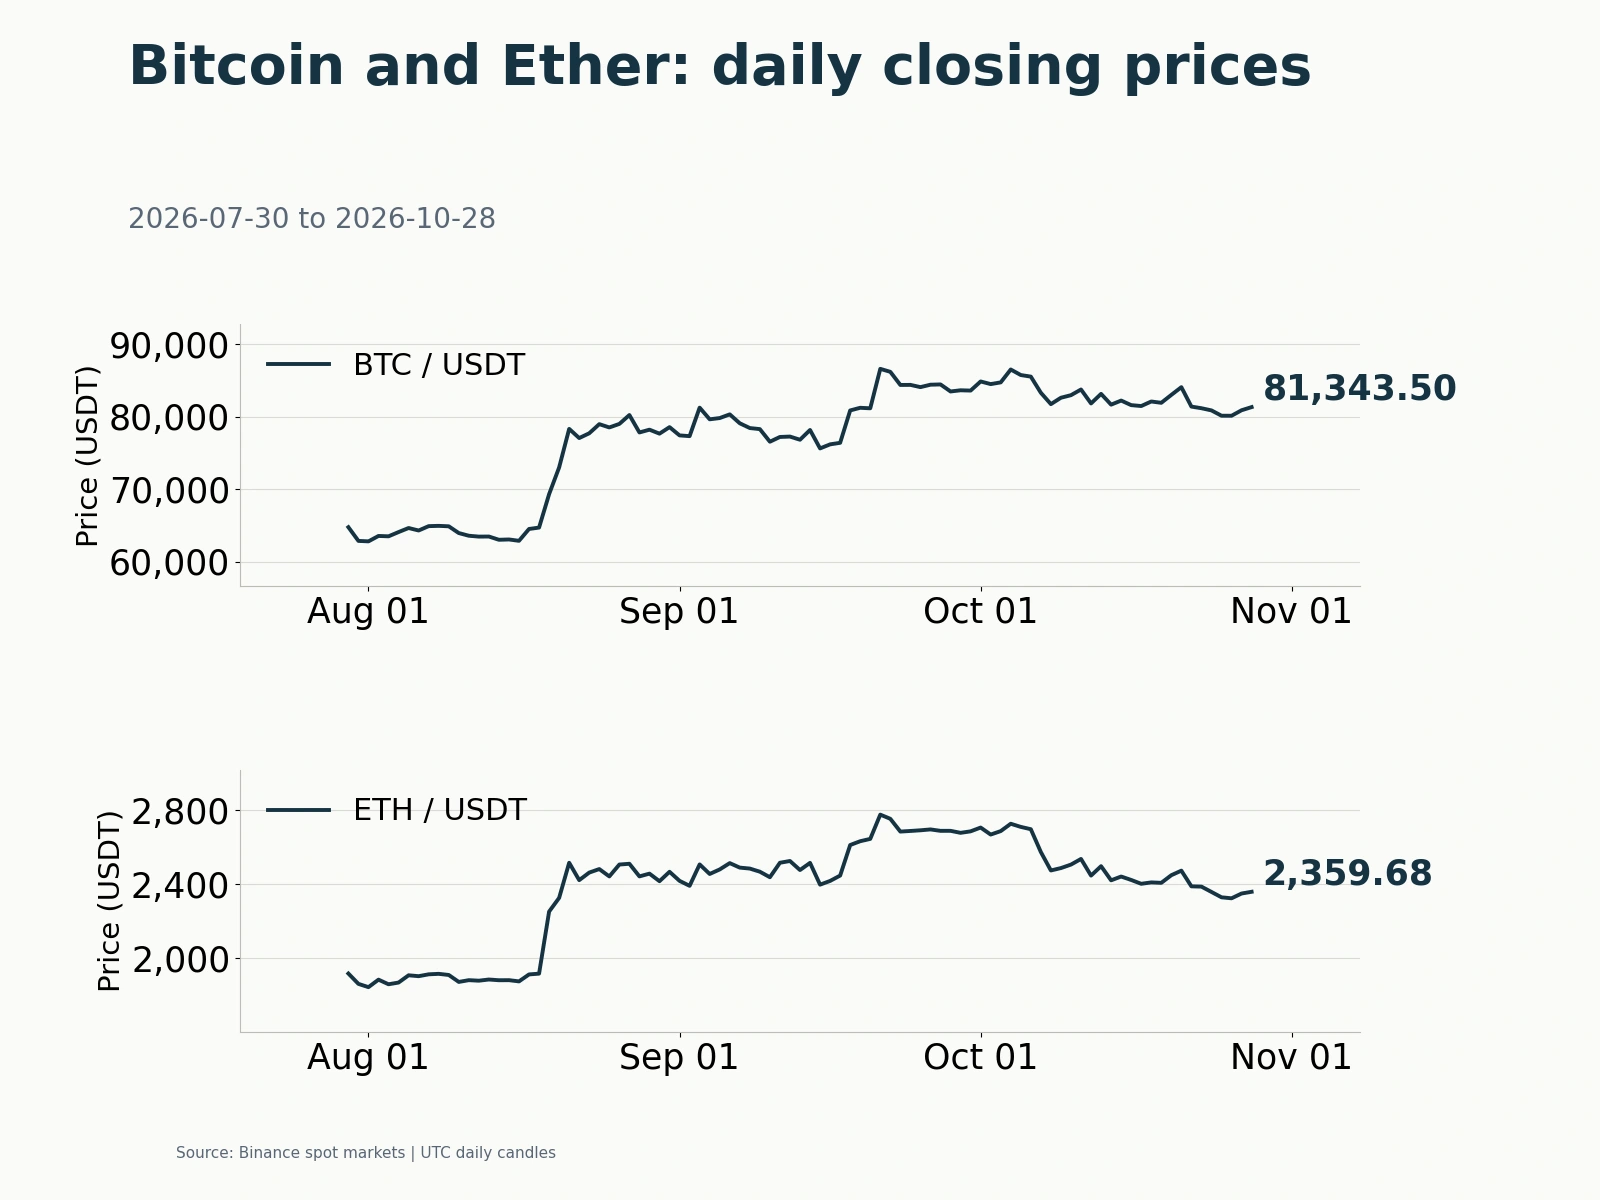
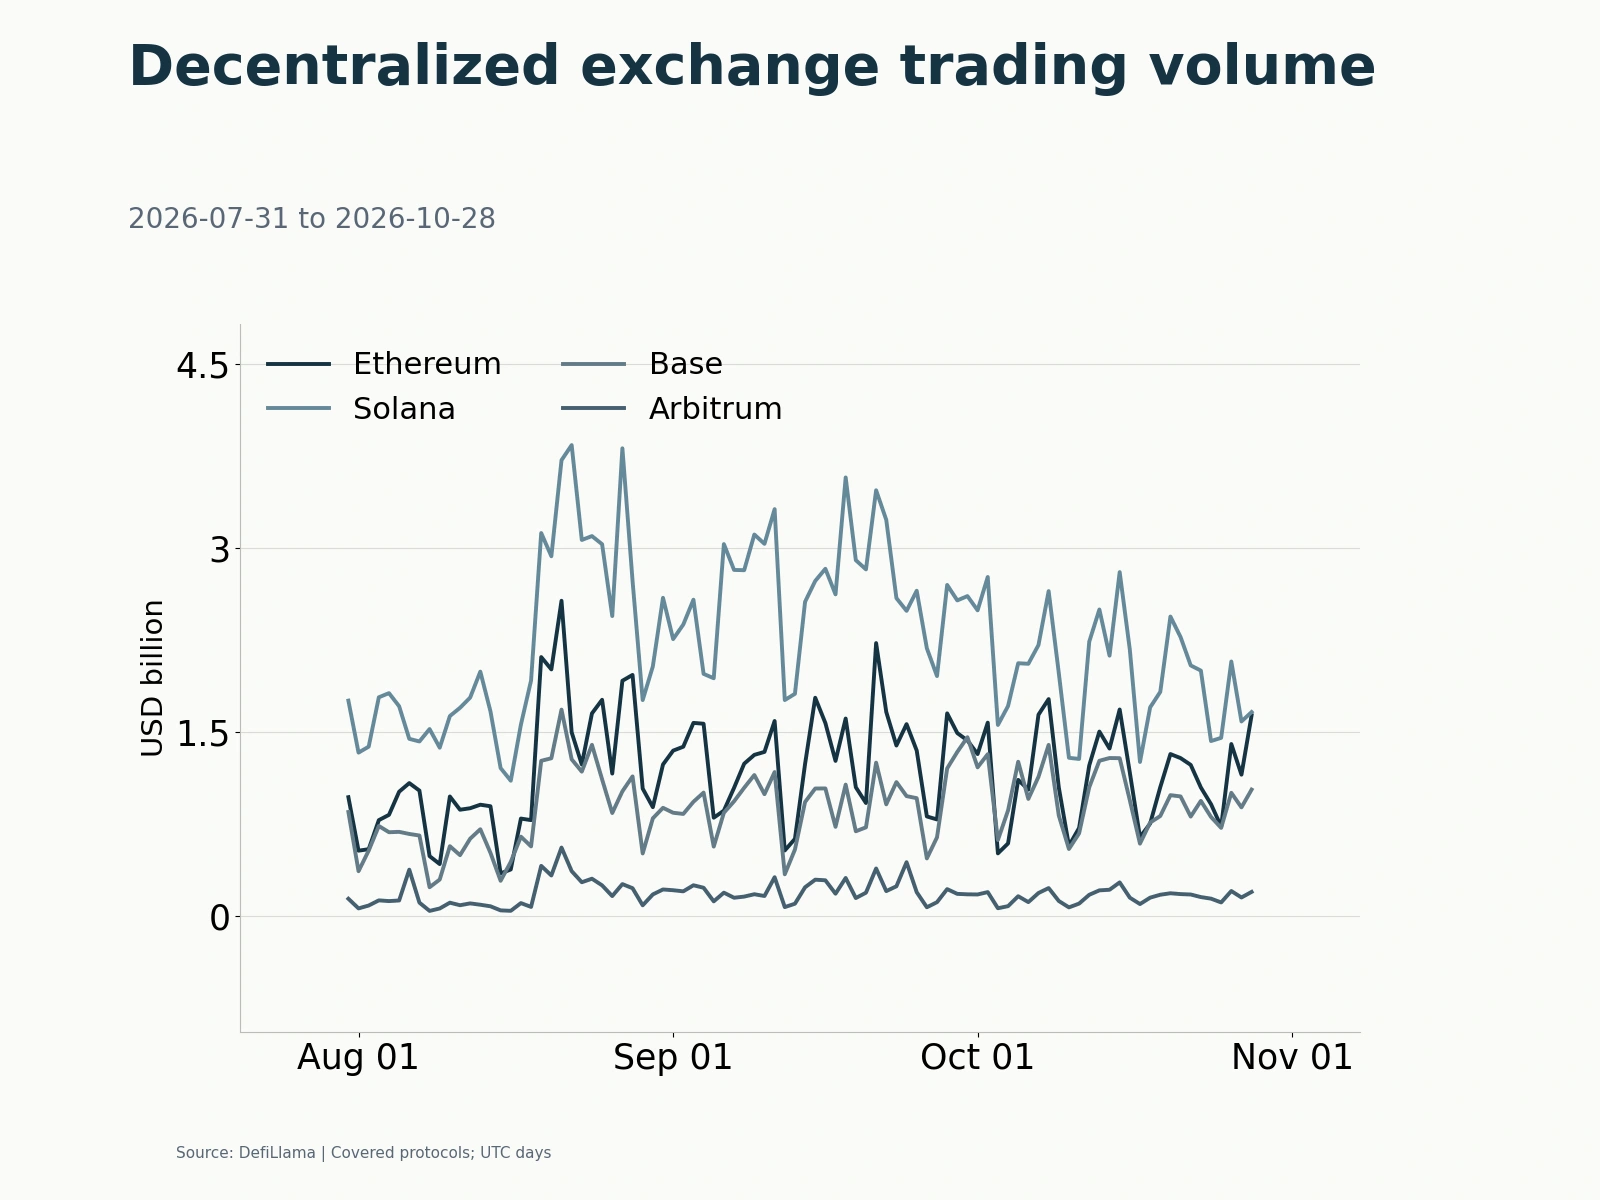
On October 14, crypto spot-allocation channels saw only modest replenishment, while leveraged derivatives positions expanded again amid price pressure and a macroeconomic data shock. Liquidations amplified volatility immediately after the U.S. inflation release. Yet by the close on the morning of October 15 Beijing time, open interest in Binance Bitcoin and Ether USDT perpetuals, measured in coins, was higher than the previous day. Funding rates meanwhile hovered near zero and turned negative late in the session. Position growth therefore did not reflect longs paying a large premium to chase gains; instead, disagreement between longs and shorts widened, with new positions potentially including hedges or bearish trades, increasing the market's sensitivity to further shocks.
Spot ETFs receive $200 million in a day, while stablecoin circulating supply still falls $1.754 billion over seven days
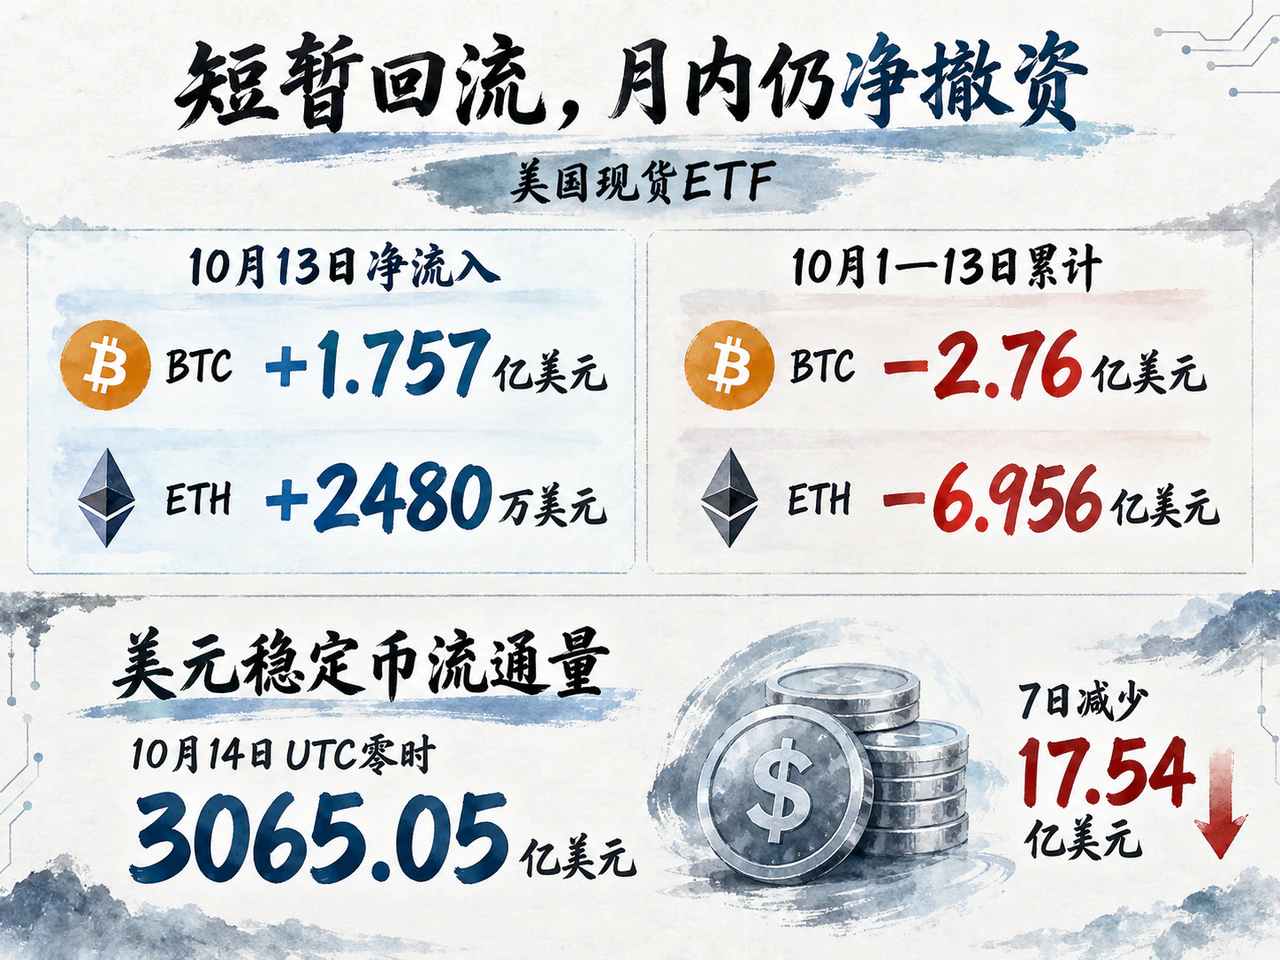
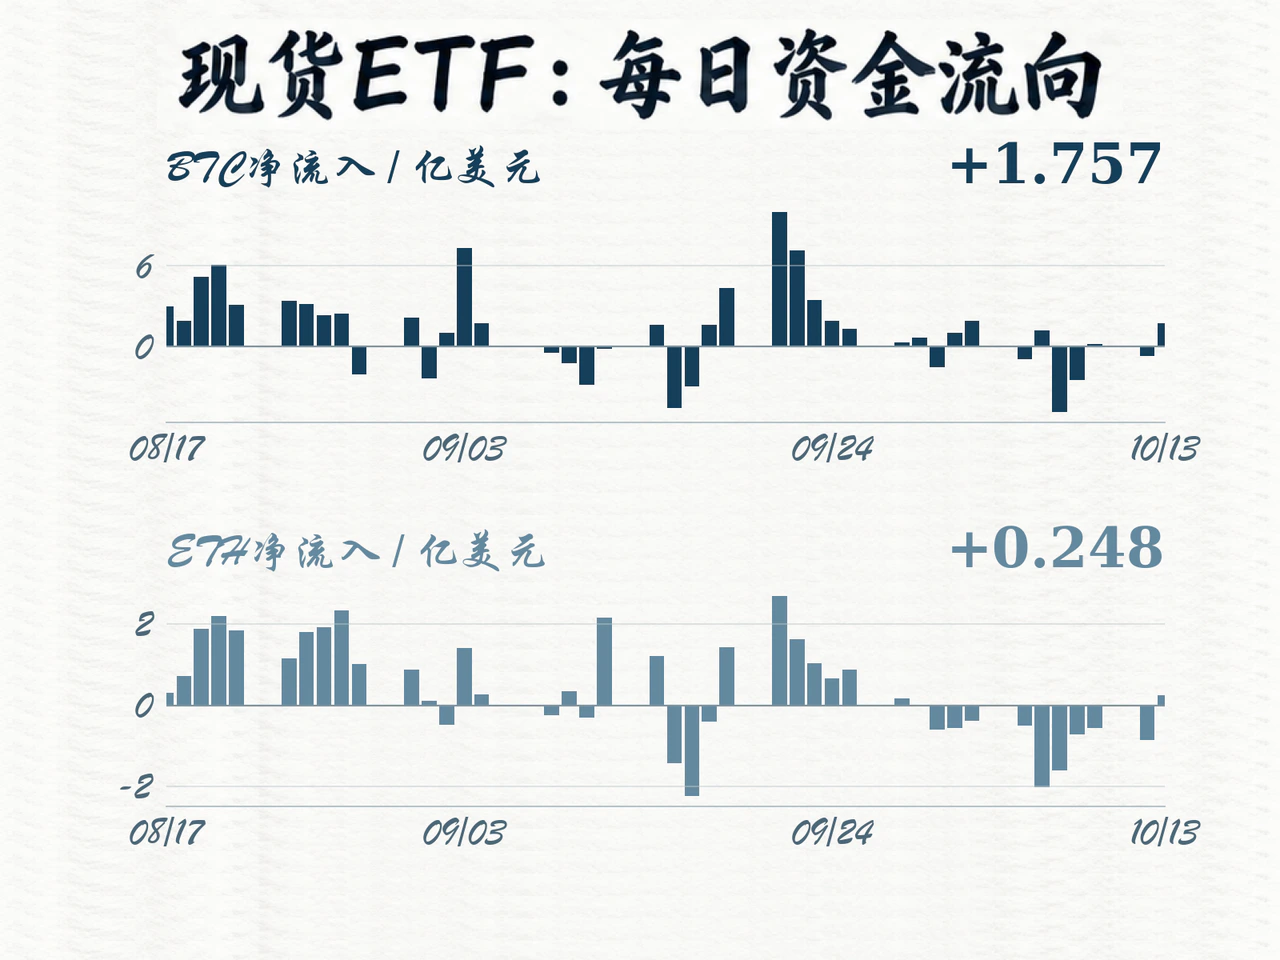
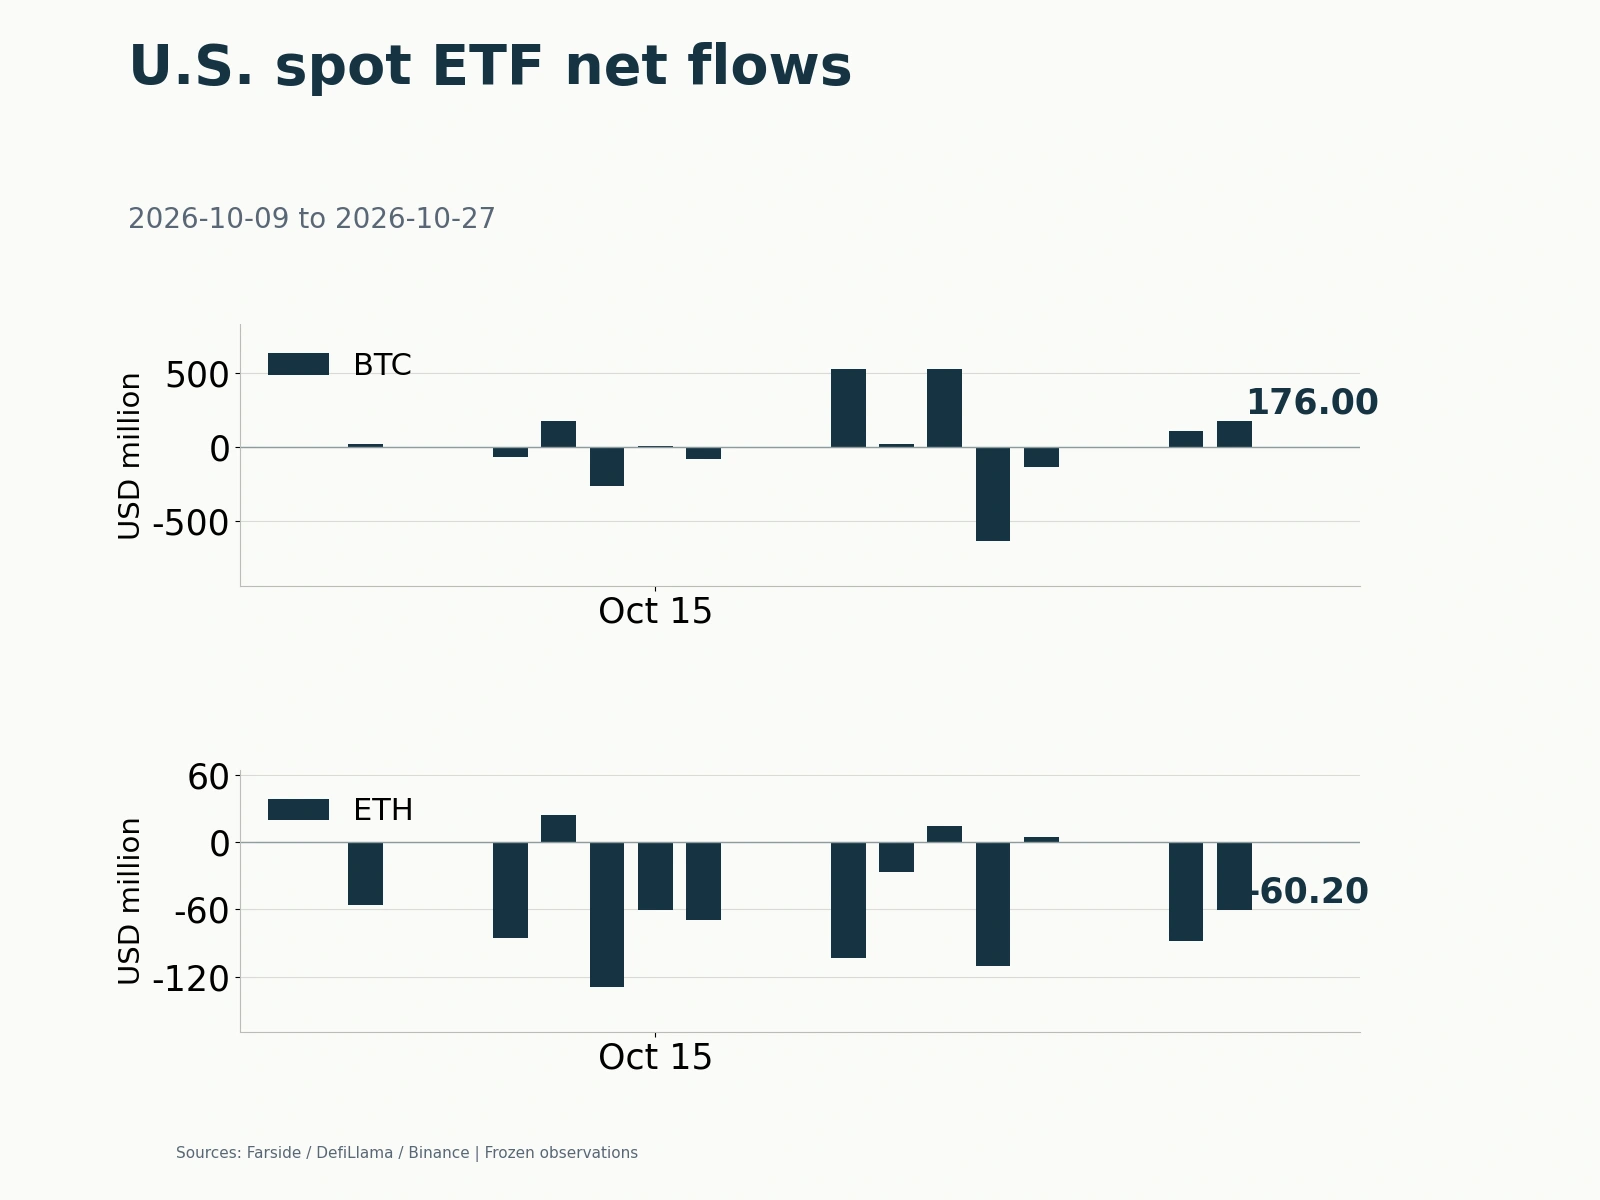
According to Farside's latest complete figures, U.S. spot Bitcoin ETFs received $175.7 million in net inflows on October 13 and spot Ether ETFs $24.8 million. Their combined net inflow of approximately $200 million ended the previous trading day's simultaneous outflows. Bitcoin ETF inflows were concentrated in leading products: Fidelity's FBTC received $103.1 million and BlackRock's IBIT $65.9 million.
One day's inflow was not enough to reverse this month's withdrawals. Across the nine U.S. trading days from October 1 to October 13, spot Bitcoin ETFs recorded cumulative net outflows of $276 million and spot Ether ETFs $695.6 million. Ether ETF inflows on October 13 amounted to only about 3.4% of the cumulative outflows over the preceding eight consecutive trading days. A substantive recovery in allocation demand still requires sustained subscriptions to absorb the earlier withdrawals.
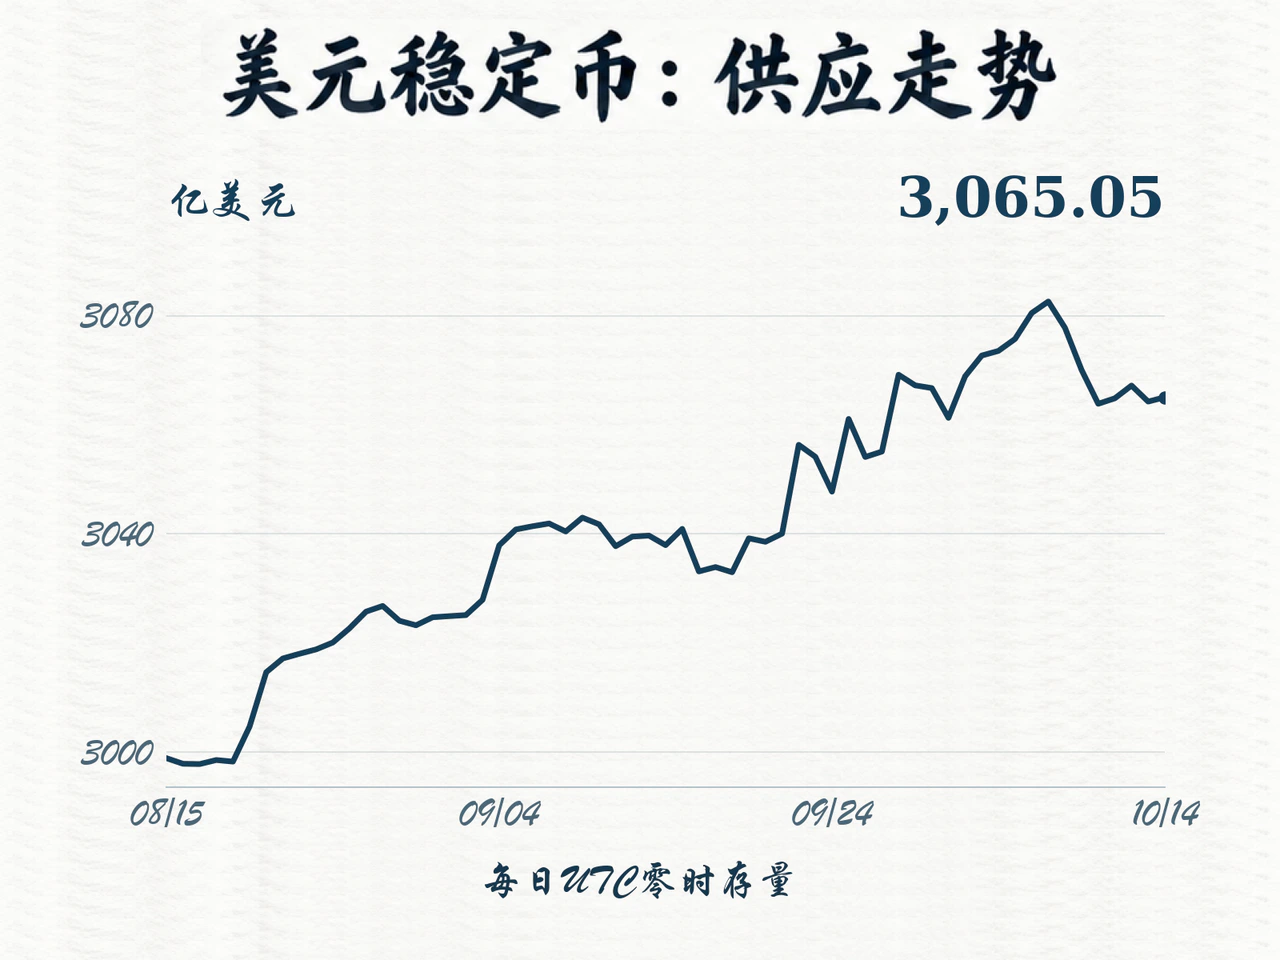
On-chain dollar liquidity similarly showed a small daily increase but a weekly contraction. DefiLlama's October 14, 00:00 UTC observation put total circulating supply of dollar-pegged stablecoins at approximately $306.505 billion, up $78.64 million from the previous day and $2.709 billion from 30 days earlier, but still down $1.754 billion over seven days. The basis for longer-term expansion remained, while available circulating balances continued to shrink over the latest week.
The two leading stablecoins diverged. At the same observation time, USDC circulating supply was about $73.157 billion, up $284 million in a day but down $1.153 billion over seven days. USDT supply was approximately $184.127 billion, down $42.13 million in a day and $75.62 million over seven days. Unlike ETF subscriptions that directly generate buying of underlying assets, stablecoin circulating balances cover trading reserves, on-chain settlement, lending and cash holdings; they also differ from issuers' gross minting and redemption volumes. With weekly balances still unrecovered, USDC's daily increase represented only localized stabilization within a recent contraction, and alone could not establish that broad market buying had returned. Taken together, ETFs and stablecoins showed the first signs of incremental inflows, but their scale remained smaller than cumulative withdrawals this month, leaving limited spot buying support.
Binance Ether open interest rises 4.65%, alongside negative funding and higher option volatility
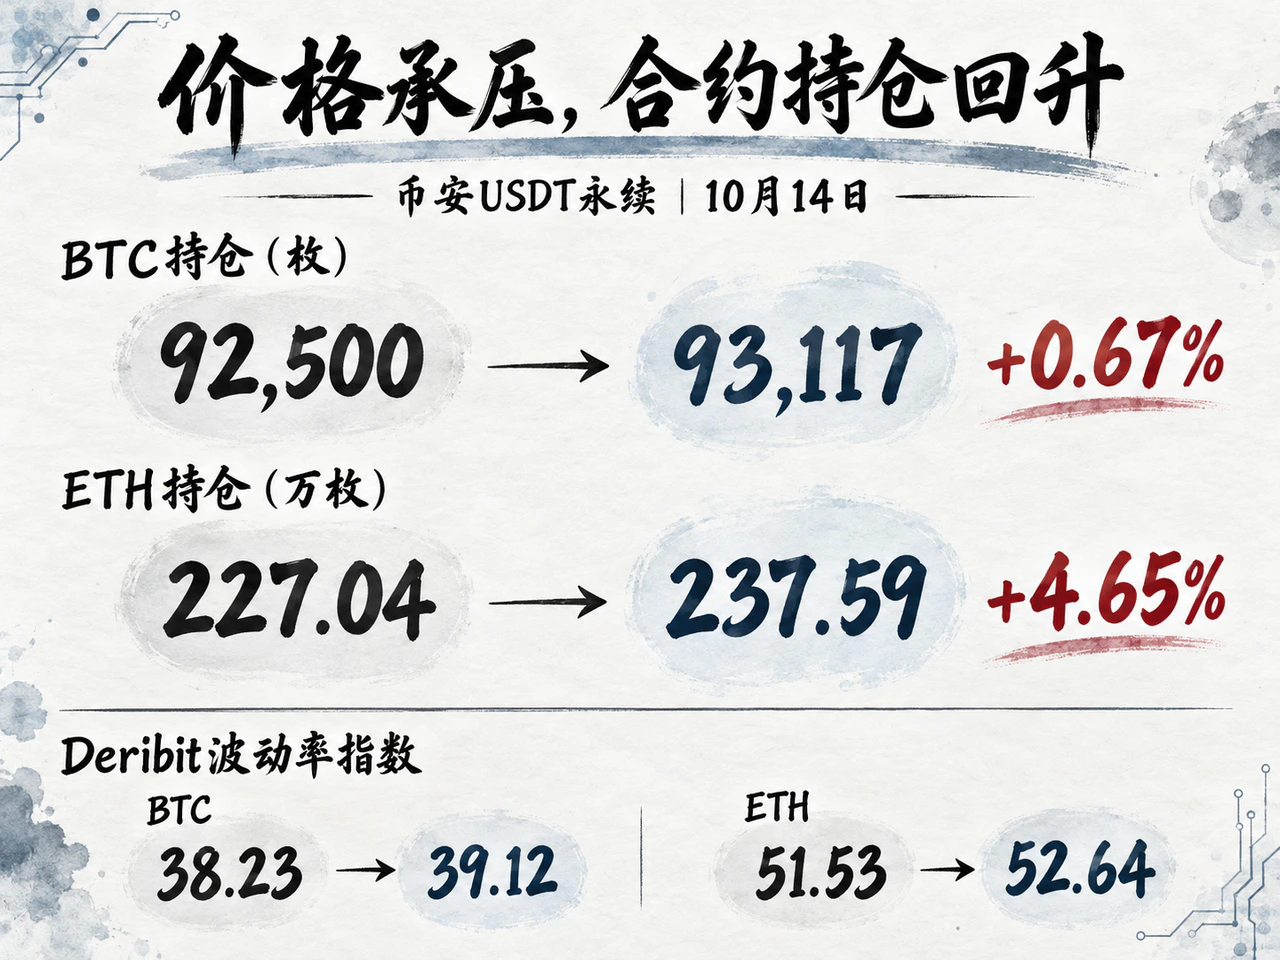
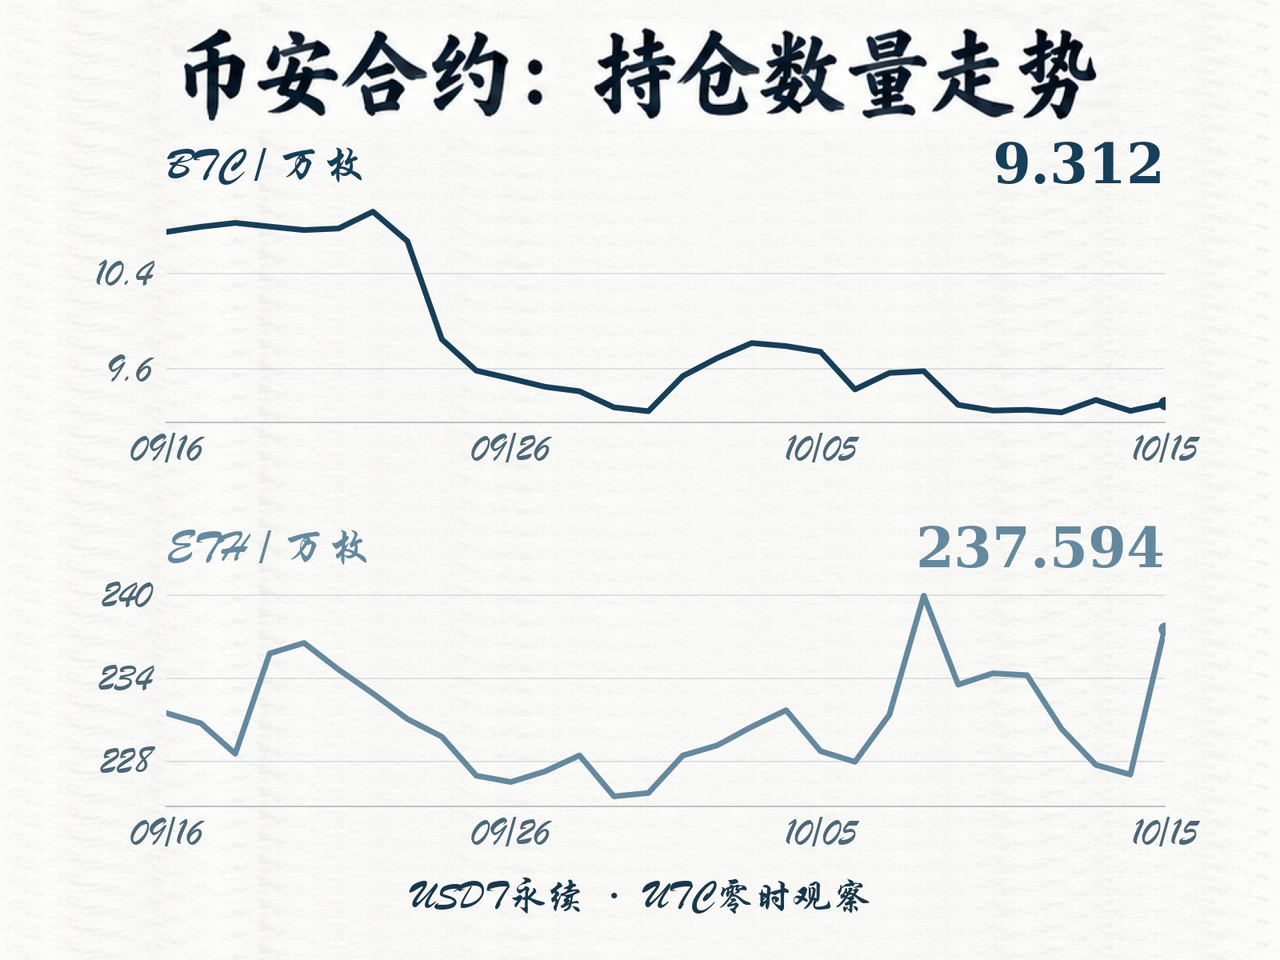
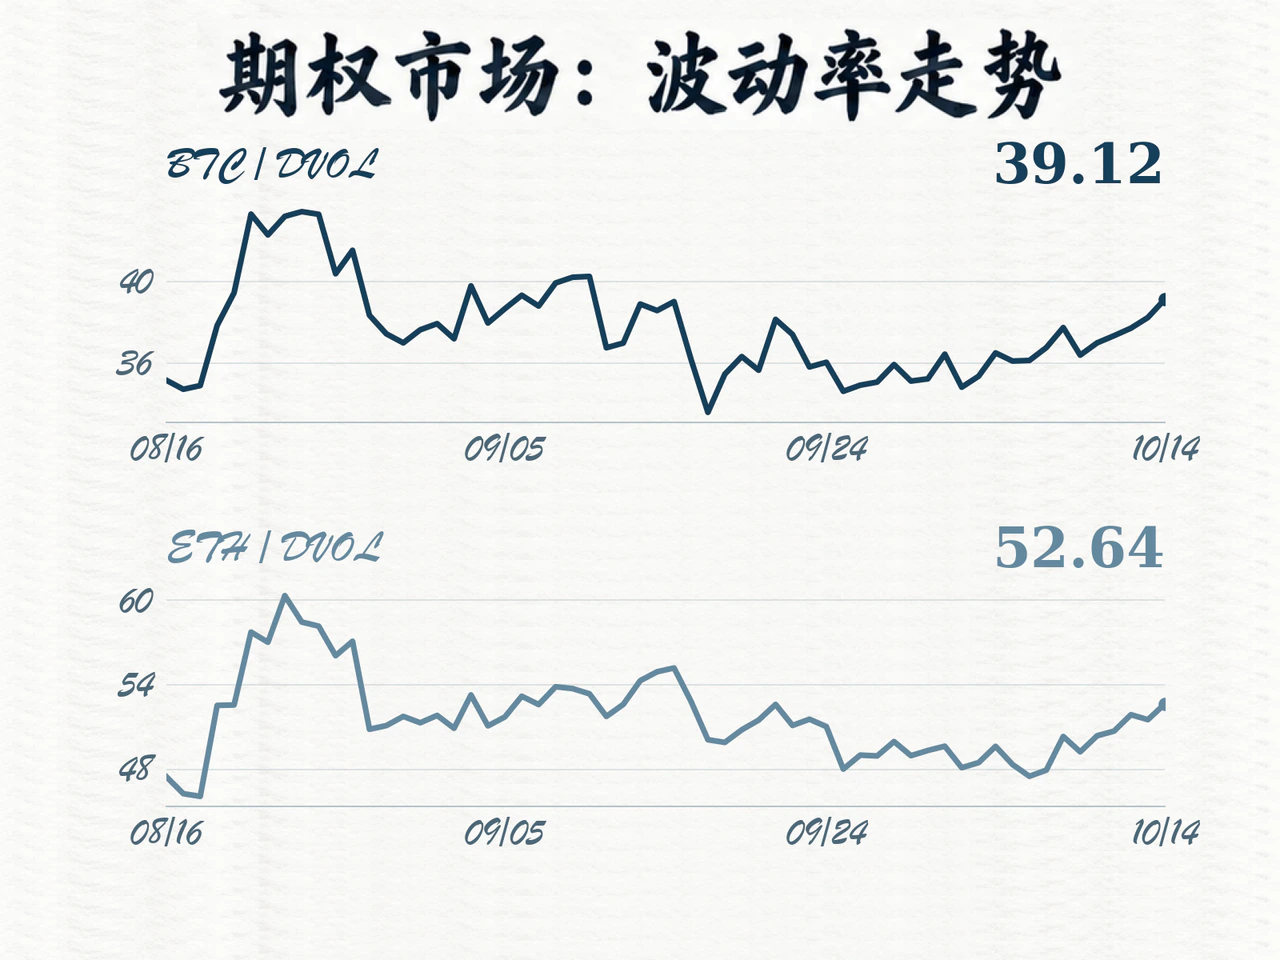
Derivatives markets saw clear position expansion on October 14, from 00:00 UTC to 00:00 UTC the following day. Binance USDT perpetual data showed Bitcoin open interest rising from 92,500.21 BTC to 93,117.26 BTC, up 0.67%. Lower prices nevertheless reduced its USDT notional value from 7.689 billion to 7.602 billion USDT, masking the actual increase in coin-denominated positions. Ether positions expanded much faster: open interest rose from 2.2704 million ETH to 2.3759 million ETH, up 4.65%. New positions outweighed the valuation effect of falling prices, lifting USDT notional open interest from 5.669 billion to 5.752 billion USDT.
Higher open interest reflects expanded aggregate long and short risk exposure, but holding costs did not indicate crowded longs. Binance Bitcoin perpetuals' three eight-hour funding rates on October 14 summed to -0.001282%; Ether's totaled +0.003898%. Both turned negative at the final settlement of the day. The sharp increase in Ether open interest alongside negative late-session funding suggests widening disagreement: positions expanded as funding weakened, potentially reflecting simultaneous entry of hedging shorts or bearish trading capital.
Intraday liquidations did not reduce leverage over the full day. CryptoSlate cited CoinGlass figures showing more than $100 million in crypto liquidations in the hour after the U.S. inflation report. Although abrupt price changes quickly triggered forced closures, end-of-day open interest in the Binance sample actually increased, indicating that new capital had replaced positions being liquidated. Risk exposure was redistributed among traders without substantive overall clearance.
Options markets also repriced volatility higher. Deribit's daily DVOL data showed Bitcoin's implied-volatility index rising on October 14 from 38.23 the previous day to 39.12, versus 36.76 a week earlier. Ether's rose from 51.53 to 52.64, versus 47.96 a week earlier. Ether's larger increase in implied volatility was consistent with its rapid perpetual-position expansion, raising the cost of trading or hedging price swings.
Overall, weak spot inflows, rebuilt contract leverage and higher option-volatility pricing form the central tension in current funding conditions. Establishing firm price support still requires consecutive ETF subscriptions and sustained recovery in stablecoin circulating balances. Until then, additional derivatives positions are more likely to amplify reactions to subsequent news shocks and may trigger another chain of position reductions.
Click Read Original for the full details.