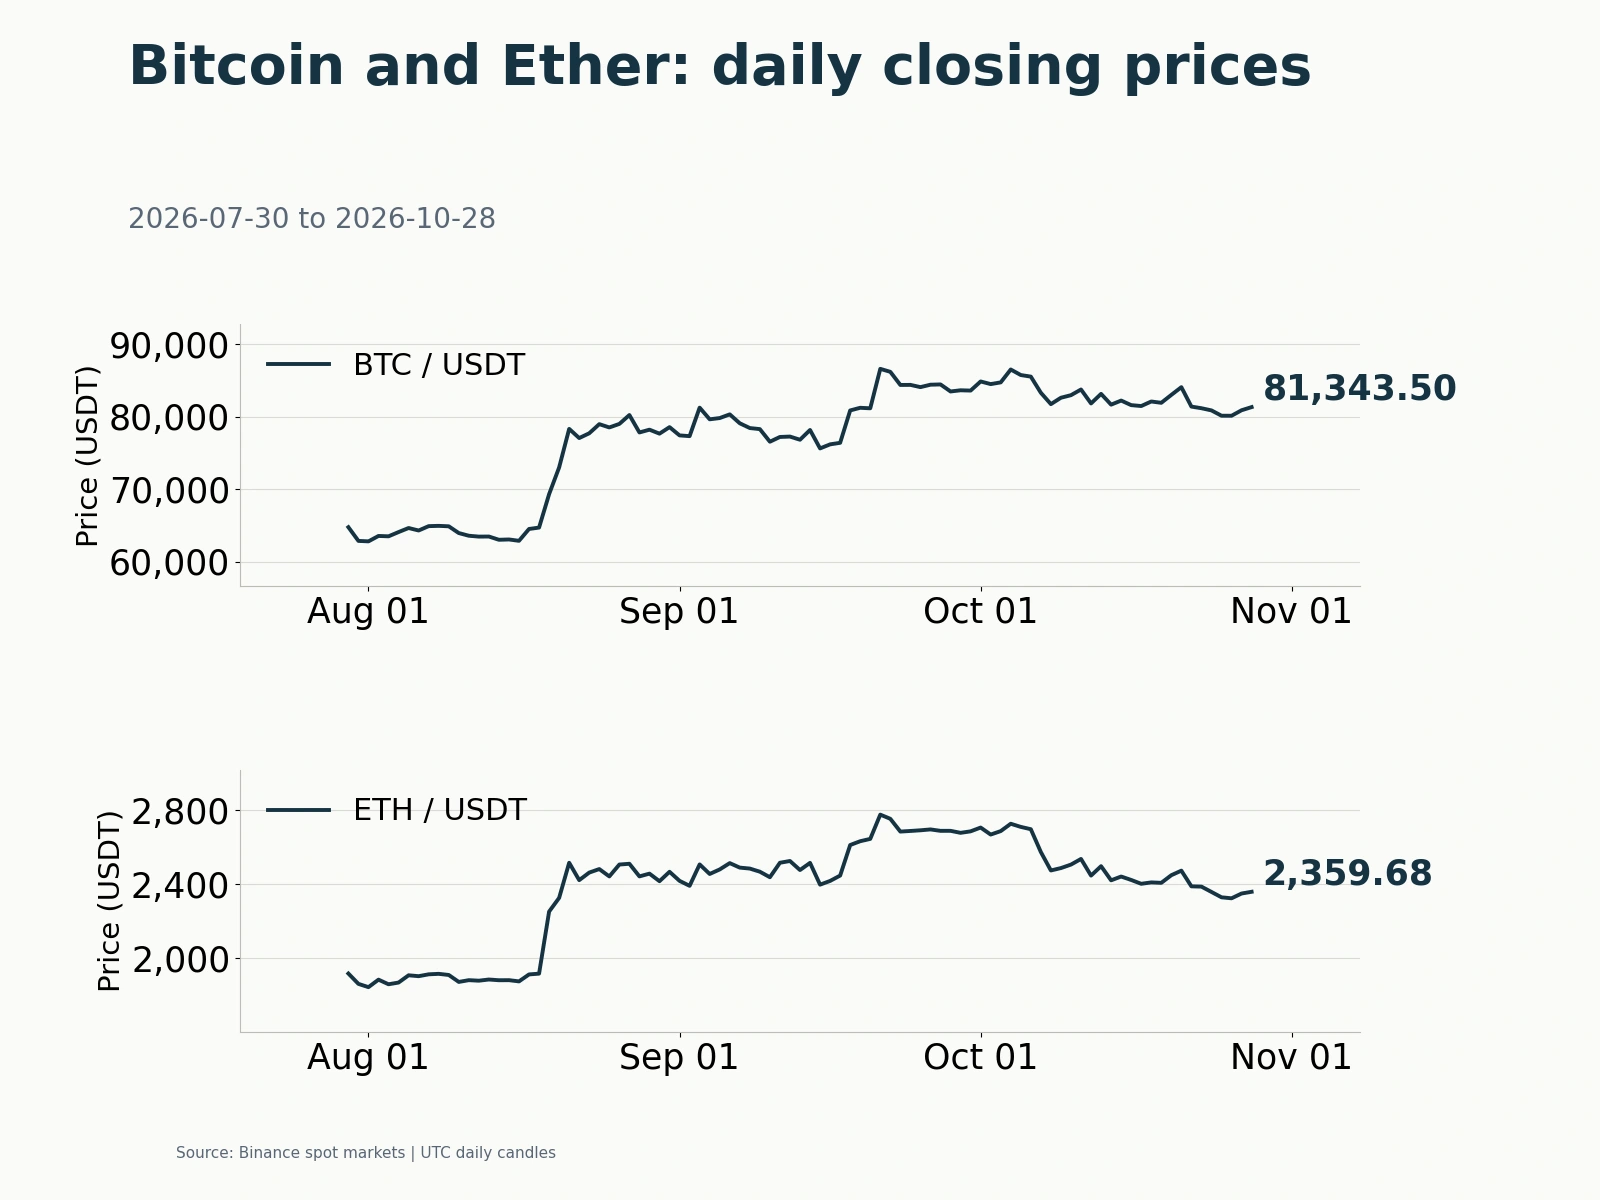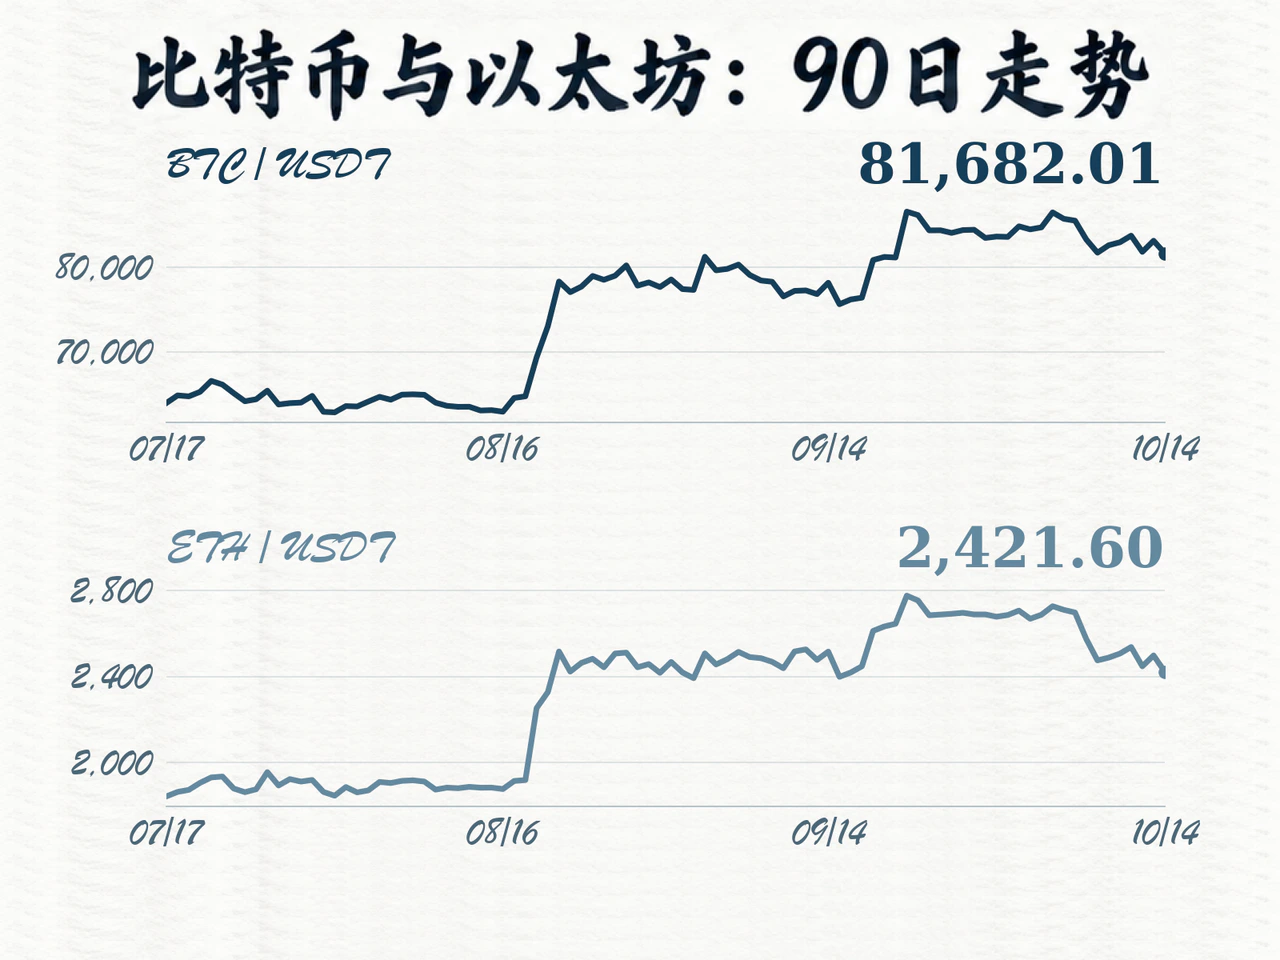
A rebound in U.S. September inflation interrupted the crypto market's recovery. On Binance's spot UTC daily candles, closing at 8 a.m. Beijing time on October 15, Bitcoin finished at 81,682.01 USDT, down 1.79% from the previous day, and Ether at 2,421.60 USDT, down 3.06%. Both major assets rose intraday before retreating to close near their daily lows. Pressure from interest rates staying high or even rising again returned to dominate pricing, while Ether's considerably larger decline extended the market's internal divergence.
September U.S. CPI rebound lifts Treasury yields as Bitcoin and Ether surrender gains on higher volume
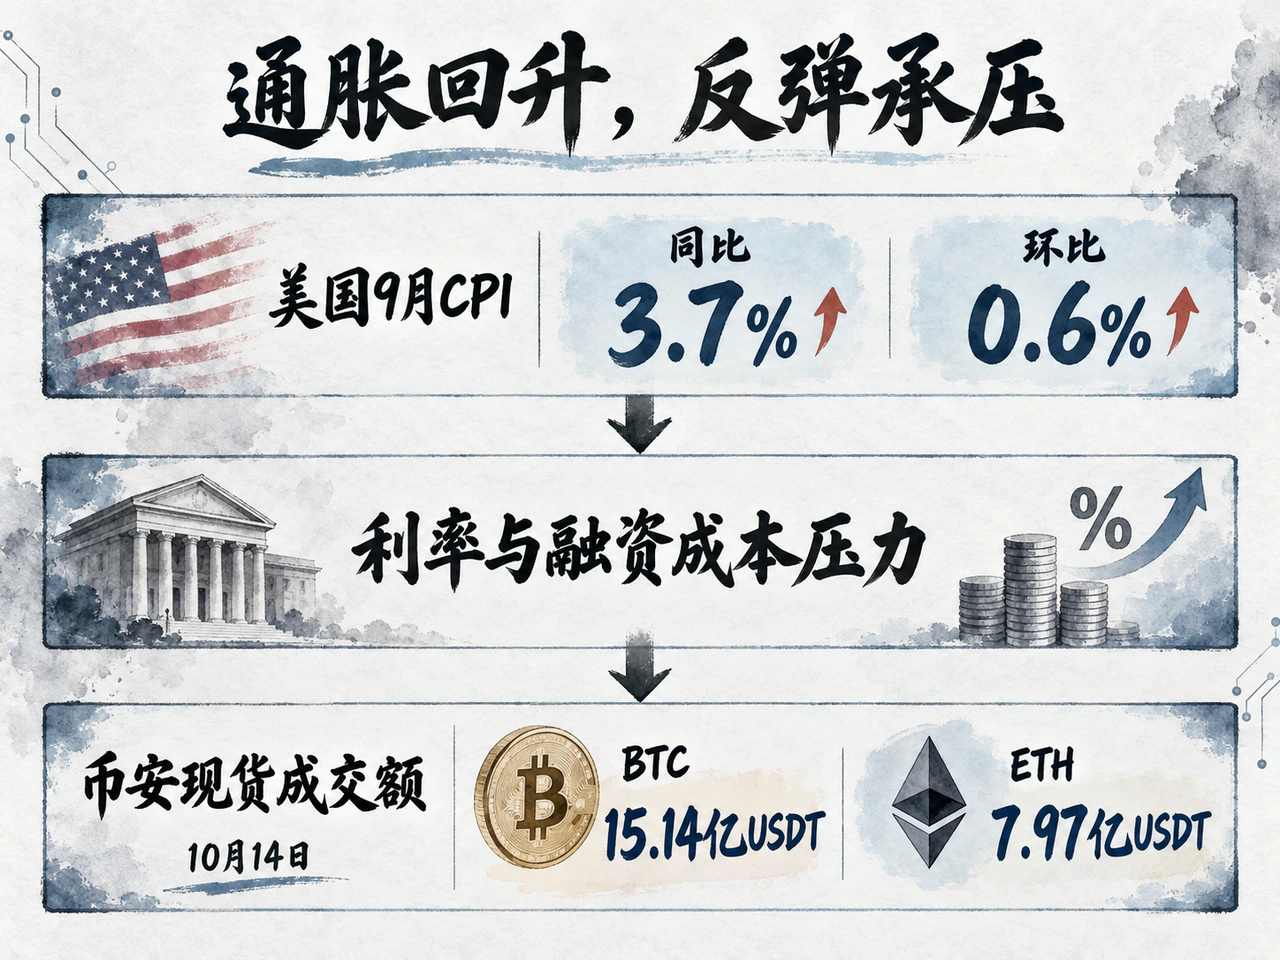
Sentiment had briefly been warmer during Asian trading. CoinDesk reported that Bitcoin approached $84,000 in Asia, buoyed by New York Fed President Williams's remark that further rate increases might not be needed in 2027. Williams nevertheless left room for one more increase this year. Once U.S. September inflation data arrived, early optimism about eventual policy easing rapidly gave way to current inflation pressures.
Bureau of Labor Statistics data showed September CPI up 0.6% month on month, with annual inflation accelerating from 3.4% in August to 3.7%. Core CPI, excluding food and energy, rose 0.3% month on month and 2.6% year on year, both above the market expectations cited by CoinDesk. By component, gasoline prices jumped 9.1% on the month and accounted for more than half the headline increase; shelter inflation also accelerated from 0.3% to 0.4% month on month. The simultaneous energy-price shock and resilient core inflation made it difficult for markets to continue expecting rapid disinflation solely on the prospect of lower oil prices.
Markets across asset classes came under pressure after the release. CoinDesk reported a significant rise in short-term Treasury yields, falls in U.S. equity futures and gold, and a rapid Bitcoin decline of around $1,000. For crypto assets without a fixed coupon, higher risk-free yields directly raise the opportunity cost of holding them. For traders dependent on financing and leverage, a higher price of funding reduces the positions they can carry. The move also validated institutional warnings ahead of the release: Bitget Research chief analyst Ryan Lee said that although the earlier correction had reduced Bitcoin leverage, unexpectedly strong inflation could still trigger another round of forced liquidations. Moon Pursuit Capital founder Utkarsh Ahuja emphasized that rising Treasury yields, the dollar and capital costs would jointly weigh on valuations.
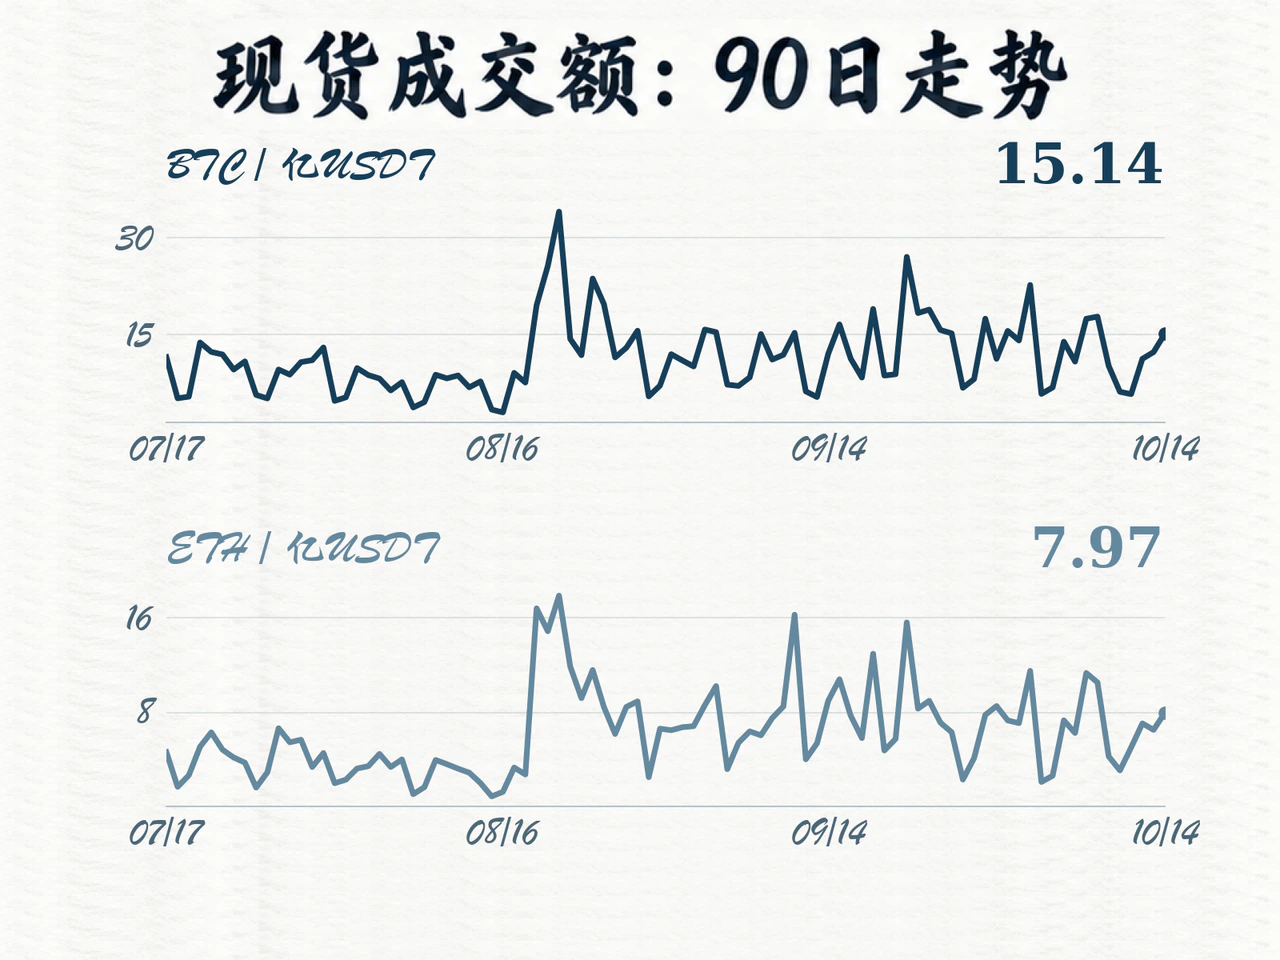
Selling persisted until the daily close. Over the full session, Bitcoin reached a high of 84,146.72 USDT and a low of 81,444.42 USDT, closing less than 0.3% above its low. Ether reached 2,530.44 USDT and fell as low as 2,403.69 USDT, closing less than 0.8% above its low. Spot trading expanded markedly as prices fell: Binance BTC/USDT turnover reached 1.514 billion USDT, about 23% above the previous day, while ETH/USDT turnover was 797 million USDT, up about 22%. Although turnover alone does not distinguish aggressive buying from aggressive selling, higher-volume closes near daily lows showed that the declines were accompanied by substantial repricing and position turnover, rather than a few sell orders pushing prices lower in thin trading.
ETH/BTC falls 7.86% over nearly 30 days amid broad losses; funding costs constrain corporate Bitcoin purchases funded through preferred shares
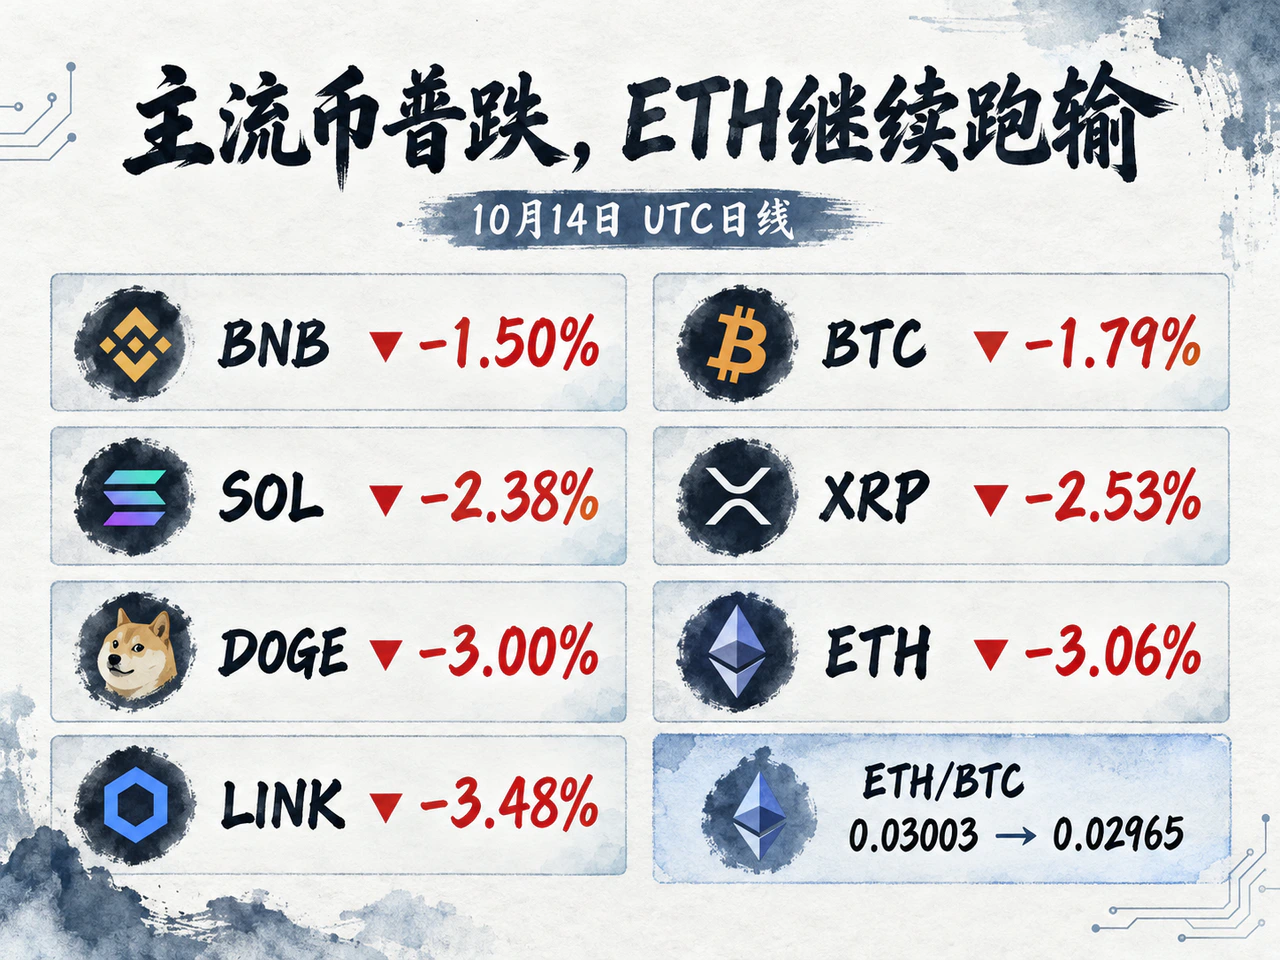
Internal divergence was already visible before the inflation release. In CoinDesk's European morning report, nearly two-thirds of the CoinDesk 100 constituents were already down while Bitcoin still held above $83,000, with DeFi particularly weak. The early rally was fragile without broad participation, and the macro data subsequently amplified the decline. By the end of the full UTC session, all eight high-liquidity coins in the fixed watchlist—BTC, ETH, BNB, SOL, XRP, DOGE, ADA and LINK—had closed lower. BNB (-1.50%) and Bitcoin (-1.79%) were relatively resilient, followed by progressively larger declines in SOL (-2.38%), XRP (-2.53%), DOGE (-3.00%), Ether (-3.06%) and LINK (-3.48%).
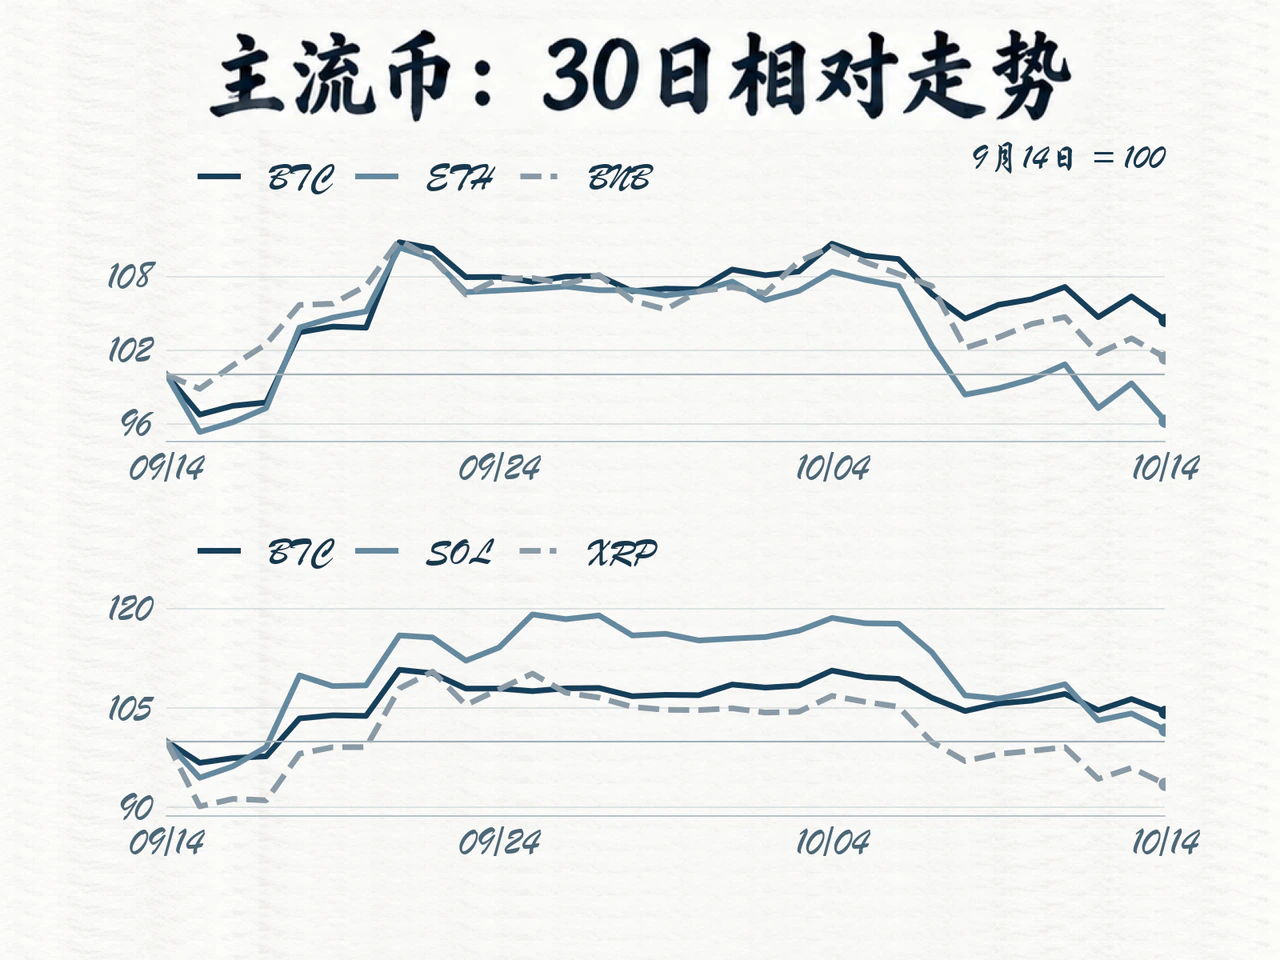
Ether's weakness against Bitcoin was especially pronounced. Using closing prices from the same exchange, ETH/BTC fell from 0.03003 to 0.02965. Over 30 days, Bitcoin gained a cumulative 4.47%, while Ether fell 3.74% and ETH/BTC declined about 7.86%. The gap between fundamentals and token prices also appeared in community disagreements. In Ethereum's October 14 daily community discussion, user NarrowVacation8032 questioned why growth in network usage had not translated into returns for holders; FoucaultCareofSelf instead placed long-term value in the network accommodating more capital flows and developing a monetary premium. Their dispute centered on how technical and application progress enters token valuations. Broadly tighter financing conditions further raised the market's threshold for realized value.
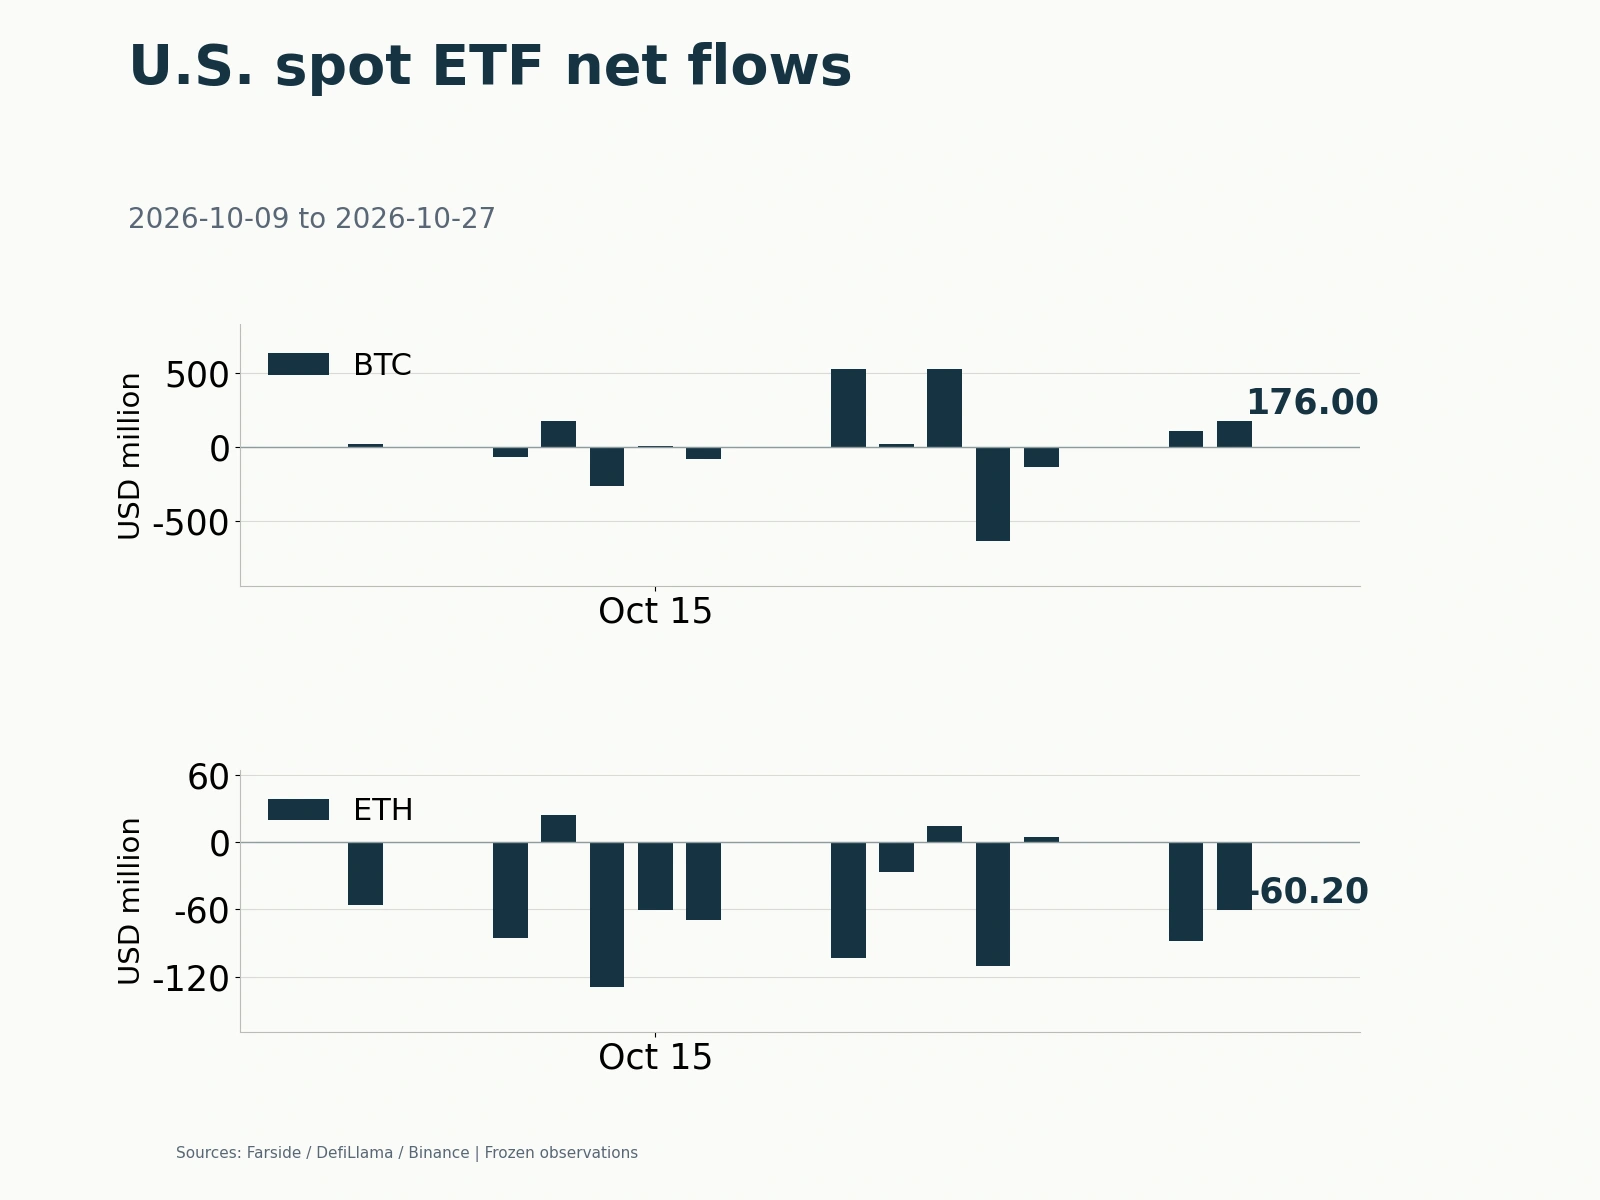
Bitcoin, by contrast, retained support from corporate allocation purchases, although funding-cost constraints were becoming more apparent. Strive disclosed on October 14 that it had bought 2,822 bitcoins on October 12-13 for about $235 million, at an average cost including fees of approximately $83,266, while proposing a new preferred-share offering to fund further purchases. Meanwhile, a K33 research report covered that day questioned the efficiency of Strategy's use of preferred shares to expand Bitcoin holdings, arguing that ongoing dividend obligations and the cost of maintaining dollar reserves would erode returns, while also noting that existing cash reserves provided a long dividend-payment buffer. Market scrutiny of corporate coin buying was shifting from how much more companies had bought to how high, and for how long, the funding costs of additional holdings would be.
Overall, the day's central development was renewed dominance of macro interest-rate pressures in pricing, while the quality of demand for individual assets determined their resilience. Corporate purchases can provide spot demand for Bitcoin, but further expansion depends on refinancing progress and funding costs. Ether's application outlook still needs to translate into a more persuasive proposition for token holders. A durable market recovery would require both easing interest-rate pressure and broader participation in gains. Whether ETH/BTC stops falling will offer a direct measure of the recovery's quality.
Click Read Original for full details.