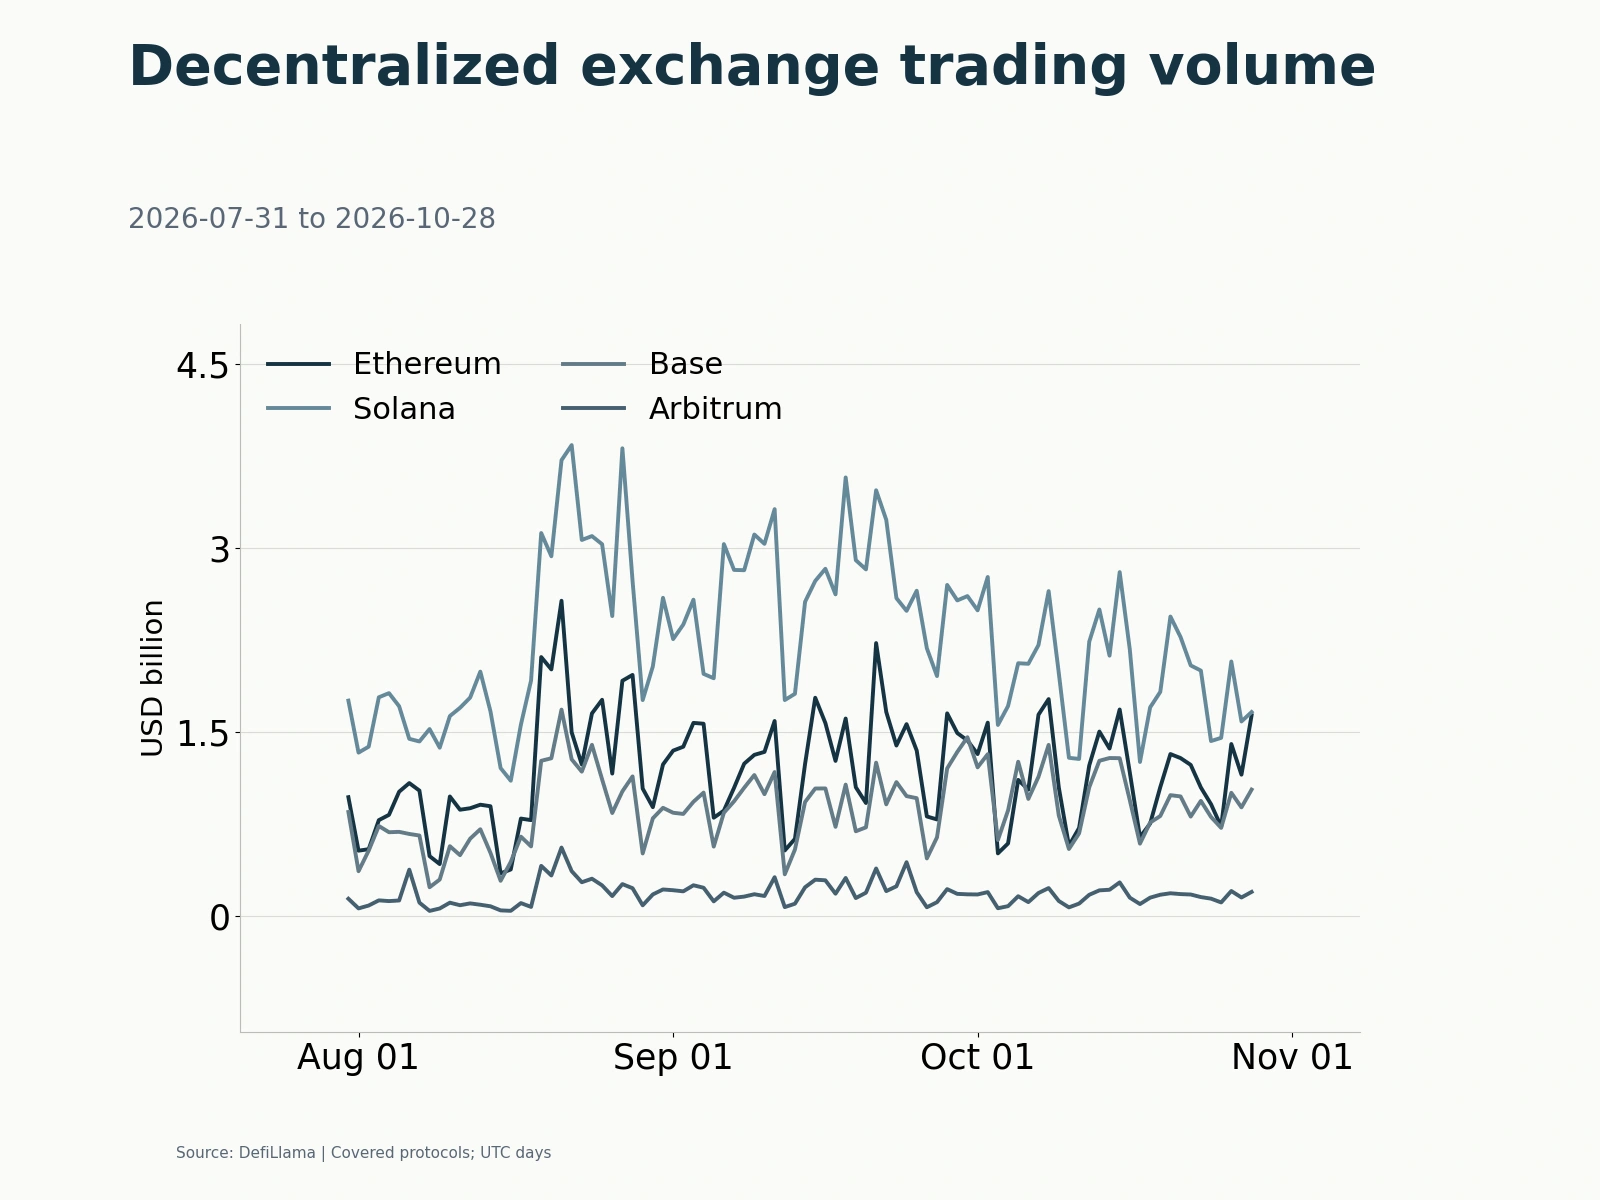
On-chain trading diverged sharply on October 16. Decentralized-exchange (DEX) volume fell across Ethereum, Solana, Base and Arbitrum; only BNB Chain grew among the five listed networks. Meanwhile, tokenized real-world assets (RWA) increasingly expanded through on-chain transfers and collateralized lending, while payment infrastructure accelerated connections between stablecoins and bank accounts. Beyond issuance and total value locked, asset turnover, collateral utilization and revenue retained at the application layer are becoming key measures of network business performance.
Daily DEX volume falls 14.8% to $8.767 billion; Base leads TVL growth and Solana leads application revenue
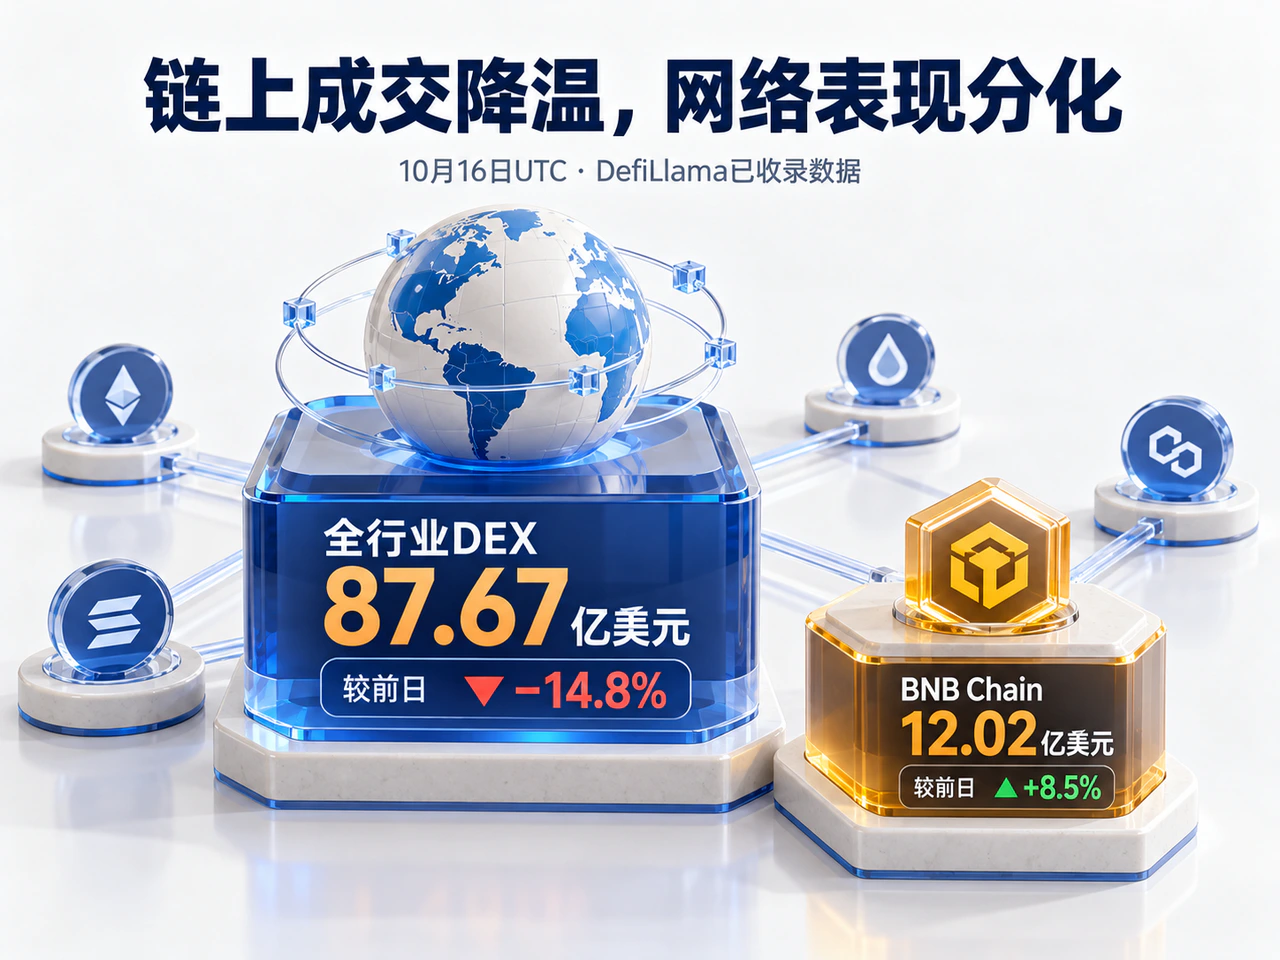
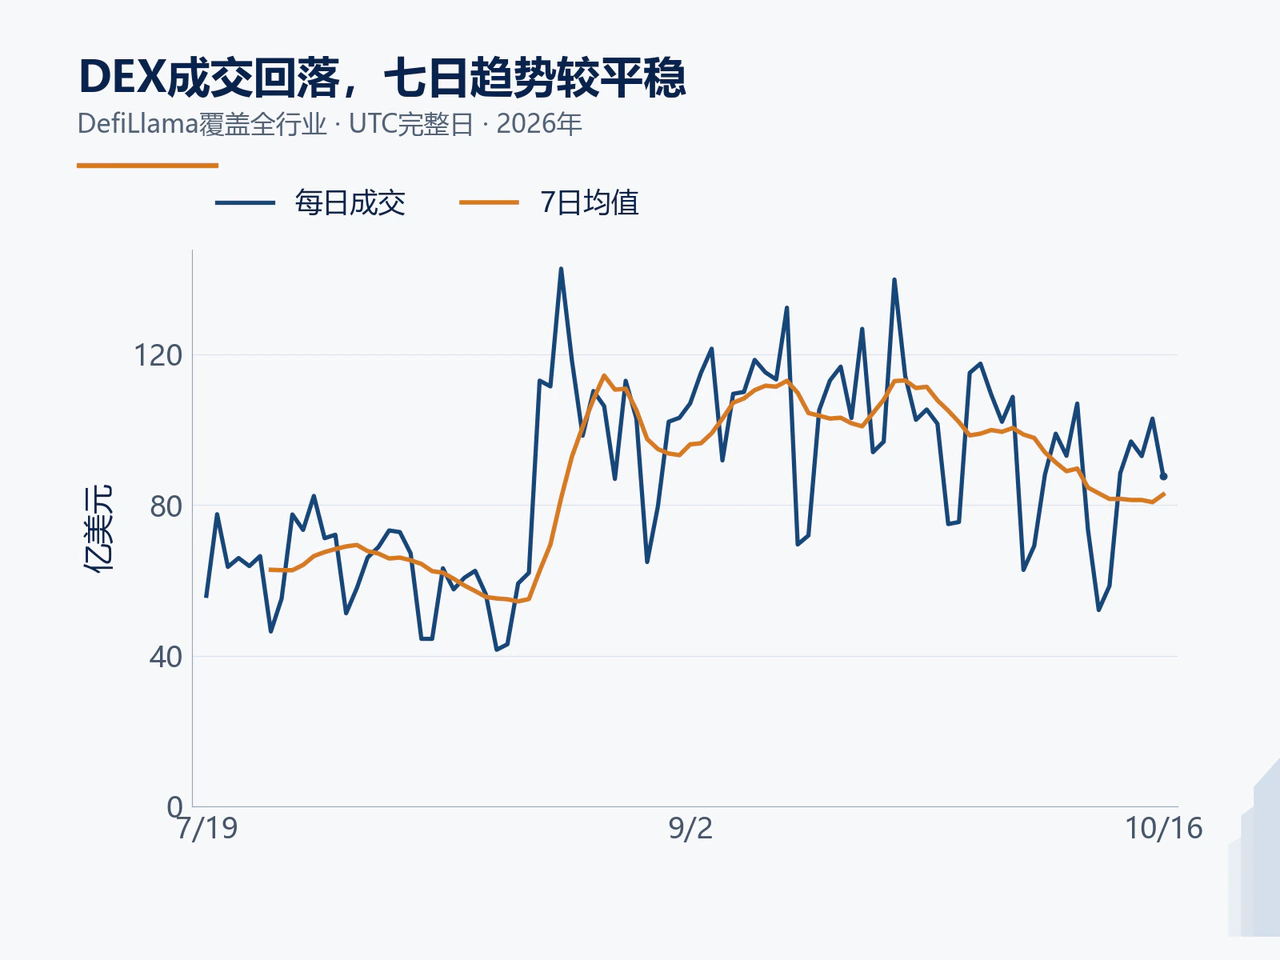
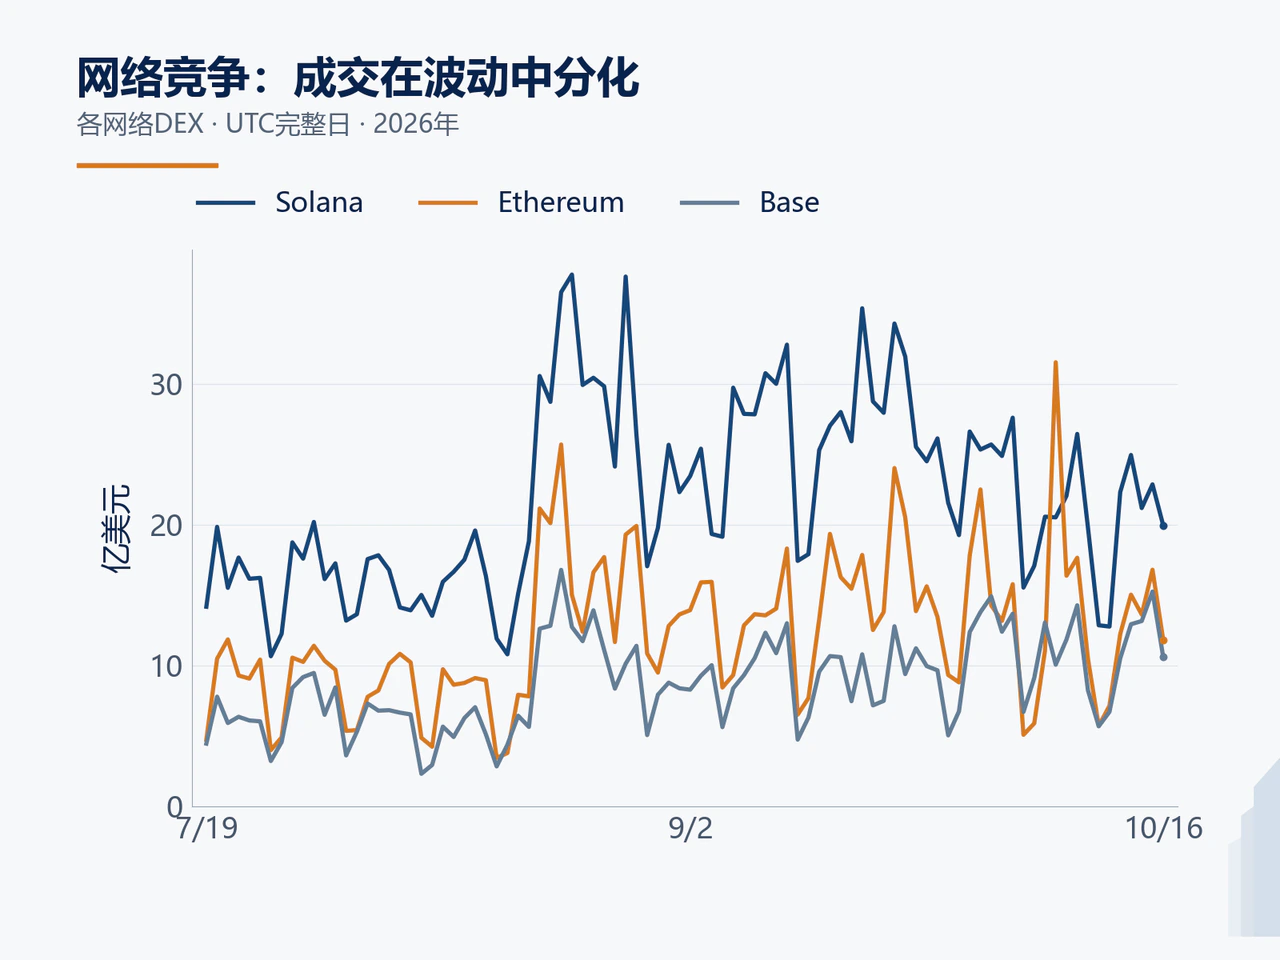
DefiLlama's recorded UTC daily data put industry-wide DEX volume on October 16 at $8.767 billion, down 14.8% from the previous day. Trading contracted across major networks: Solana $1.995 billion, down 12.8%; Ethereum $1.180 billion, down 29.8%; Base $1.060 billion, down 30.5%; Arbitrum $157 million, down 42.2%. BNB Chain bucked the trend, growing 8.5% to $1.202 billion, second only to Solana in daily volume among those five networks.
On a weekly horizon, aggregate trading demand did not contract by the same magnitude. Over the seven complete UTC days through October 16, industry-wide daily DEX volume averaged approximately $8.276 billion, down only about 2.2% from $8.459 billion in the preceding seven days. Ethereum's seven-day daily average fell from $1.401 billion to $1.177 billion, lowering its trading baseline. Base and Arbitrum rose from $1.047 billion and $134 million to $1.070 billion and $169 million, respectively, indicating that their sharp single-day declines on the 16th mainly reversed earlier spikes.
Capital stocks also diverged structurally. DefiLlama's TVL readings dated October 16 showed approximately $49.725 billion on Ethereum, $6.140 billion on Base, $5.916 billion on Solana and $1.403 billion on Arbitrum. Base grew about 11.8% from $5.491 billion on September 16, faster than the other three. Although dollar-denominated TVL reflects both asset-price moves and deposits or withdrawals, Base's expanding TVL and resilient weekly average volume already reveal differences in Layer 2 networks' ability to attract capital.
Application-layer monetization does not follow the distribution of TVL. According to DefiLlama observations published by Solana Compass on October 16, Solana ecosystem applications generated approximately $163 million in revenue over 30 days, exceeding Hyperliquid L1's roughly $75.80 million and Ethereum's $55.67 million. This measure excludes stablecoins, liquid-staking applications and base-layer gas fees, specifically measuring revenue retained at the application layer. The figures show that low-cost networks can generate substantial revenue through high-frequency trading and frontend distribution. Whether that money ultimately accrues to developers, liquidity providers or token holders depends on each protocol's allocation mechanism.
Solana RWA monthly transfers rise over 47% to $9.09 billion; tokenized-equity collateral and business payments advance
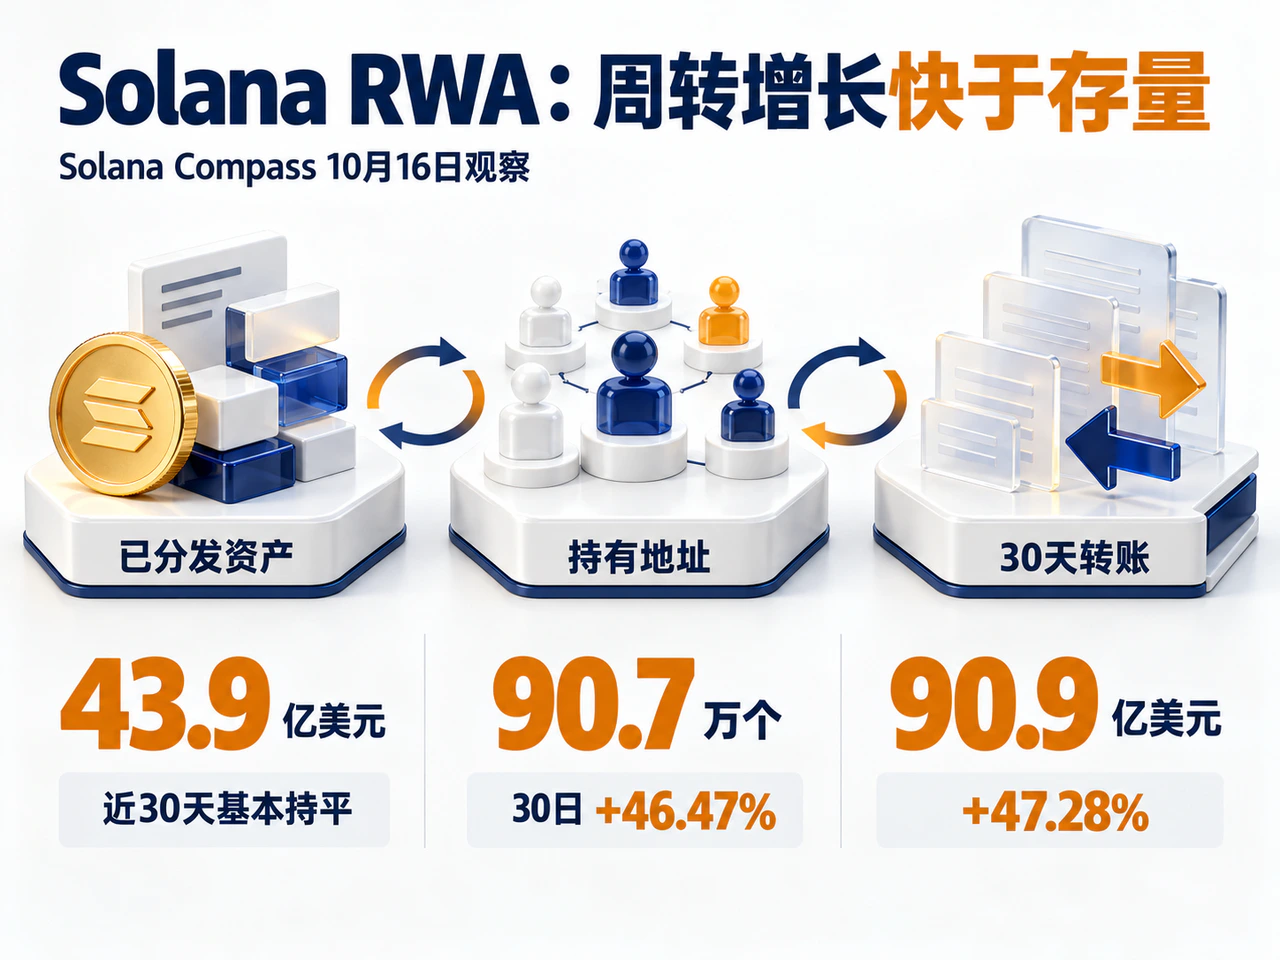
In asset use, more RWA growth is occurring in circulation. Solana Compass, citing RWA.xyz on October 16, put distributed tokenized real-world assets on Solana at approximately $4.39 billion, broadly unchanged over 30 days. Over the same period, holder addresses grew 46.47% to approximately 907,000, while 30-day transfer value rose 47.28% to $9.09 billion, indicating markedly faster on-chain turnover of existing assets.
Trading applications partly drive this activity. Castle Labs research published October 15 said StonkFun collects transaction taxes to buy stock tokens and distribute them to associated token holders, stimulating RWA ownership and circulation. This converts speculative trading revenue into stock-token demand, but also means new holder addresses include mechanized in-app distributions and cannot simply be equated with new independent investors. The report also showed StonkFun's seven-day average daily revenue declining to approximately $490,000, only about 21% of its peak, highlighting substantial cyclical volatility in distribution models dependent on trading enthusiasm.
Beyond trading-based distribution, collateralized lending opens income and financing opportunities for tokenized assets. Castle Labs estimates that more than $65 million of tokenized equities are already deployed in yield-generating uses, principally xStocks collateralized lending on Kamino and Jupiter Lend. Holders can borrow on-chain liquidity while retaining equity-price exposure, while lending platforms earn interest and fees. Because these activities directly connect off-chain share prices and trading-hour constraints with on-chain liquidation, sustained borrowing growth depends heavily on collateral quality and risk controls such as haircuts, as well as financing costs.
Payments developments focus on reducing business integration costs. Mastercard and BVNK announced the Global Money Platform on October 15, attracting continued market attention on the 16th. Businesses can embed fiat and stablecoin accounts, currency conversion, linked payment cards and local bank payouts through one interface. The platform is already available through BVNK; planned expansion of its local payout network to over 40 currencies and more than 200 countries and territories is scheduled for 2027.
Trading platforms earn fees from asset turnover, collateralized lenders seek to improve tokenized assets' capital efficiency, and payment accounts connect stablecoins with everyday receipts and disbursements. Each serves different demand and faces different risk-control boundaries. As on-chain assets gain uses, applications' ability to sustain genuine, stable demand after trading cools and incentives weaken will determine the quality of their long-term revenue.
Click Read Original for further details.