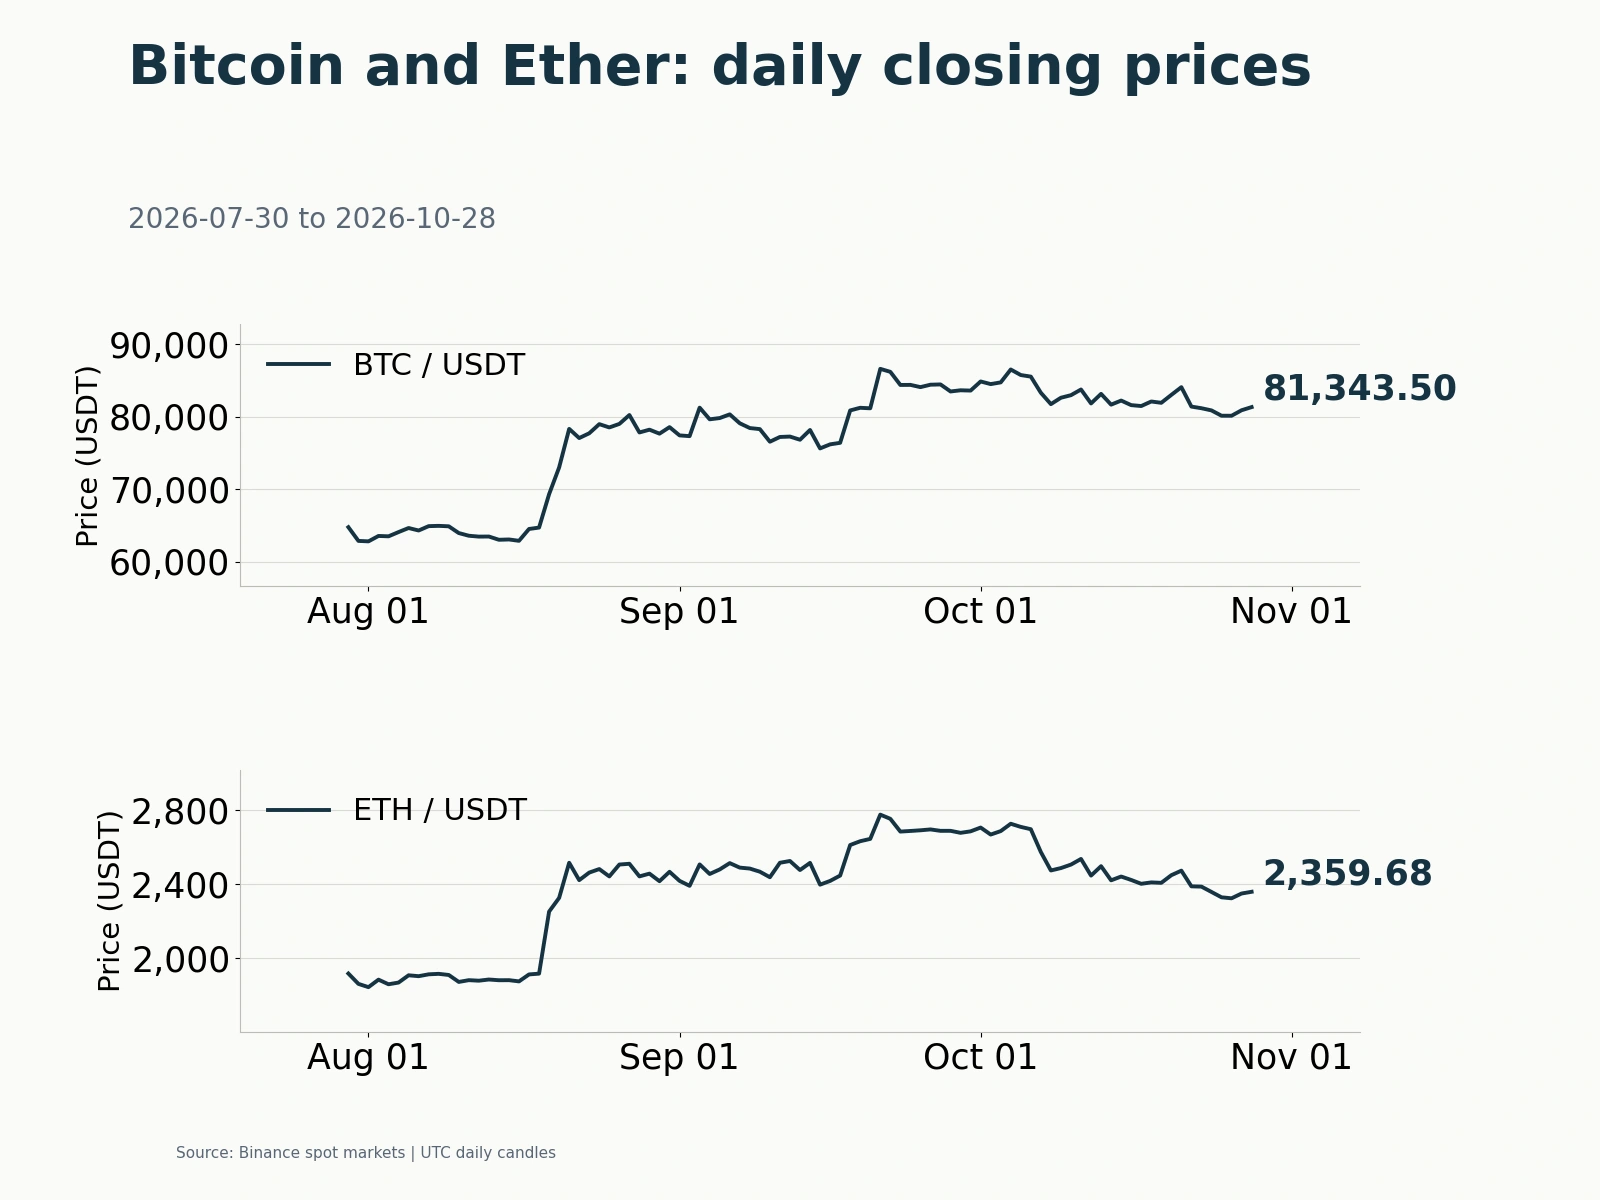
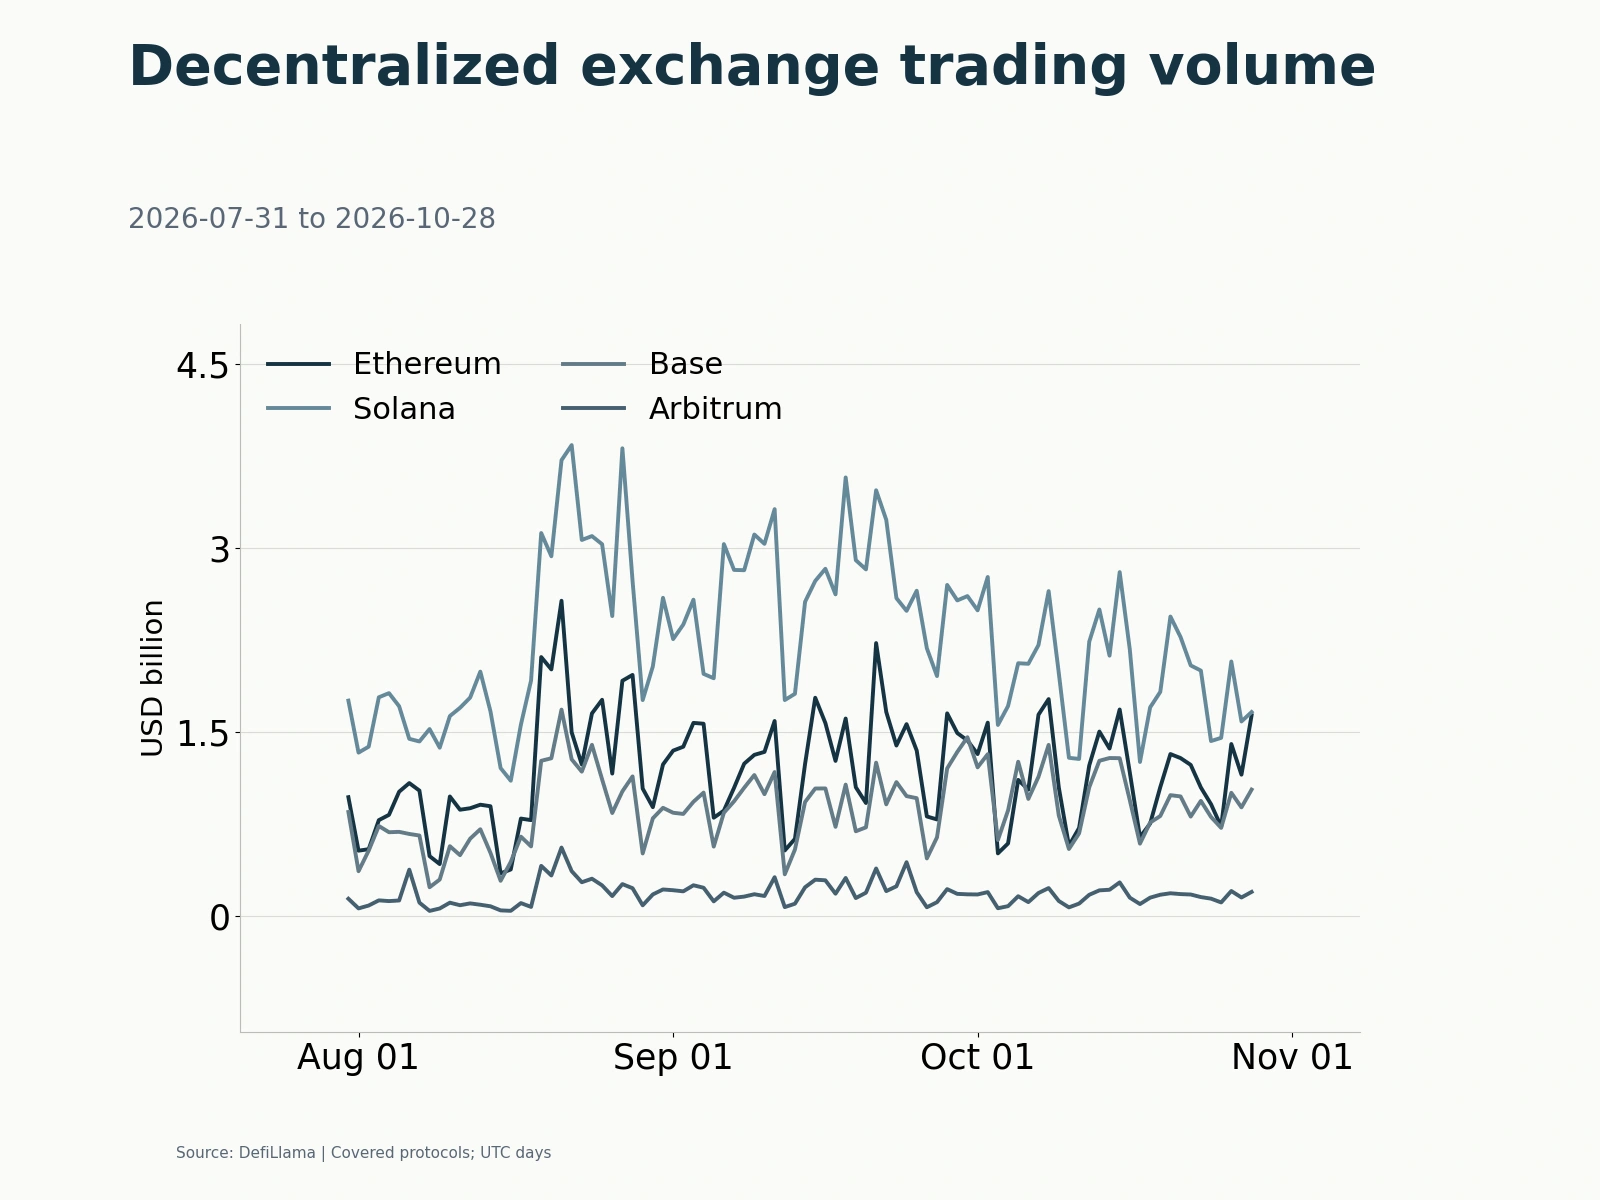
Over the full October 20 UTC trading day, corresponding to 08:00 on October 20 through 08:00 on October 21 Beijing time, Binance spot BTCUSDT and ETHUSDT closed up 1.33% and 1.71%, respectively, on their UTC daily candles. As prices recovered, funding channels improved at different speeds: US spot Bitcoin ETFs again attracted substantial net subscriptions, but buying was heavily concentrated in a single leading product; the total circulating supply of US dollar stablecoins within the crypto market continued to contract slightly; and Binance perpetual funding rates rose above their 30-day averages. The short-term rebound has gained support from major allocation flows and derivatives longs. Its durability, however, depends on whether spot buying broadens across products and whether underlying market liquidity resumes expanding.
Bitcoin ETFs Take In More Than $500 Million in a Day, Concentrated in IBIT and Diverging from Ethereum

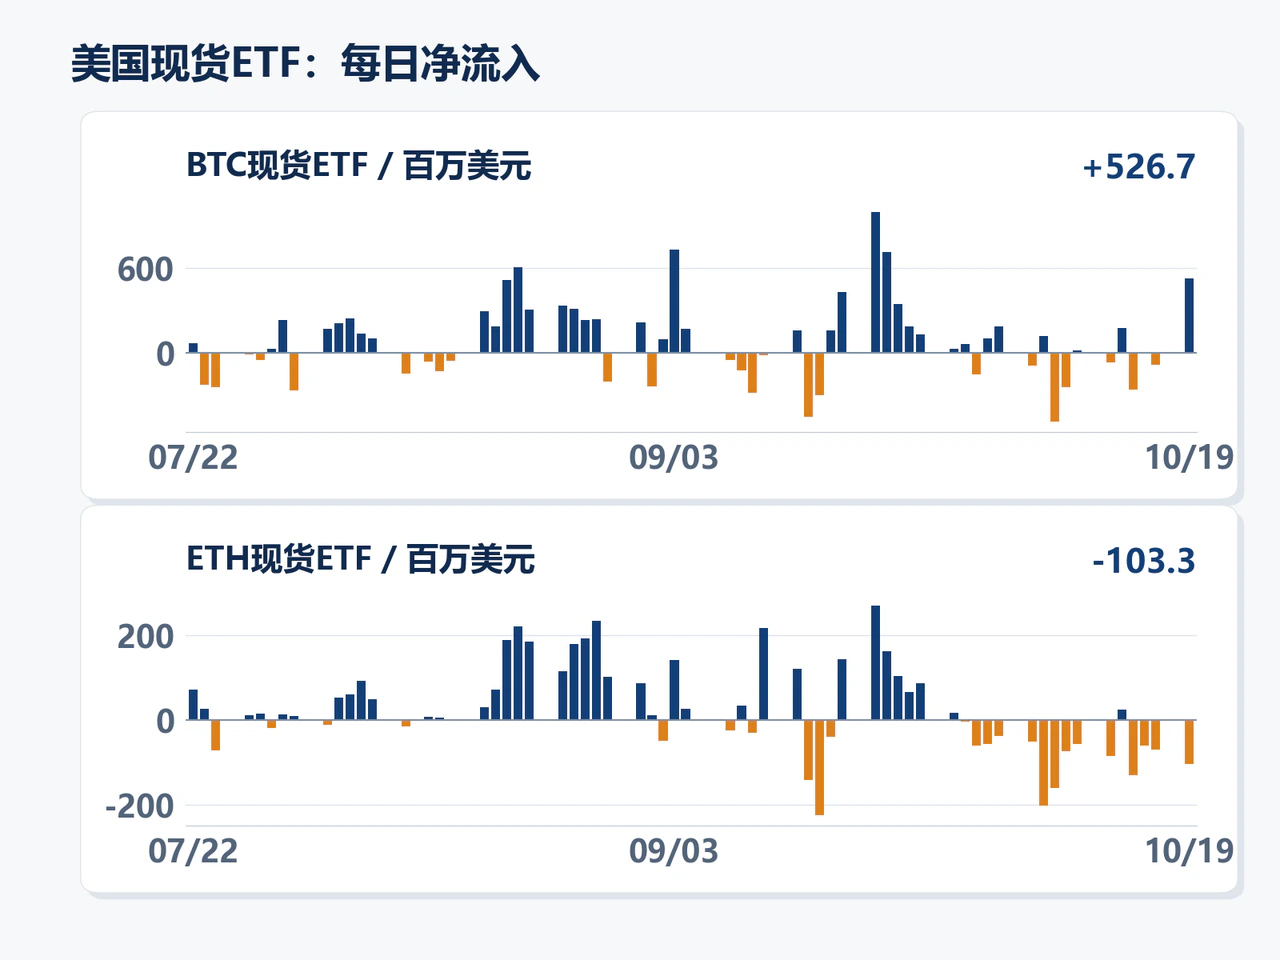
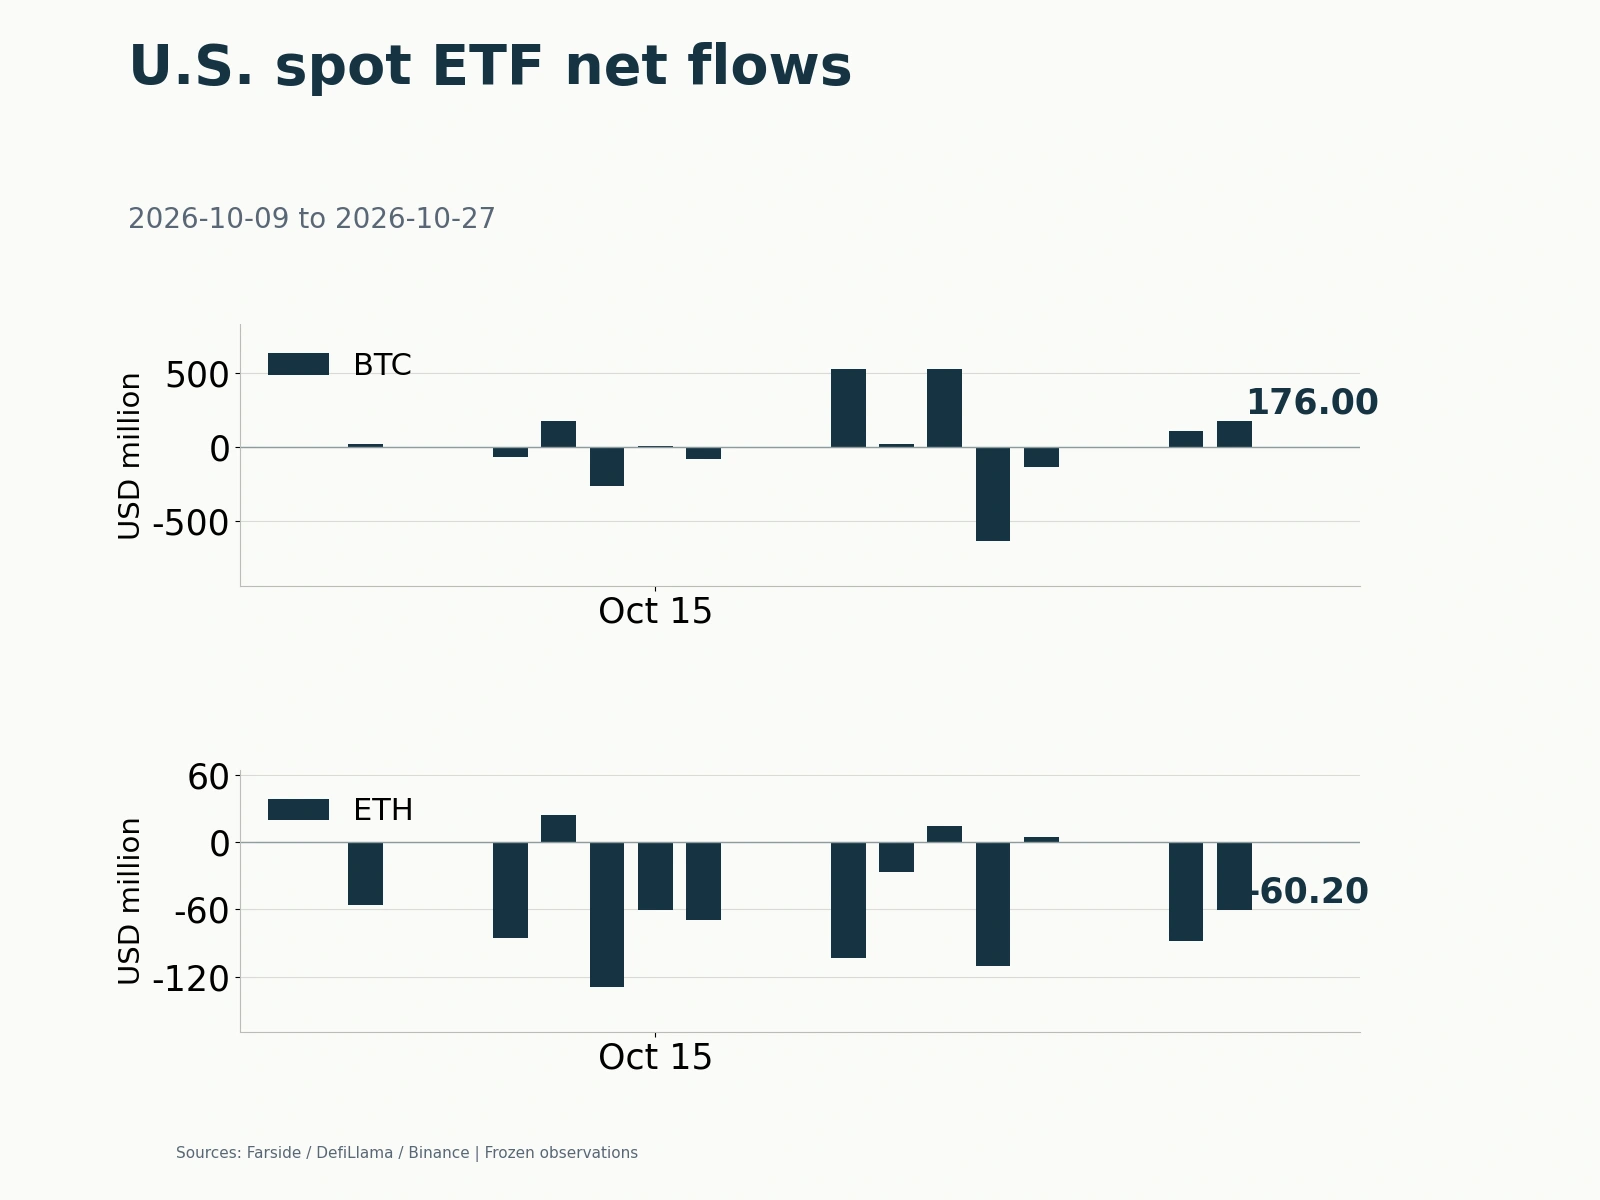
Farside data show that US spot Bitcoin ETFs recorded net inflows of $526.7 million on October 19, their largest daily inflow since September 22. By product, flows were heavily concentrated in BlackRock's IBIT, which attracted $665.2 million in a single day, exceeding the market's aggregate net inflow. Fidelity's FBTC and Grayscale's GBTC recorded net outflows of $83.6 million and $54.9 million, respectively, while the other products combined also remained in net redemption.
These large one-day subscriptions eased the persistent redemption pressure seen since the start of October. Spot Bitcoin ETFs had recorded net withdrawals in each of the previous two weeks: $678.9 million in total during October 5–9 and $228.4 million during October 12–16. Buying on October 19 exceeded twice the previous week's outflows, narrowing cumulative net outflows for October 1–19 to $88 million. The shift from two consecutive weeks of net withdrawals to a substantial one-day replenishment signals improving marginal demand. But with cumulative flows for the month still negative, confirmation of a trend requires continued allocations in subsequent sessions.
Spot Ethereum ETFs, by contrast, remained under pressure. They recorded net outflows of $103.3 million on October 19, with ETHA alone losing $95.4 million; cumulative net outflows for October 1–19 reached $1.0584 billion. Over the longer September 21–October 19 window, Bitcoin ETFs attracted cumulative net inflows of $2.2463 billion, while Ethereum ETFs experienced cumulative net outflows of $413.9 million. Although spot prices of both assets rose on October 20, flows through institutional allocation channels still showed a clear preference for Bitcoin.
At the time of compilation, ETFs that had disclosed October 20 figures still showed divergent flows: FBTC had net inflows of $3.6 million and BITB net outflows of $10.3 million. A full assessment of aggregate allocations awaited complete data from the major products. The key tests of this rebound's strength are whether substantial buying spreads beyond a single product and whether sustained redemptions from Ethereum ETFs stabilize.
Stablecoin Circulation Falls $2.289 Billion in a Week as Funding Rates and Open Interest Recover First
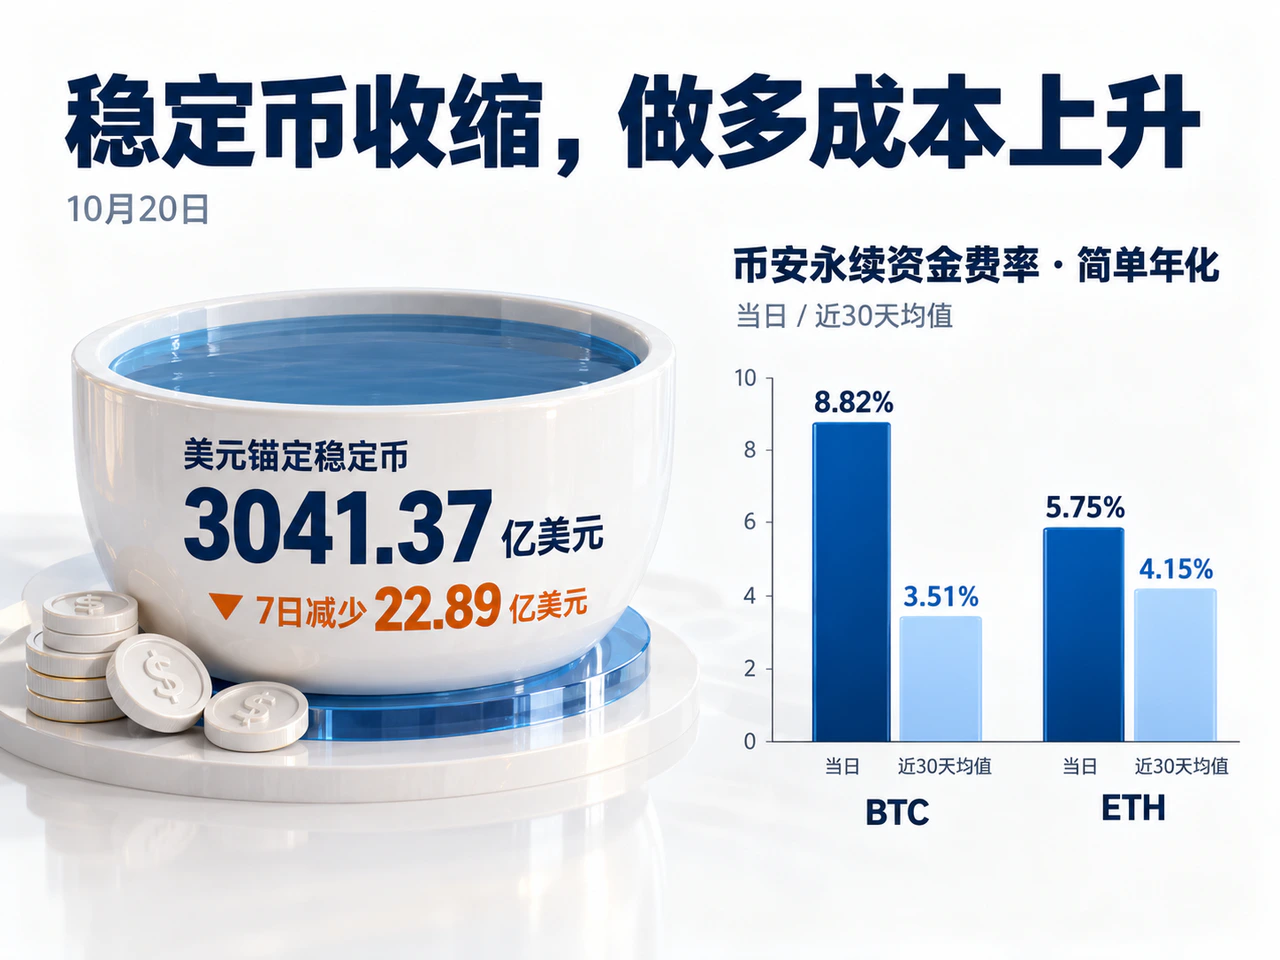
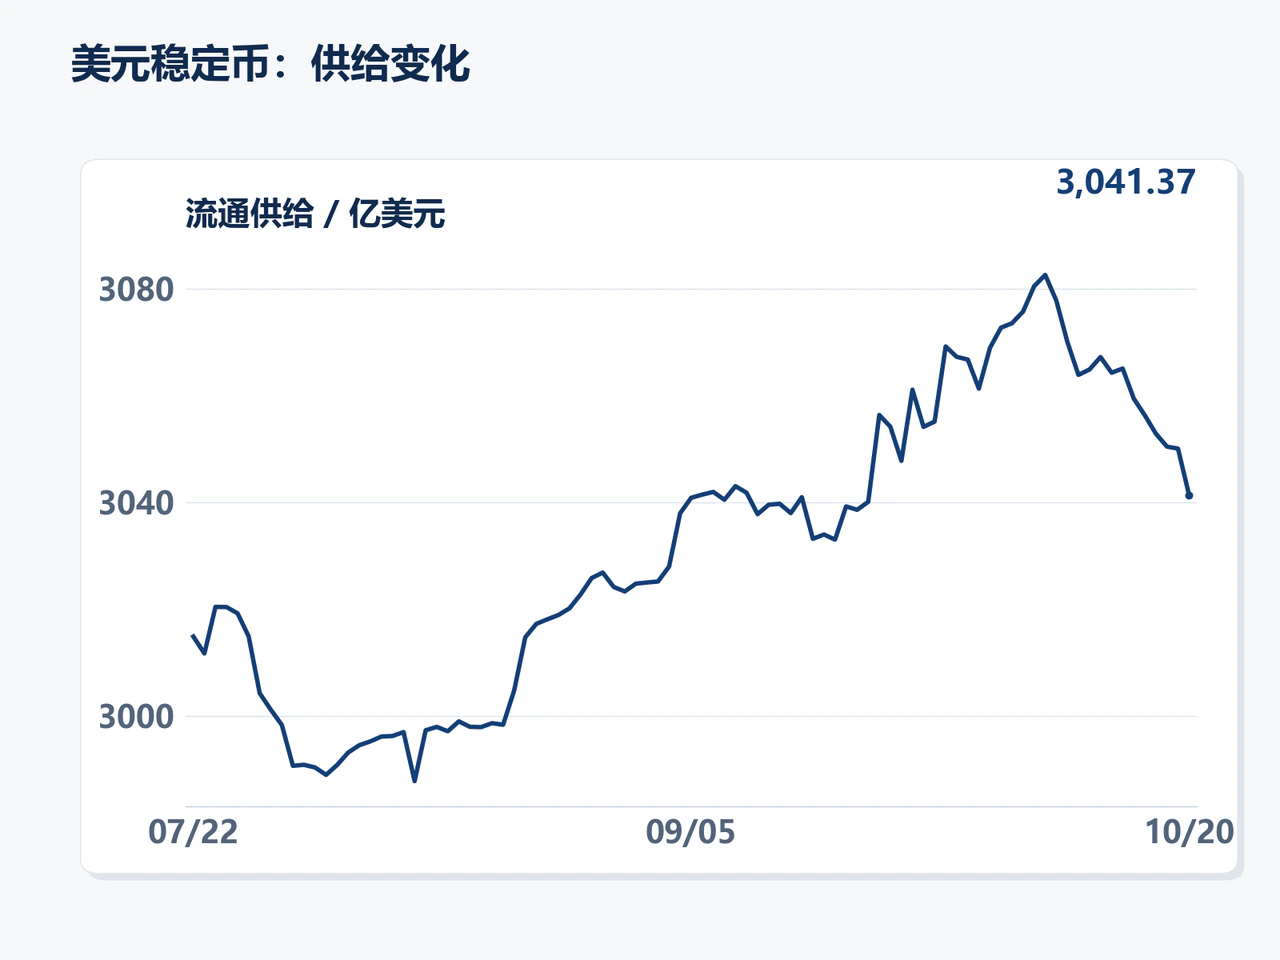
Underlying liquidity has not expanded in step with the price recovery. DefiLlama put the total circulating supply of dollar-pegged stablecoins at approximately $304.137 billion on October 20, down $867 million from the previous day and $2.289 billion, or 0.75%, from seven days earlier. It was only $280 million, or roughly 0.09%, higher than 30 days earlier. Stablecoin supply has been essentially stagnant over the past month and has contracted in the latest week, leaving liquidity conditions short of those needed for broad-based inflows of new capital.
Spot ETFs provide a regulated allocation channel outside crypto trading venues, while stablecoins fund trading settlement and lending collateral within the market. Concentrated Bitcoin ETF purchases can directly improve marginal demand for that asset. But the relatively tight stock of stablecoins available on trading platforms and on-chain means a recovery in Bitcoin allocations is unlikely to translate into easier liquidity across the entire crypto market in the near term.
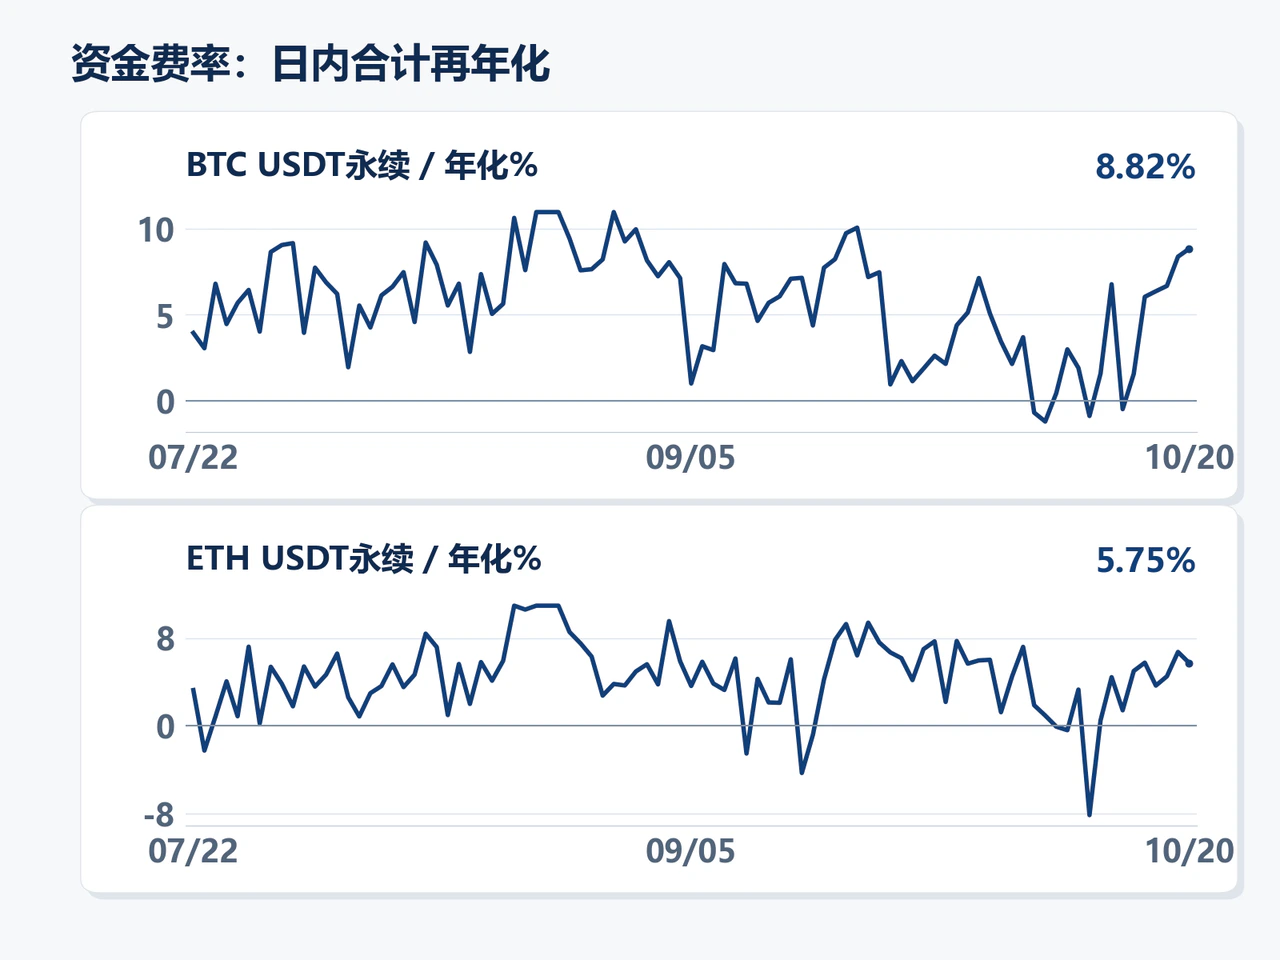
Derivatives markets were quicker to show a greater willingness to go long. The three Binance BTCUSDT perpetual funding settlements at 00:00, 08:00 and 16:00 UTC on October 20 were 0.009208%, 0.007102% and 0.007856%, respectively. Their daily sum was approximately 0.0242%, equivalent to a simple annualized rate of about 8.82%, well above the 30-day average of 0.00320% per settlement, or roughly 3.51% on a simple annualized basis. The three ETHUSDT perpetual funding payments that day totaled approximately 0.0157%, or about 5.75% simple annualized, also above the 4.15% annualized equivalent of its 30-day average. Persistently positive and widening funding rates indicate that aggressive demand to go long is raising the cost of holding long positions.
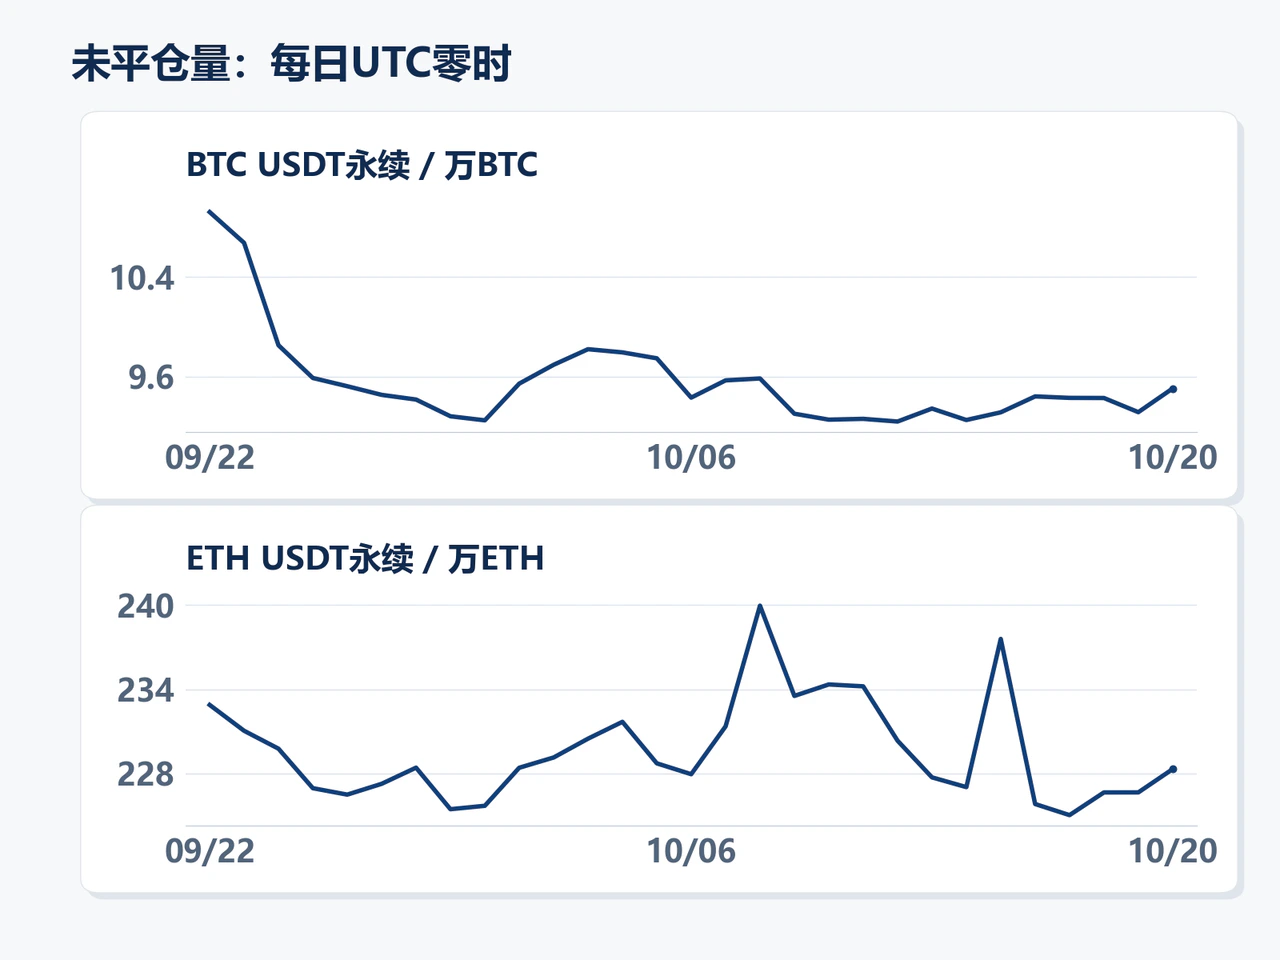
Open interest also recovered when measured in coins, removing the increase in dollar notional caused by higher prices. Binance daily snapshots show that at 00:00 UTC on October 20, BTCUSDT open interest was approximately 95,000 BTC, up 2.05% from the previous day, while ETHUSDT open interest was about 2.2832 million ETH, up 0.73%. Rising open interest alongside higher positive funding rates suggests that long investors are willing to pay a greater premium to expand exposure.
The broader derivatives market nevertheless retained defensive positions. Bitfinex's report for the preceding week showed that during October 12–15, Bitcoin-denominated futures open interest across 22 exchanges rose 4.3% despite weaker spot prices. The closely watched October 30 options expiry had approximately $12.4 billion in notional open interest, with strong demand for puts at strikes of $70,000–$75,000. The coexistence of rebuilding futures longs and options protection against tail risk shows that participants were paying to hedge potential drawdowns even as they sought to benefit from a rebound.
The defining features of the crypto market are therefore concentrated allocations to Bitcoin ETFs and an early rise in the cost of derivatives longs, without a corresponding expansion in underlying stablecoin supply. If subsequent spot buying remains confined to a handful of channels while leverage continues to accumulate, prices will remain highly sensitive to capital withdrawals and collateral volatility. Broader ETF net inflows across more products and renewed net growth in stablecoin supply are needed to provide a stronger capital base for this rebound.
Click Read Original for full details.