A retreat in international oil prices from intraday highs and a recovery in U.S. equities eased the cross-asset selling pressure that crypto markets had faced during Asian trading. On Binance's UTC spot daily candles, which closed at 8 a.m. Beijing time on October 21, Bitcoin regained 83,000 USDT, Ether rebounded on increased turnover, and most liquid major tokens finished higher. Yet a broad one-day advance did not reverse the past month's divergence, in which Bitcoin outperformed other major assets. J.P. Morgan Asset Management included Bitcoin in its long-term capital market return forecasts for the first time, but its risk assumptions and recent ETF flows both show that institutional allocations remain highly concentrated and cautious.
Falling oil and recovering U.S. stocks lift major tokens; Ether rebounds on higher turnover but still trails Bitcoin over the month

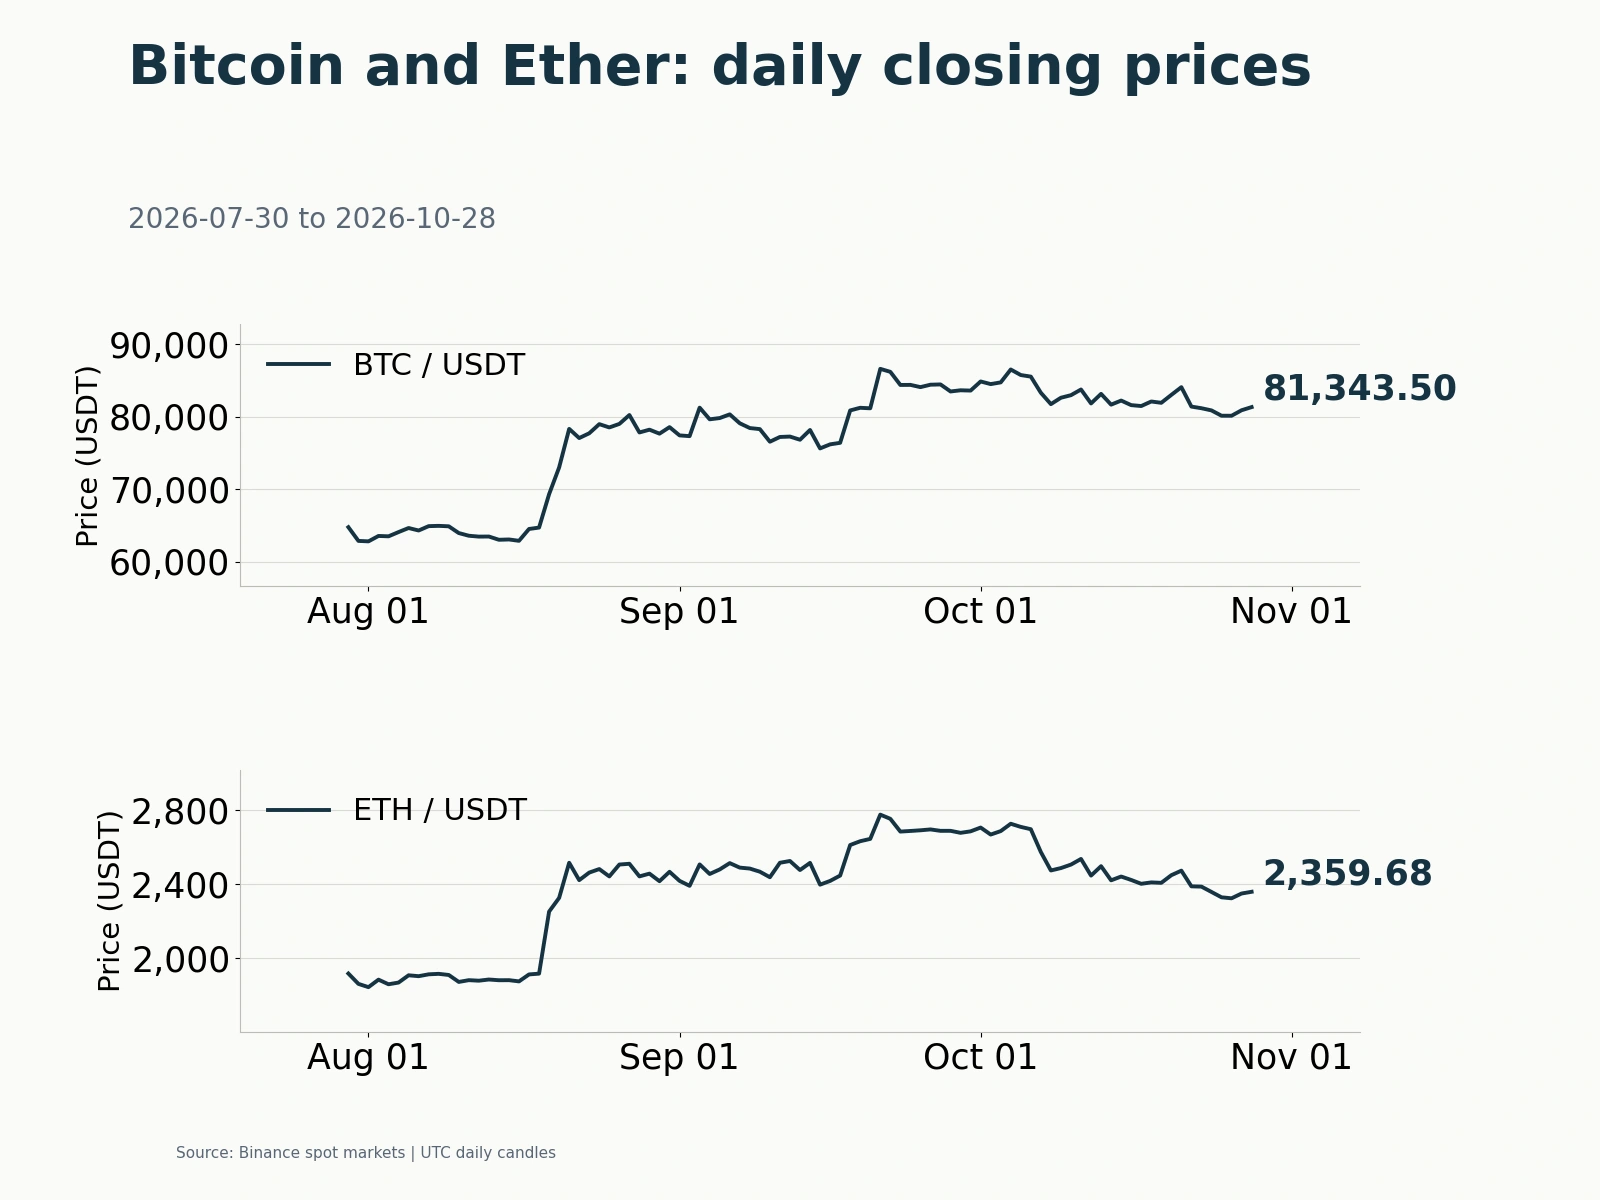
At the daily close at 8 a.m. Beijing time on October 21, Binance spot BTC/USDT stood at 83,028.15 USDT, up 1.33% from the previous day, after trading between 81,200 and 83,439 USDT. ETH/USDT closed at 2,449.20 USDT, up 1.71%, within an intraday range of 2,372.62–2,478 USDT. Both recovered substantially from their daily lows and retained most of their gains at the close.
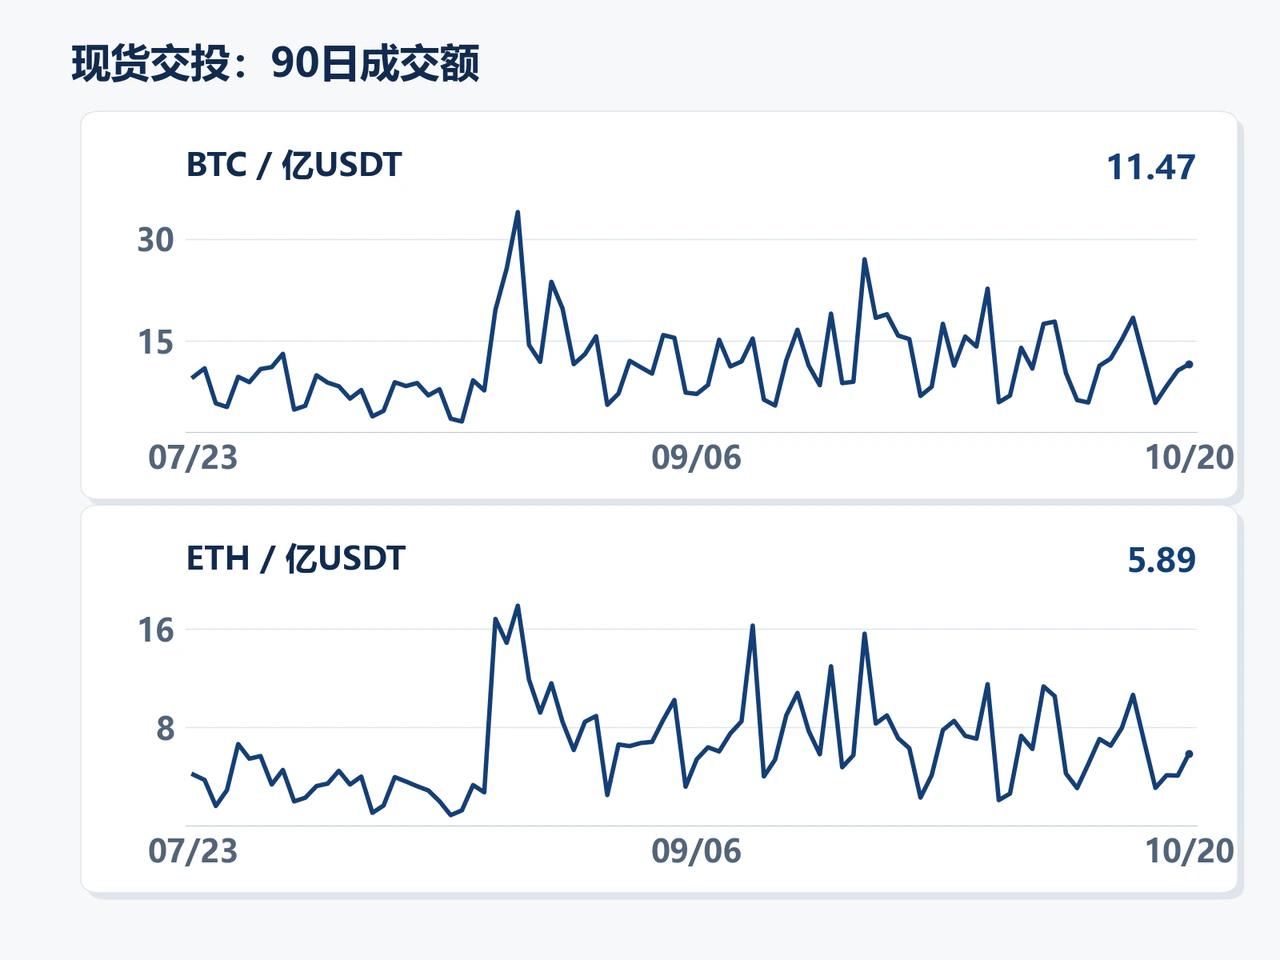
Major spot assets beyond Bitcoin and Ether also generally advanced. Seven of the eight liquid tokens BTC, ETH, BNB, SOL, XRP, DOGE, ADA and TRX closed higher: ADA gained 2.71%, DOGE 2.66%, XRP 2.43%, and SOL and BNB rose 1.39% and 1.31%, respectively. Only TRX slipped, by 0.24%. Binance BTC/USDT turnover reached 1.147 billion USDT, up 8.83% from the previous day; ETH/USDT turnover increased 43.32% to 589 million USDT. Ether's rebound therefore came with a more pronounced recovery in trading activity.
The intraday turning points closely followed traditional financial markets. Early in the session, concerns about the outlook for artificial-intelligence capital expenditure weighed on Asian chip stocks. According to CoinDesk, South Korea's KOSPI fell 3.73% that day. Cross-asset risk aversion briefly pushed Bitcoin down to about $81,400 during Asian and European trading, even after U.S. spot Bitcoin ETFs had recorded substantial net inflows.
During U.S. trading, rumors of diplomatic progress in the Middle East triggered a sharp drop in crude from its highs. U.S. equities recovered from a weak opening, helping Bitcoin rebound to around $83,000. Although the reports were subsequently denied, oil recovered some losses and Bitcoin briefly retreated to about $82,300, the daily close ultimately returned above 83,000 USDT. CNBC reported that December Brent futures fell from an intraday high of $111.99 to settle at $108.79, down 0.7% on the day. The November WTI contract, which expired that day, settled at $101.79, while December settled at $98.28, a spread of more than $3.5 between the two maturities. Oil's retreat eased fears that energy costs would lift inflation and interest-rate expectations, allowing previously pressured risk assets to recover. Crypto's repeated intraday swings with Middle East headlines and oil also showed that short-term trading remained highly sensitive to geopolitical energy shocks.
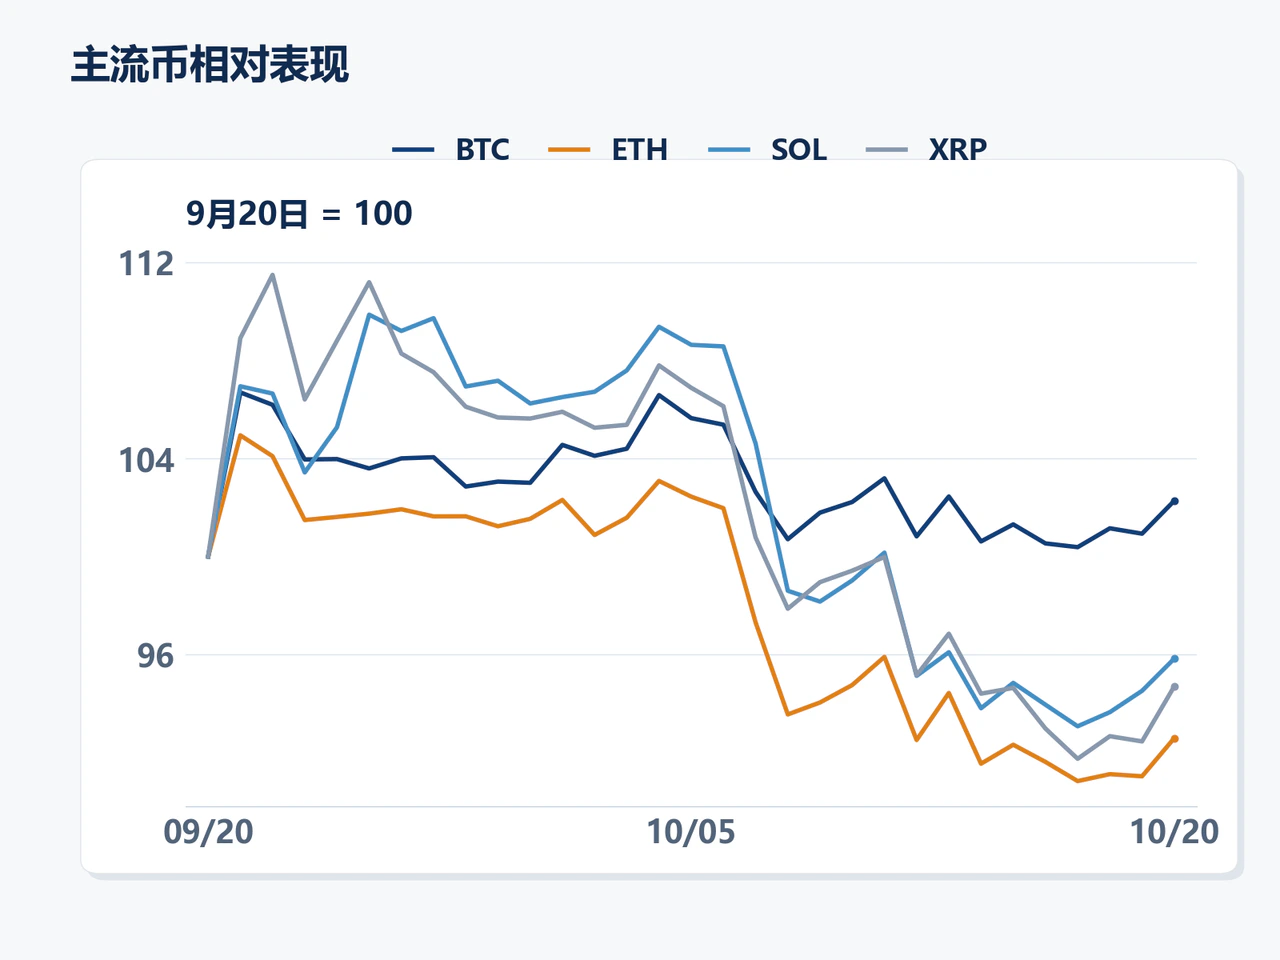
Over a longer horizon, the one-day rebound still sits within marked medium-term divergence. Based on Binance spot closing prices from September 20 to October 20, Bitcoin gained 2.28% over the past 30 days, while Ether lost 7.41%; SOL and XRP declined 4.16% and 5.30%, respectively. The closing ETH/BTC ratio was about 0.02950, down 9.47% from 30 days earlier. Ether slightly outperformed Bitcoin that day, but recovered only a small part of its relative losses over the past month. The broad short-term advance has not changed the medium-term preference for Bitcoin.
J.P. Morgan Asset Management's first 10% long-term annualized Bitcoin return forecast highlights allocation hurdles amid disagreement on risk assumptions and concentrated ETF flows

Recent institutional allocation developments likewise underscore traditional investors' caution. J.P. Morgan Asset Management's 2027 Long-Term Capital Market Assumptions, released on October 19, attracted widespread market attention on October 20. CoinDesk and The Block reported that the firm assigned Bitcoin a long-term return forecast range for the first time: annualized returns of 10% in the base case, -9.7% in the bearish case and 17% in the bullish case, alongside an assumed annualized volatility of 55%. A mainstream asset manager's inclusion of Bitcoin in a quantitative framework comparable with traditional assets marks a shift in institutional discussion from whether to accept the asset to how to calibrate returns, risk and portfolio weights.
Despite forecasting a double-digit base-case return, J.P. Morgan Asset Management remained reserved about actual portfolio allocations. Its official document explicitly stated that Bitcoin had not yet been included in its main covariance matrix because of its high volatility and still-unstable correlations with traditional assets. Institutional portfolio management weighs expected returns against risk budgets and diversification benefits; unstable correlations remain a major obstacle to broad adoption in traditional portfolios.
The crypto asset-management industry offered a different assessment of those risk assumptions. The Block cited comments on X by Bitwise Chief Investment Officer Matt Hougan, who welcomed J.P. Morgan Asset Management's long-term return forecast but argued that its 55% volatility assumption was clearly too high and failed to reflect adequately the broad decline in Bitcoin volatility over the past 15 years. This disagreement directly affects the ceiling on future institutional allocations. If Bitcoin volatility continues to converge as the market matures, an expected annualized return of 10% could support a higher portfolio weight. Conversely, if Bitcoin remains under pressure alongside equities during macroeconomic stress, institutional risk budgets will continue to constrain its allocation.
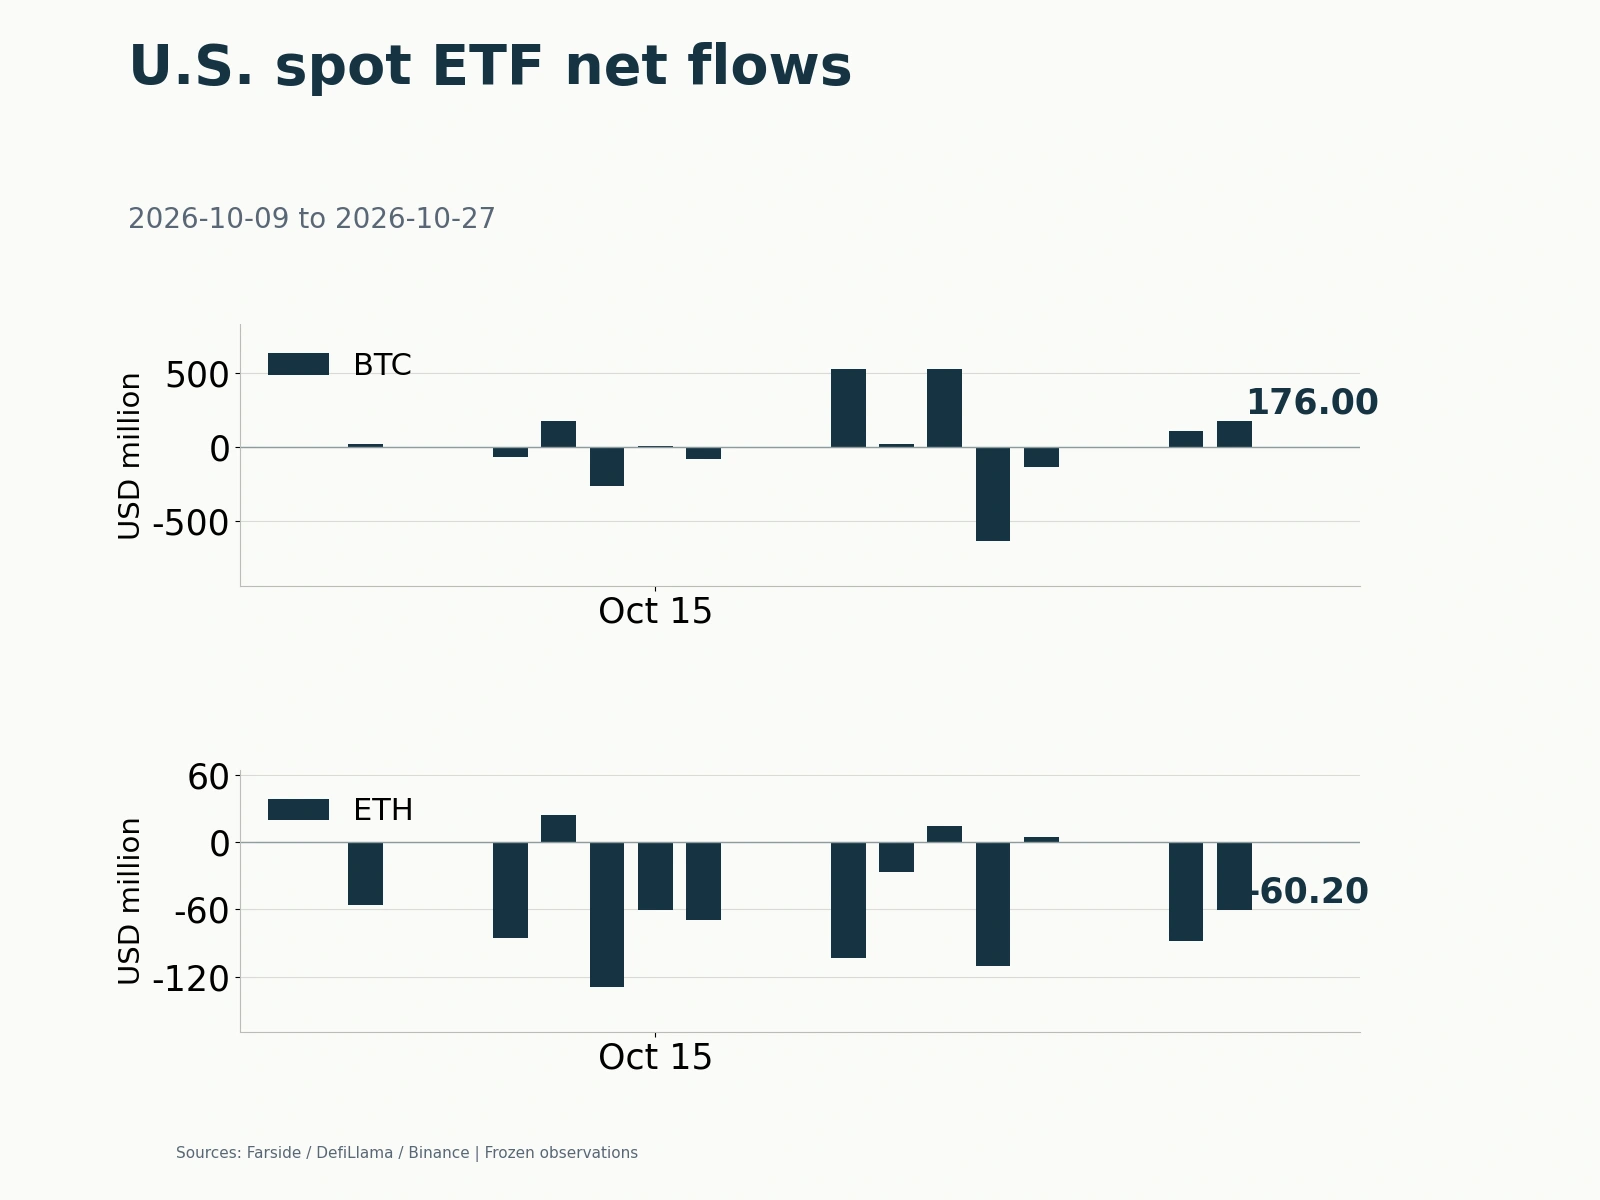
Recent fund flows also reveal selective institutional demand. On October 19, U.S. spot Bitcoin ETFs recorded approximately $527 million in net inflows. BlackRock's IBIT alone received about $665 million in a single day, while the remaining products collectively saw net outflows. U.S. spot Ether ETFs meanwhile recorded approximately $103 million in net outflows. The concentration of institutional money in Bitcoin and a single leading fund is consistent with Bitcoin's significant outperformance of Ether in the spot market over the past 30 days.
Overall, the crypto rebound on October 20 was driven mainly by falling oil and stronger U.S. equities, while medium-term relative performance and institutional preferences did not shift in tandem. Whether this recovery can develop into a firmer trend depends both on major tokens' resilience when oil and U.S. equities come under renewed pressure and on a sustained spread of incremental funds from leading Bitcoin ETFs into Ether and other major assets.
Click Read Original for the full details.