On October 20, the on-chain market showed a pronounced structural divergence: aggregate decentralized spot exchange (DEX) activity continued its recent decline, while Ethereum and some layer-2 (L2) networks recorded higher volume. Meanwhile, stablecoin payments, tokenized US Treasuries and underlying settlement infrastructure continued to expand. Competition among public blockchains and applications is shifting from simply capturing trading volume toward retaining funds, providing round-the-clock settlement and generating distributable protocol revenue.
Daily DEX volume falls to $7.183 billion as Ethereum and Base buck the decline

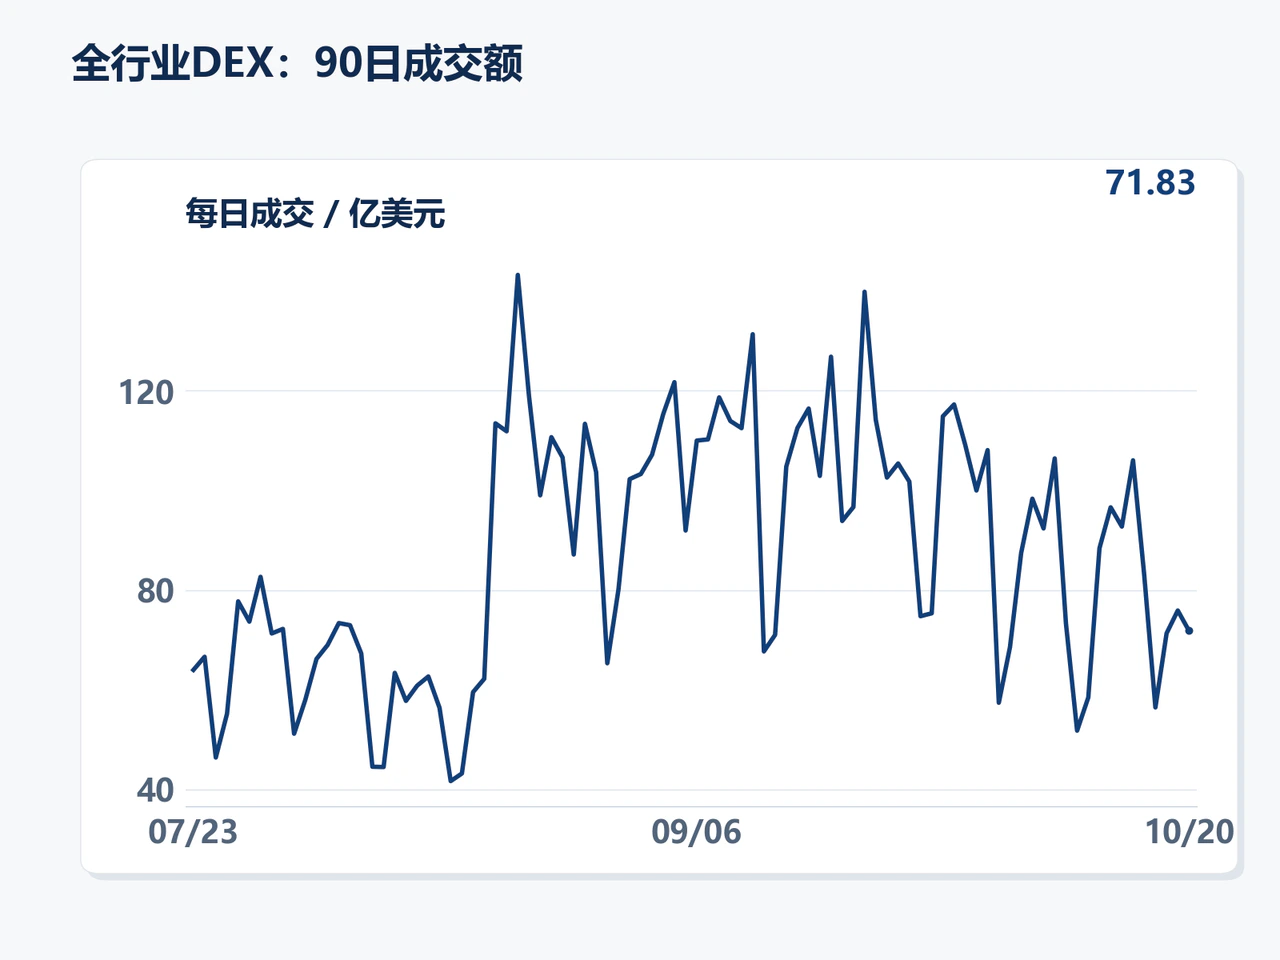
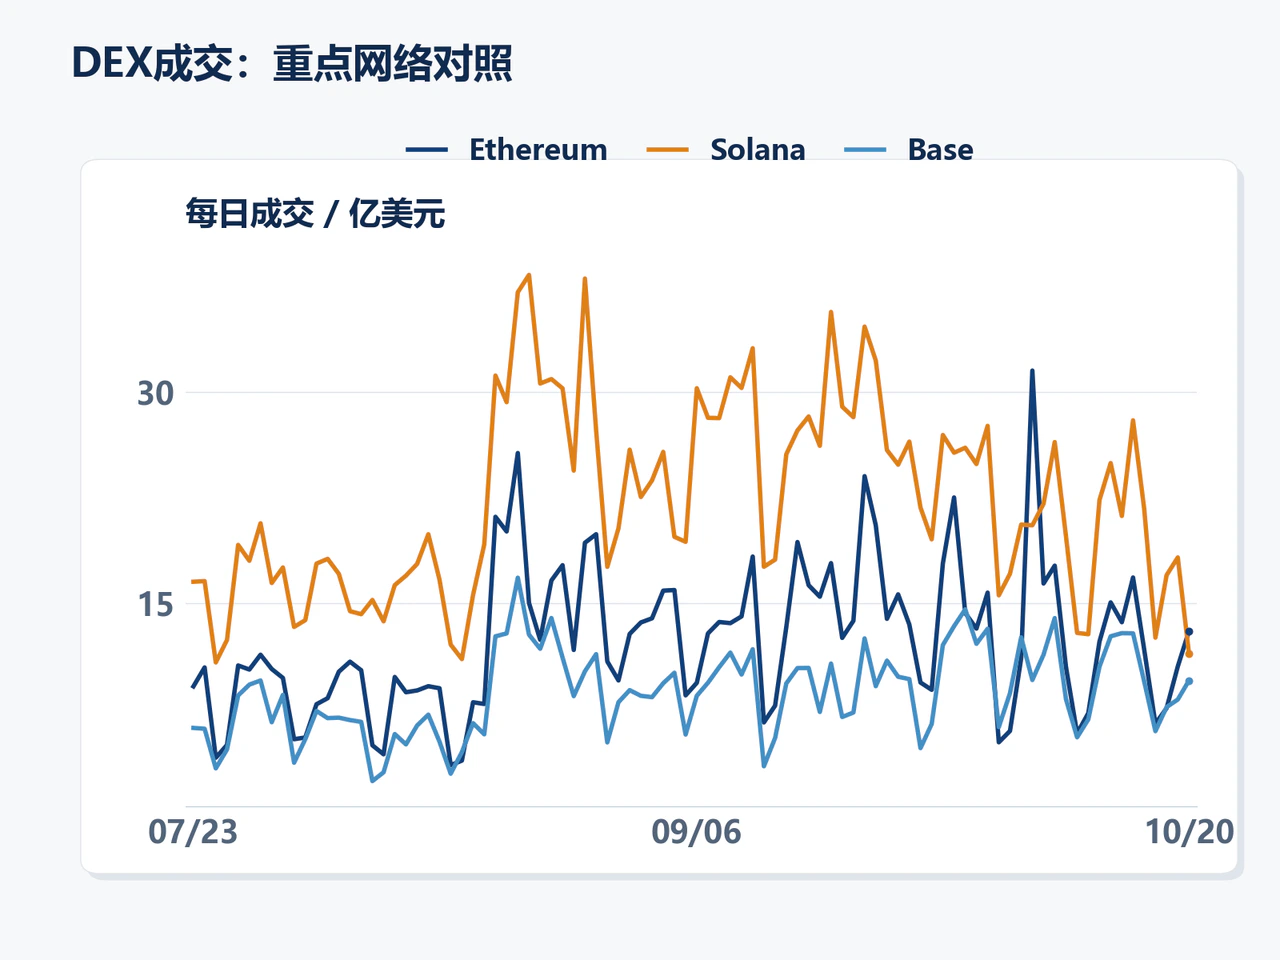
DefiLlama's UTC daily statistics show approximately $7.183 billion in decentralized spot exchange volume on October 20, down 5.35% from the preceding day and extending the recent cooling trend. The trailing 30-day daily average stood at $8.998 billion, 13.36% below the previous 30-day period's $10.385 billion.
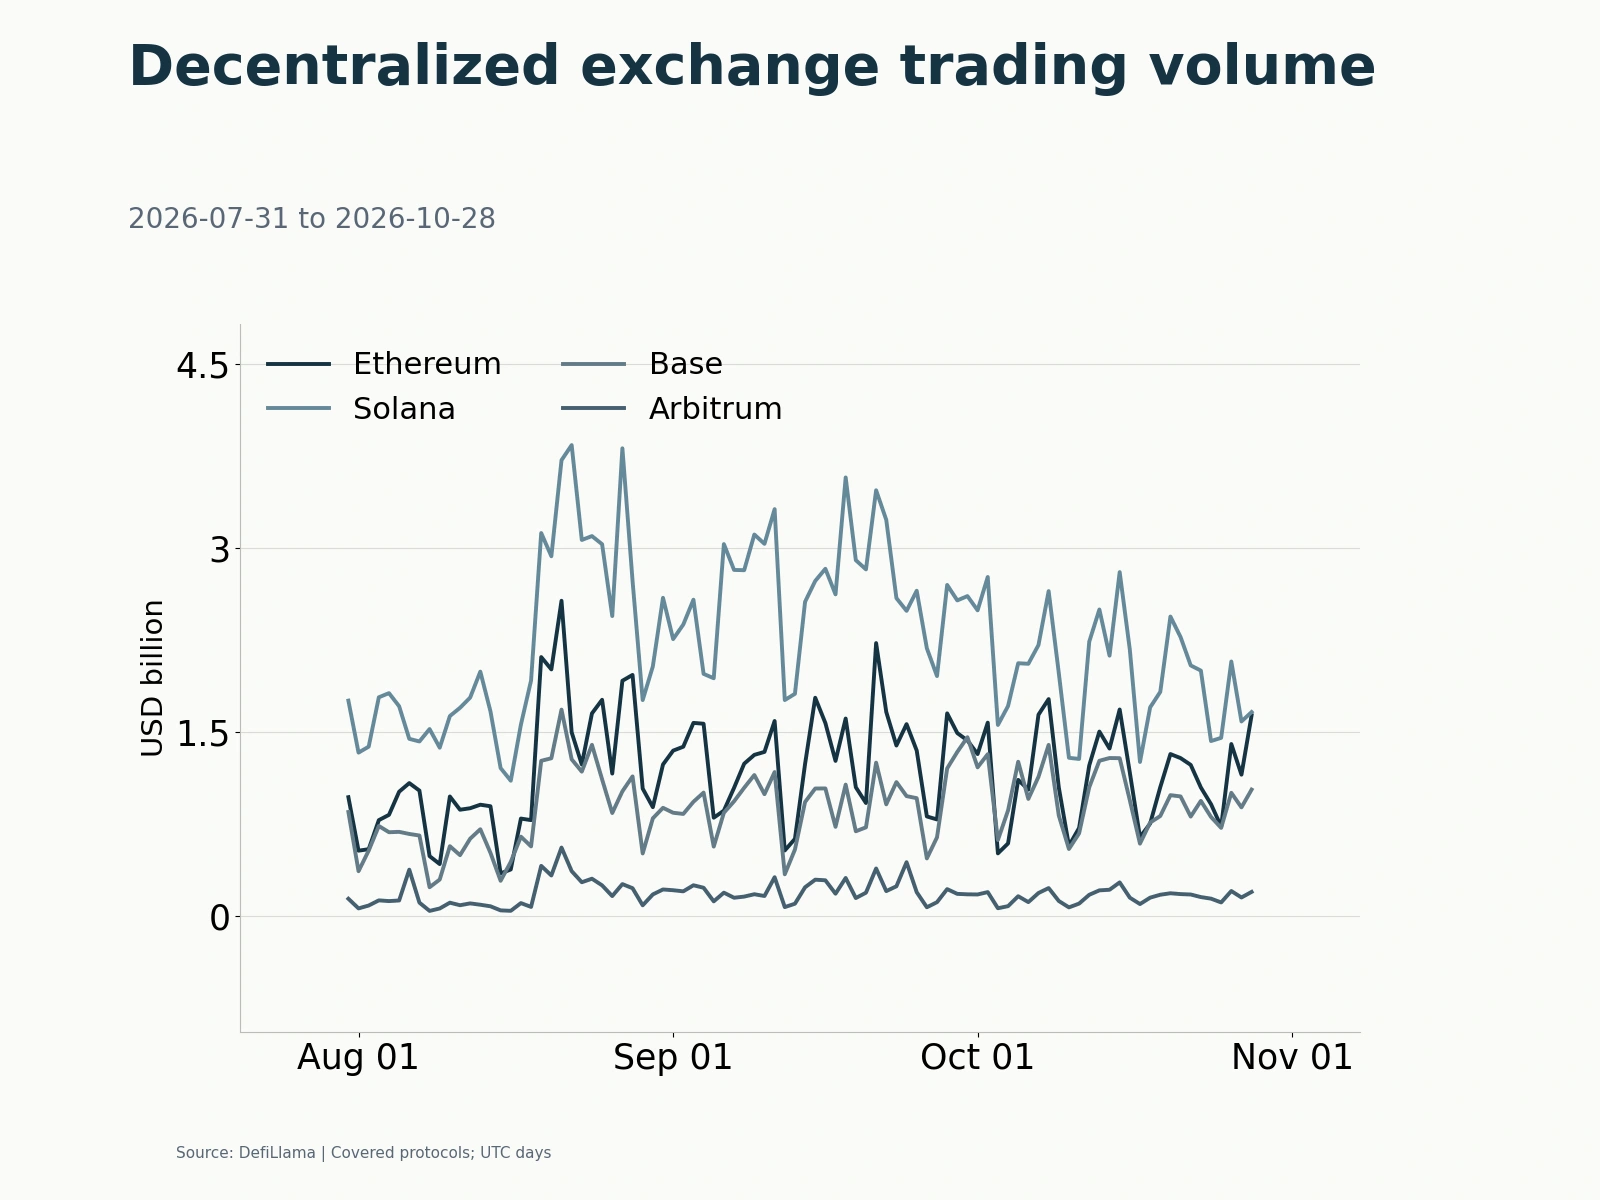
Spot trading varied widely across major blockchains and layer-2 networks. Ethereum DEX volume reached $1.299 billion that day, up 24.06% from the preceding day; Base recorded $947 million, up 16.67%; BNB Chain $1.042 billion, up 9.51%; and Arbitrum $180 million, up 5.76%. By contrast, Solana's volume fell 37.50% to $1.140 billion, making it a notably weaker network among the main sample.
A single day's offsetting changes in spot volume are insufficient to establish that the same funds migrated between chains. Monthly performance, however, reveals clearer differences in the resilience of each network's demand. Base's trailing 30-day average daily volume rose 9.03% from the preceding period, indicating more sustained growth. Despite Ethereum's sharp daily rebound, its 30-day daily average still slipped 2.56%, leaving the recent month's weakness intact. Solana's 30-day daily average declined 18.51%. Layer-2 networks also diverged: Arbitrum's 30-day average daily volume remained below the preceding period.
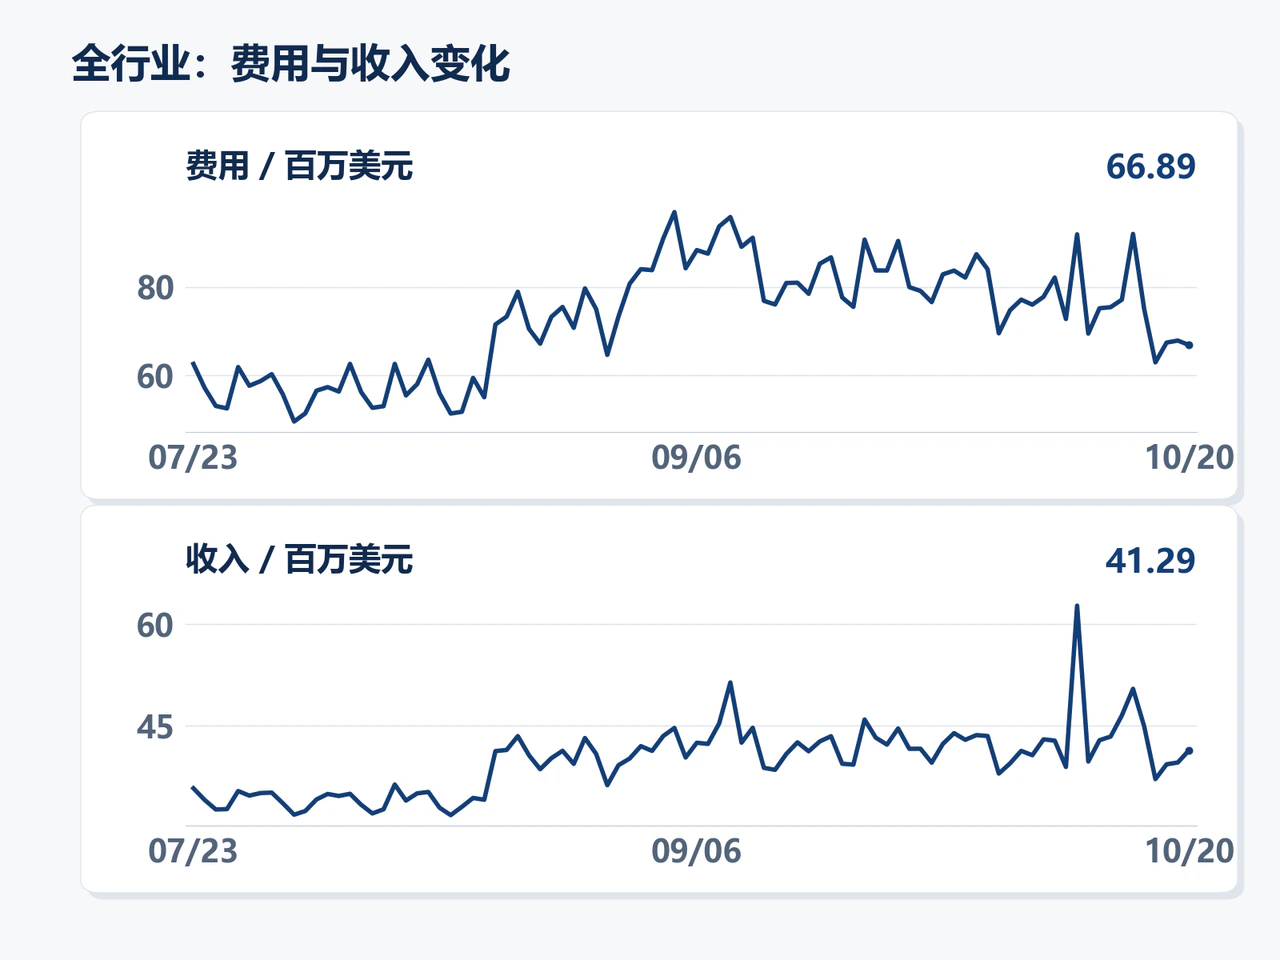
The cooling in trading did not translate into a corresponding deterioration in monetization across the industry. DefiLlama's broad measure, covering stablecoin issuers, public blockchains and applications, put total on-chain fees on October 20 at approximately $66.89 million, down just 1.49% from the preceding day. Revenue retained or distributed by protocols, before all operating costs, nevertheless rose 4.57% to $41.29 million. Its trailing 30-day daily average also increased approximately 3.24% from the prior period. Because this measure includes diverse businesses such as stablecoin issuers, the divergence between spot volume, broad fees and protocol revenue shows that different business models are producing different revenue outcomes. Trading intensity alone can no longer describe the industry's overall operating performance.
Revenue and cost constraints are also prompting smaller networks to make operational choices. Under Sophon's previously announced arrangements, users must move their on-chain assets out before November 25. The project plans to close its independent mainnet on November 30 and shift its business toward applications deployed on established networks. When an independent network cannot attract enough usage to spread underlying maintenance costs, relying on existing infrastructure can reduce the ongoing operating burden. Whether business performance materially improves ultimately depends on customer retention and revenue generation at the application layer.
Third-quarter stablecoin transfers reach $891 billion; tokenized Treasuries and settlement networks pursue monetization
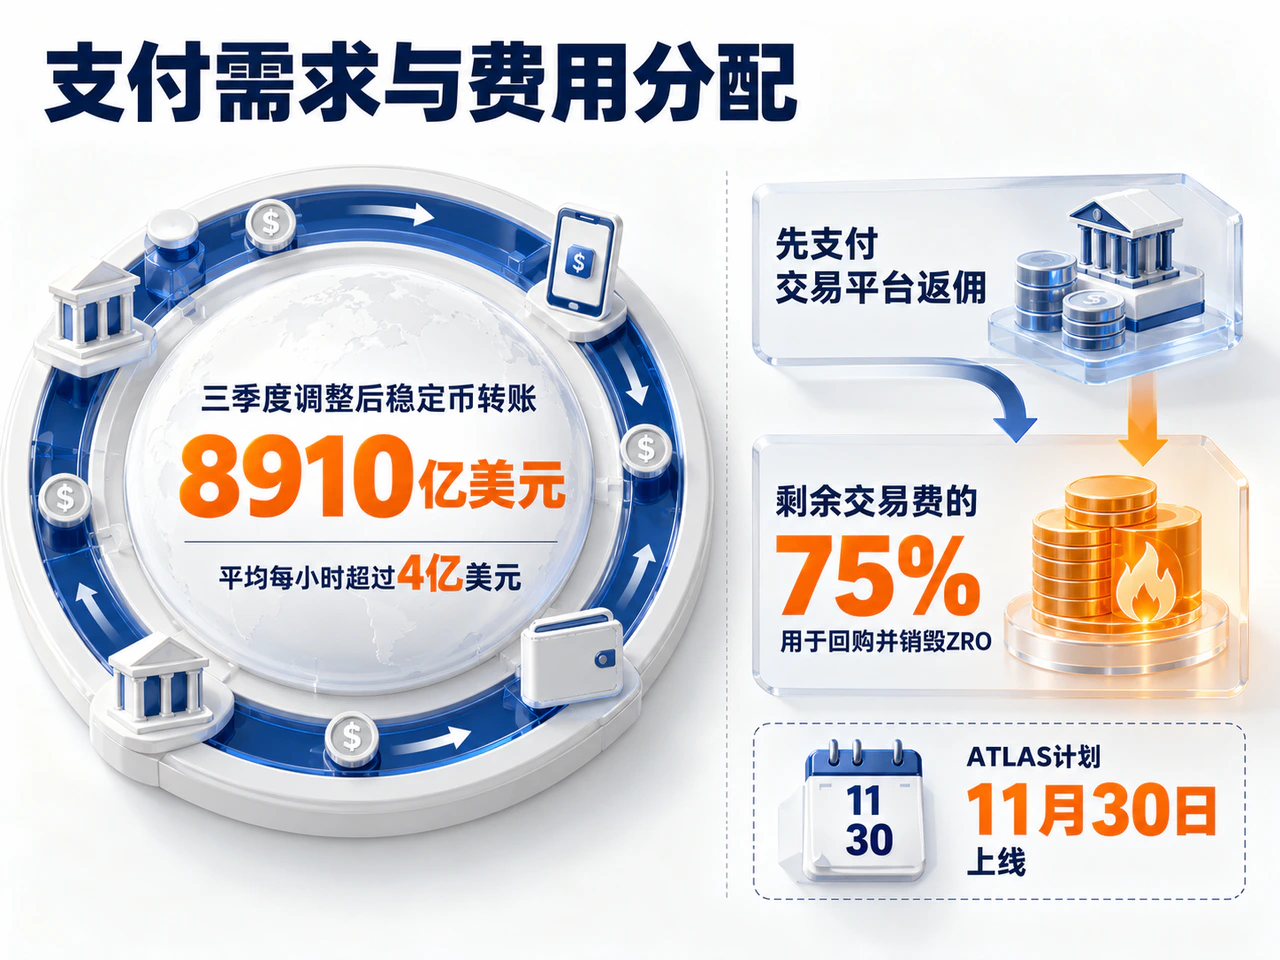
Beyond trading markets, payment and settlement demand is providing a firmer foundation for usage. Research jointly released by Coinbase and The Block on October 20 showed $891 billion in stablecoin transfers in the third quarter, averaging more than $400 million an hour. This uses Allium's adjusted measure, excluding interactions with infrastructure such as exchanges, DeFi and bridges, as well as automated trading, issuance and redemptions. It indicates that on-chain payment infrastructure has already reached substantial scale.
Another statistic in the report showed that, over the 12 months ended July 31, 73% of screened stablecoin transfer value occurred outside US banking hours. This time-of-day measure still includes automated trading and is broader than the adjusted third-quarter transfer measure above. It nevertheless reflects practical demand for round-the-clock settlement: for businesses operating across time zones, faster receipt of funds can shorten receivables turnover and reduce cash prefunded while waiting for traditional bank clearing.
On-chain payment demand is also connecting more quickly with yield-bearing assets and local fiat currencies. The joint study put tokenized US Treasuries and related money-market products at $14.7 billion at the end of September this year, up from $9.1 billion at the end of 2025. In operation, stablecoins facilitate payments while yield-bearing assets absorb temporarily idle balances; where eligible as collateral, the two can also connect financing with settlement. Meanwhile, Injective and BDACS disclosed a partnership on October 20 seeking to introduce settlement in the won stablecoin KRW1 for tokenized assets. KRW1 minting and redemption currently remain restricted to approved institutions and subject to regulatory approval.
Turning settlement scale into protocol and token returns depends on clear distribution rules. On October 20, LayerZero announced plans to launch the Zero mainnet and ATLAS trading infrastructure on November 30. Matching, clearing, settlement and risk management would be integrated in the back end, with third-party platforms providing customer-facing services. According to the official explanation, after paying rebates to trading platforms, Open ATLAS will use 75% of remaining trading fees to buy back and burn ZRO. Actual buybacks will therefore depend on both post-launch volume and fee levels, as well as the share paid as rebates to front-end channels.
This also reflects the competing economic interests in the on-chain economy. End users want faster, cheaper transfers; front-end platforms need a revenue share to cover acquisition and service costs; and underlying infrastructure providers and token holders want to capture what remains. Lower fees can expand usage, but also raise the business-volume threshold required for net revenue growth. How much value new settlement demand brings to networks and tokens will depend on retained trading activity, repeated payment usage and the revenue protocols actually retain after sharing with partners.
Click “Read Original” for the full details.