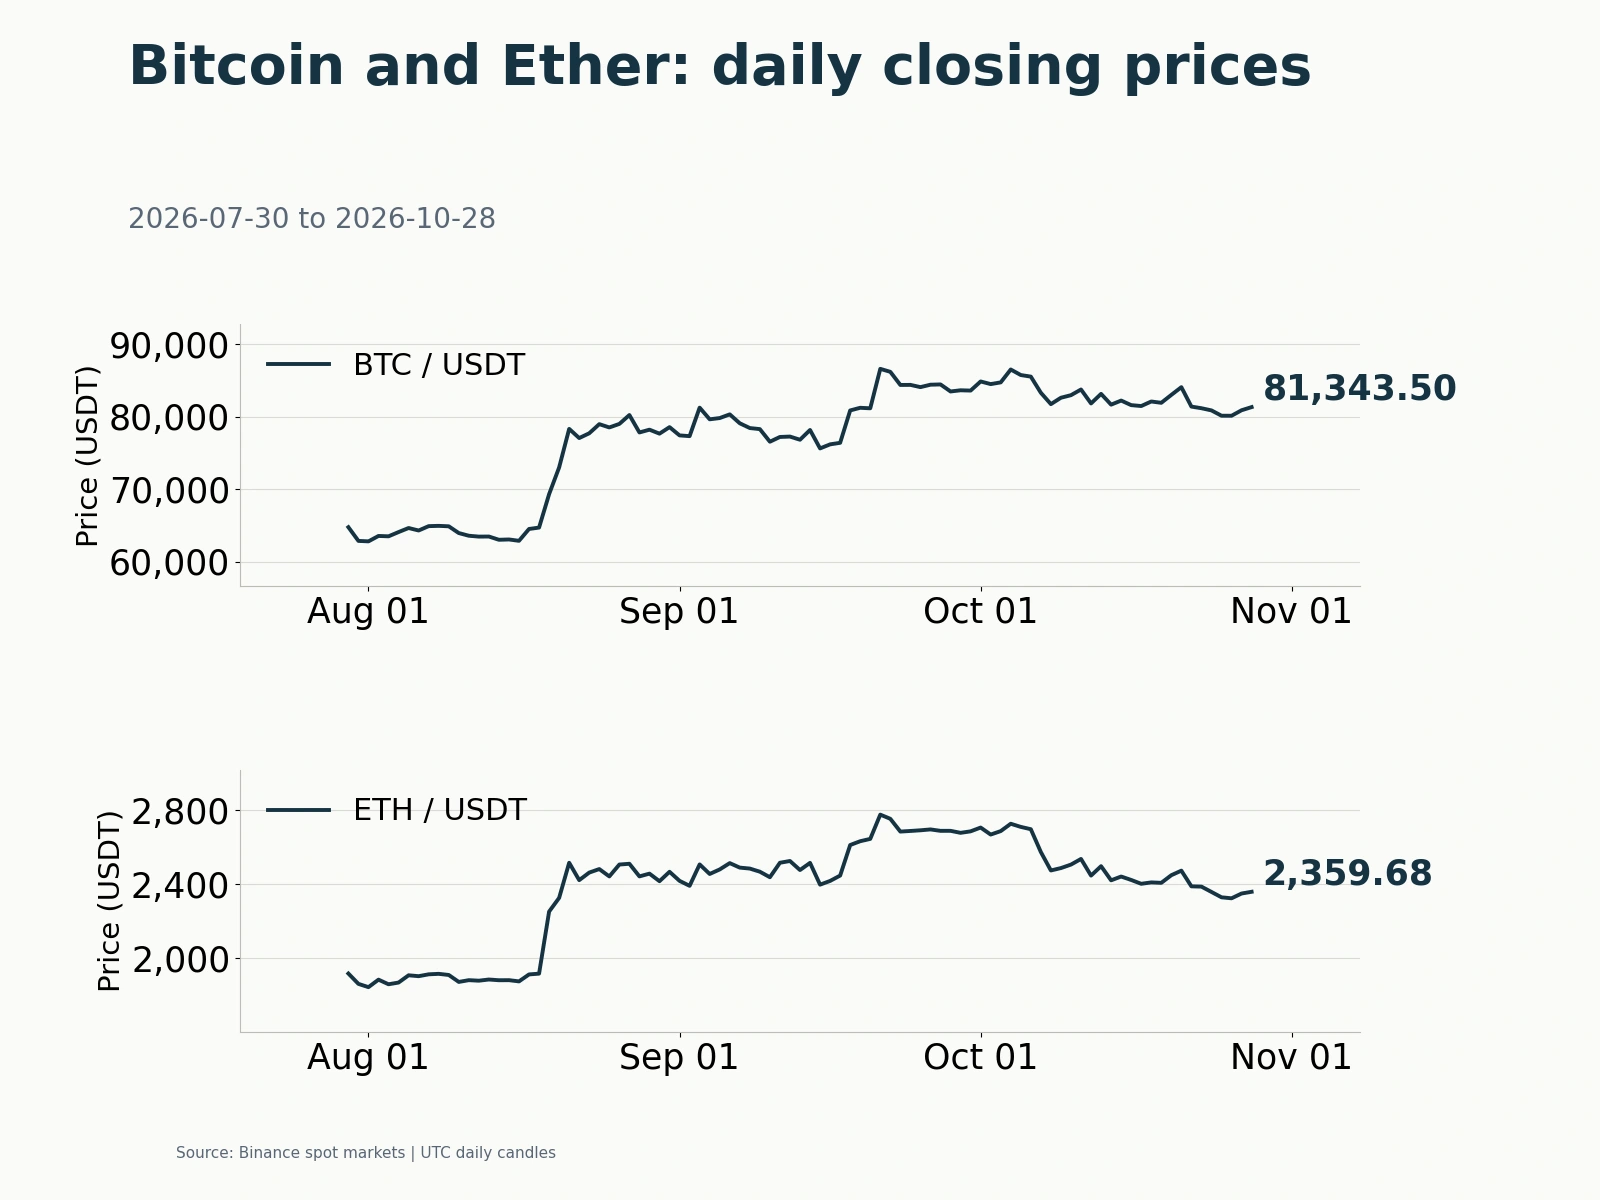
According to Binance spot UTC daily candles, Bitcoin closed on October 22 at 81,416.09 USDT, down 3.18%. Although spot Bitcoin ETFs had recorded net inflows for three consecutive U.S. trading days, concentrated long liquidations hit the derivatives market on October 22. Open interest in Binance's Bitcoin USDT perpetual contract contracted and funding rates fell close to zero. The unwinding of leveraged positions placed clear short-term pressure on Bitcoin's price.
As of the morning of October 23 Beijing time, the improvement in external fund flows remained concentrated in spot Bitcoin ETFs. Spot Ether ETFs had yet to establish a run of net inflows, while the circulating supply of dollar-pegged stablecoins remained below its level a week earlier. With fresh buying heavily dependent on a single channel, the market still had limited capacity to absorb derivatives selling.
Bitcoin ETFs attract $1.0747 billion in three days; Ether ETFs and stablecoins still contract on a weekly basis

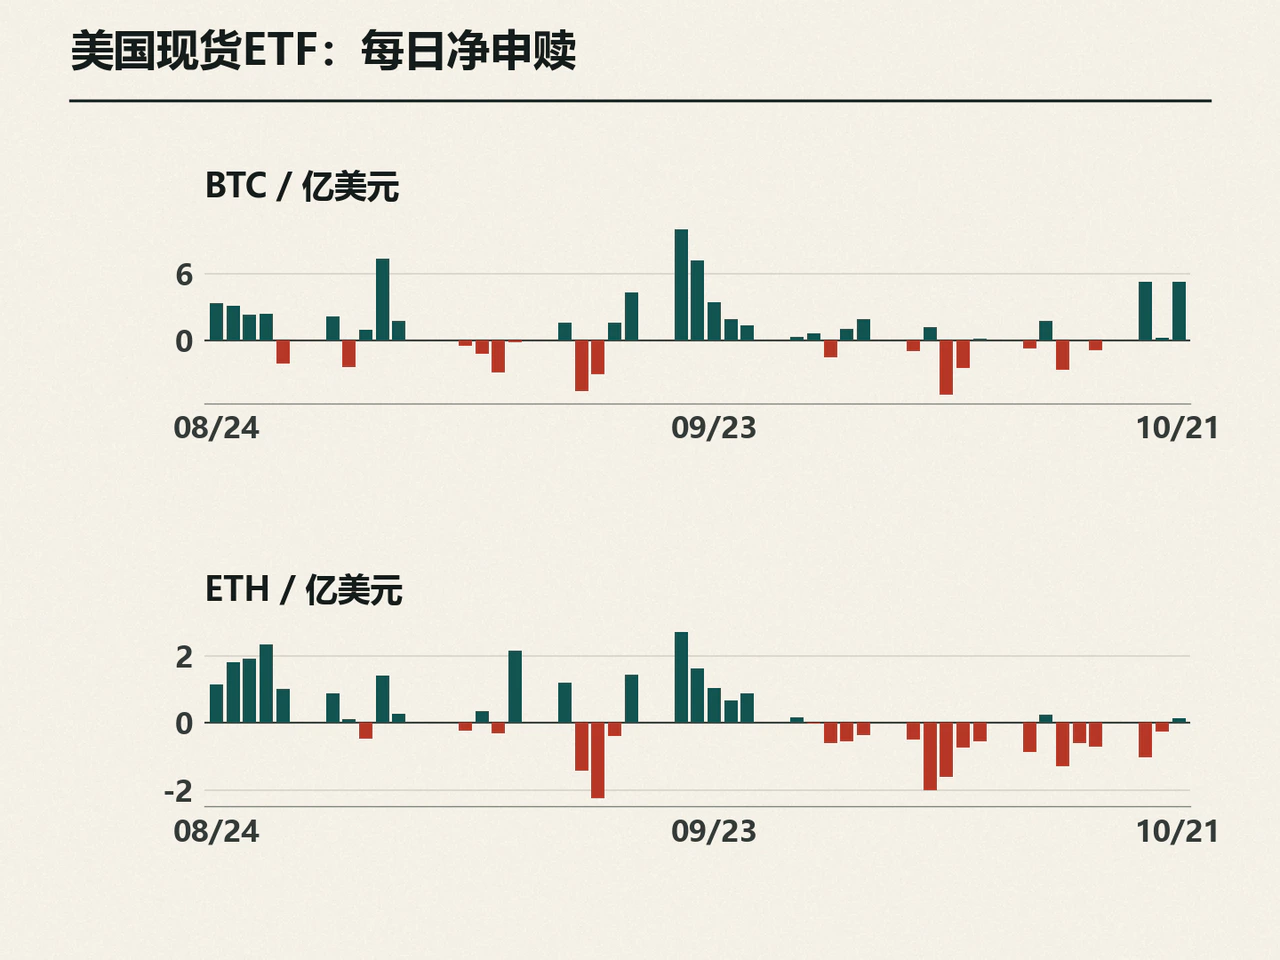
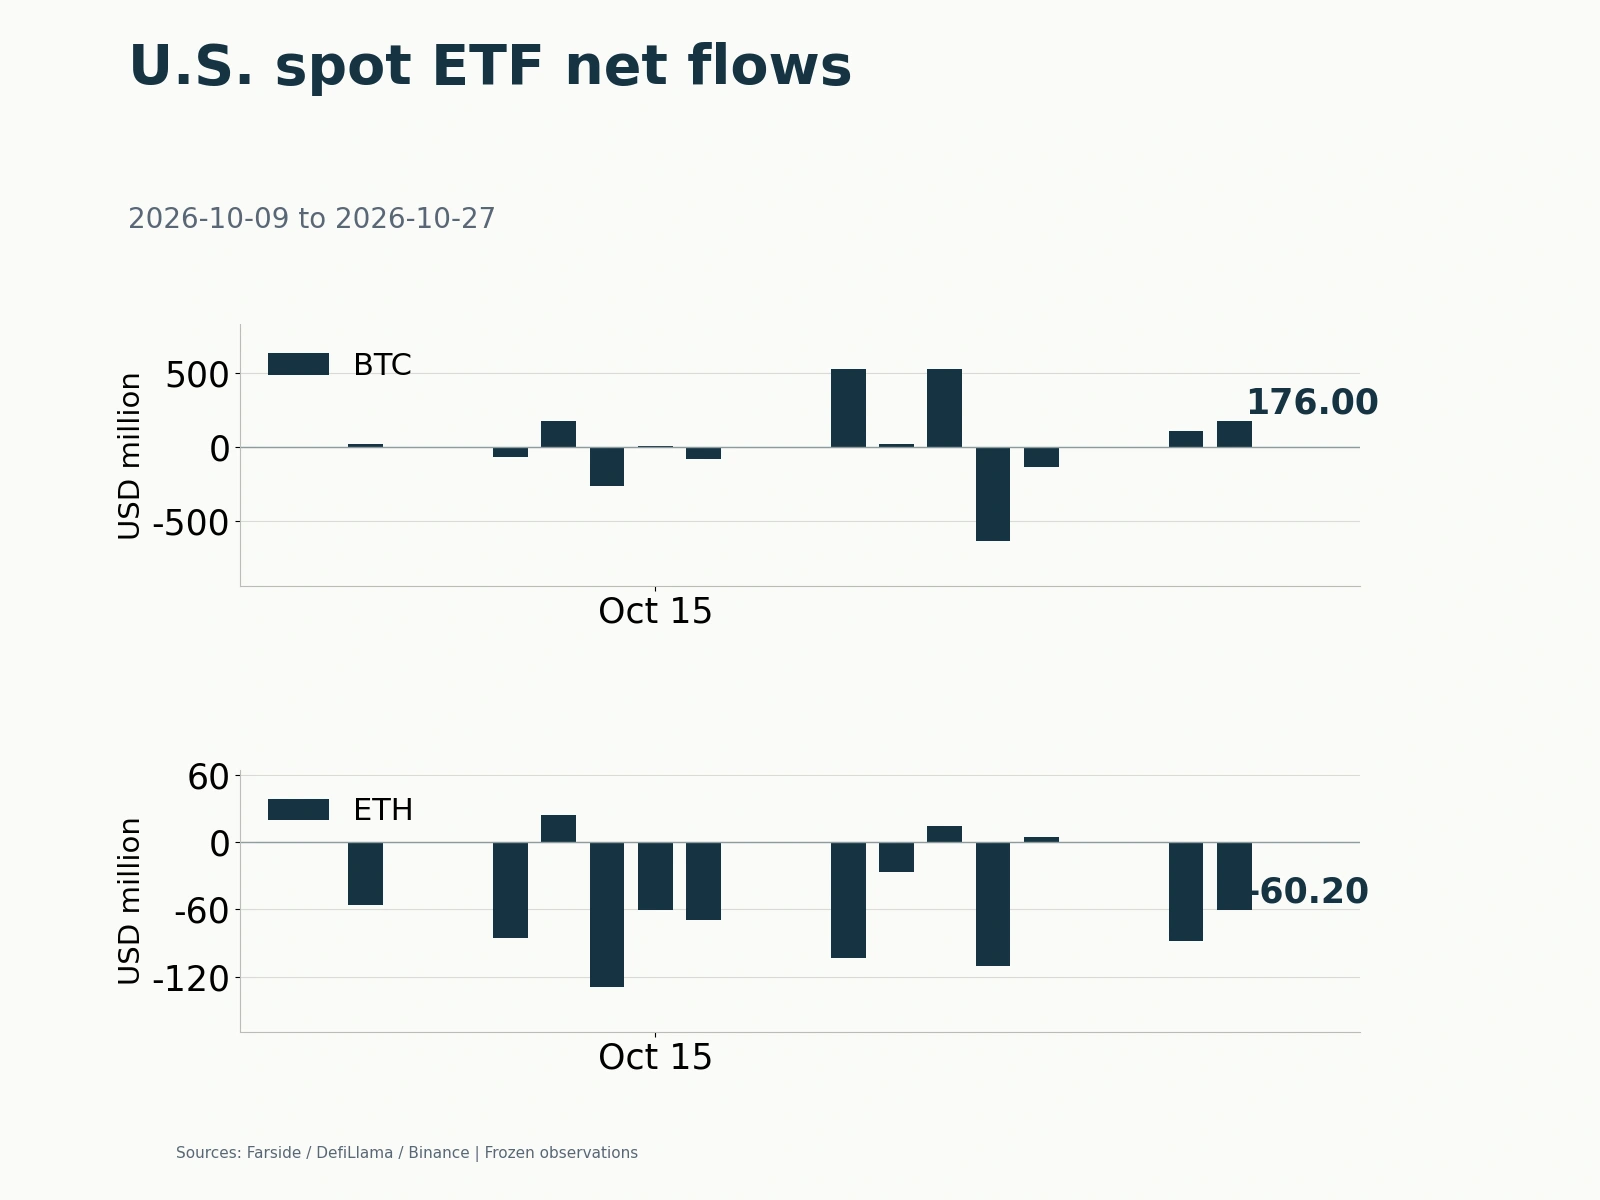
On the U.S. trading days of October 19–21, spot Bitcoin ETFs recorded net inflows of $526.7 million, $23.2 million and $524.8 million, respectively. Their combined $1.0747 billion inflow fully offset the cumulative $614.7 million net outflow from October 1–16. Leading products drove this return of capital: IBIT and FBTC took in $235.0 million and $212.7 million on October 21, together accounting for about 85% of that day's net inflows.
Spot Ether ETF flows, by contrast, remained weak. They recorded net outflows of $103.3 million and $26.1 million on October 19 and 20. Although flows turned positive by $14.9 million on October 21, the three-day total was still a net outflow of $114.5 million, following cumulative net outflows of $955.1 million from October 1–16. One modest positive day had not reversed the month's withdrawal trend. The divergence indicates that institutional capital was primarily rebuilding Bitcoin exposure, rather than raising overall risk appetite across crypto portfolios.
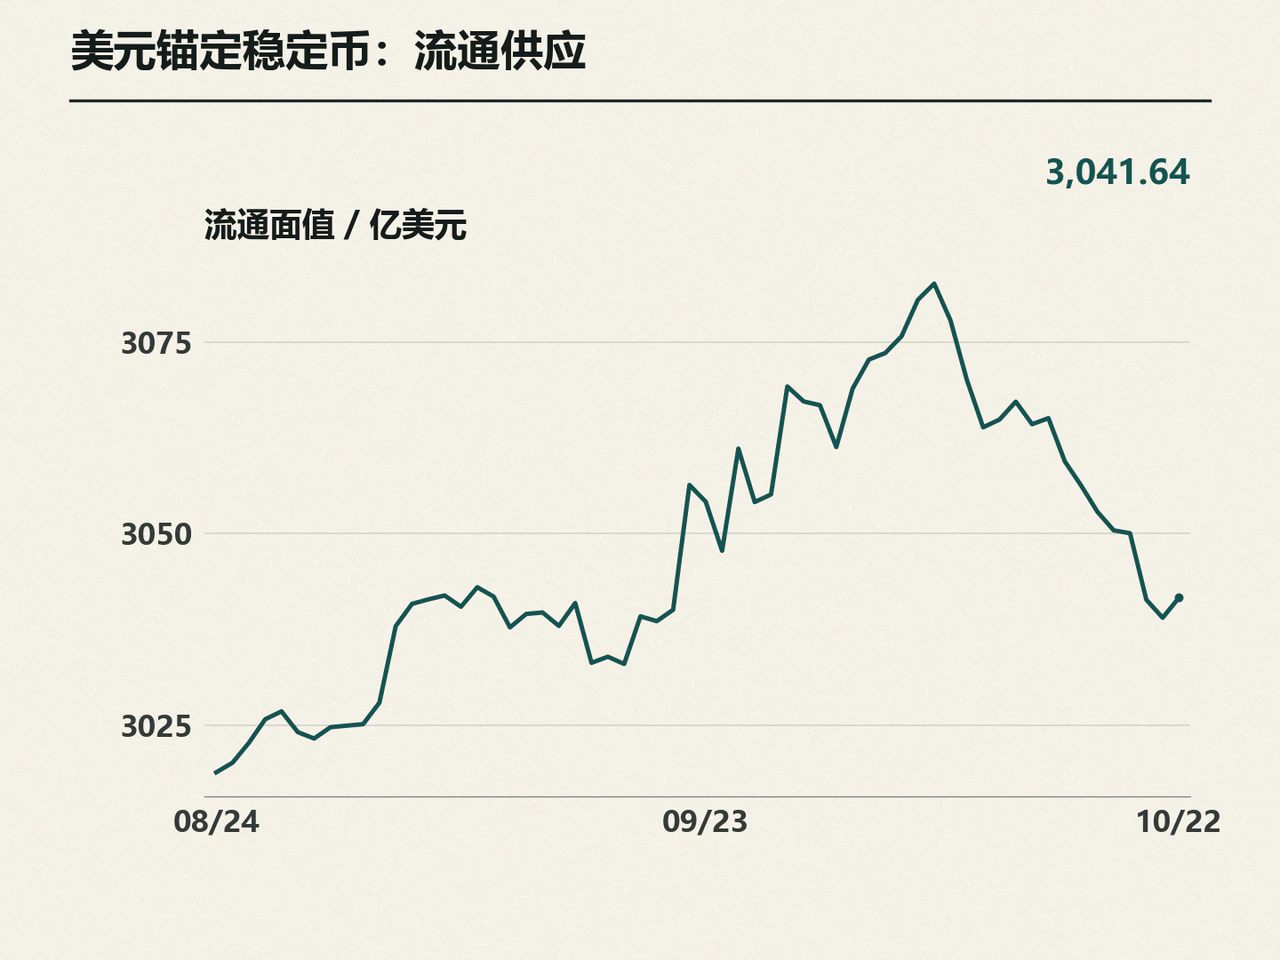
On-chain dollar liquidity also showed a small daily increase within a short- and medium-term contraction. DefiLlama's October 22 daily data put circulating dollar-pegged stablecoin supply at about $304.164 billion, up $262 million from the previous day but down $1.779 billion from seven days earlier and $1.470 billion from 30 days earlier. Stablecoins serve as trading collateral and are used for payments, lending and cash management. Changes in their stock do not directly equal spot buying, but reflect the overall size of the available on-chain dollar pool. The small daily recovery had not recouped the recent contraction, showing that on-chain funding expansion remained restrained even as external ETF allocations recovered. Only sustained growth in stablecoin supply alongside consecutive net inflows into Ether ETFs would broaden the funding improvement across markets and assets.
Binance perpetual open interest falls 2.13%; market-wide long liquidations exceed $410 million
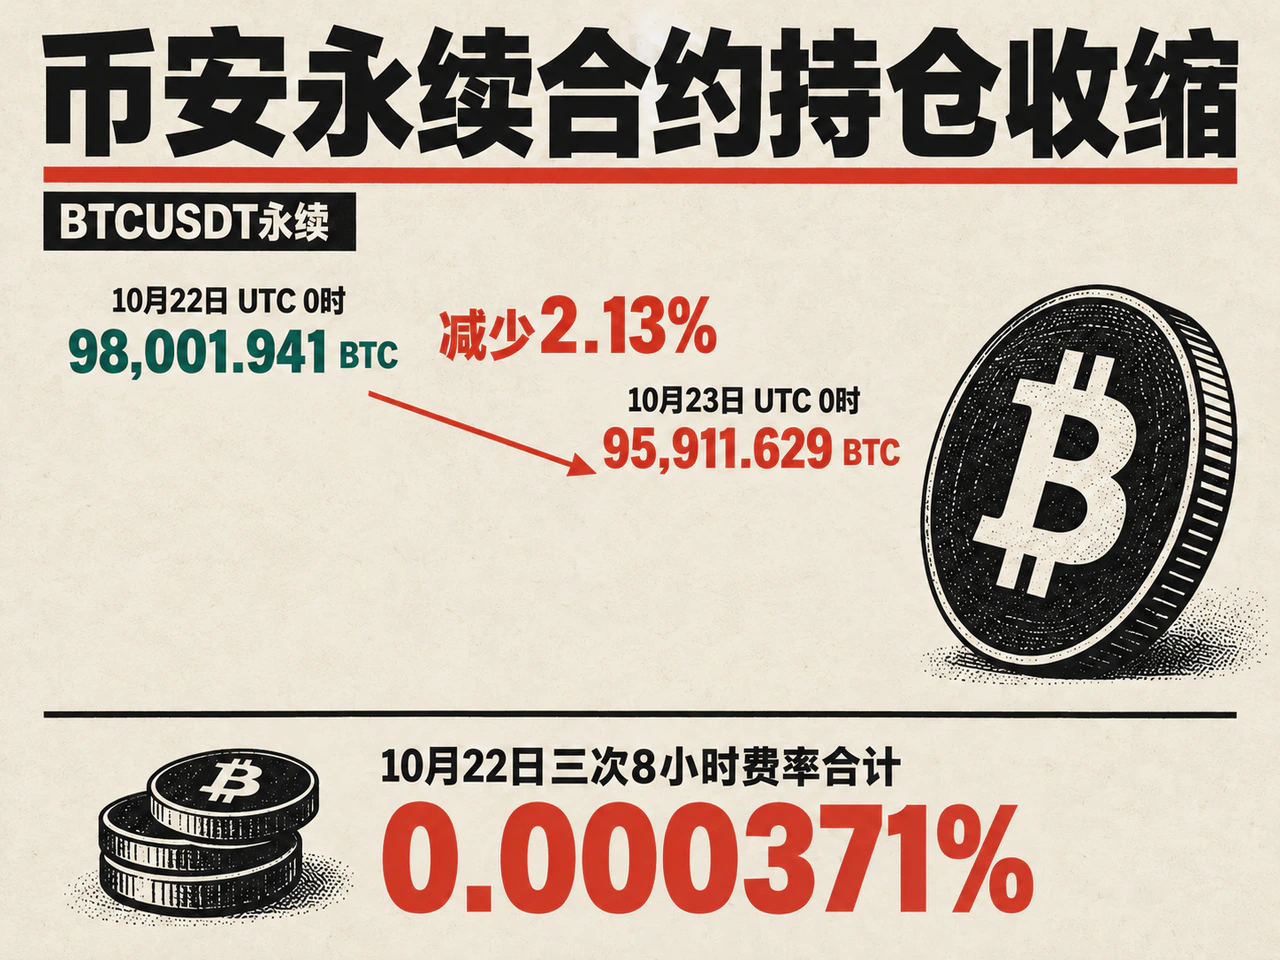
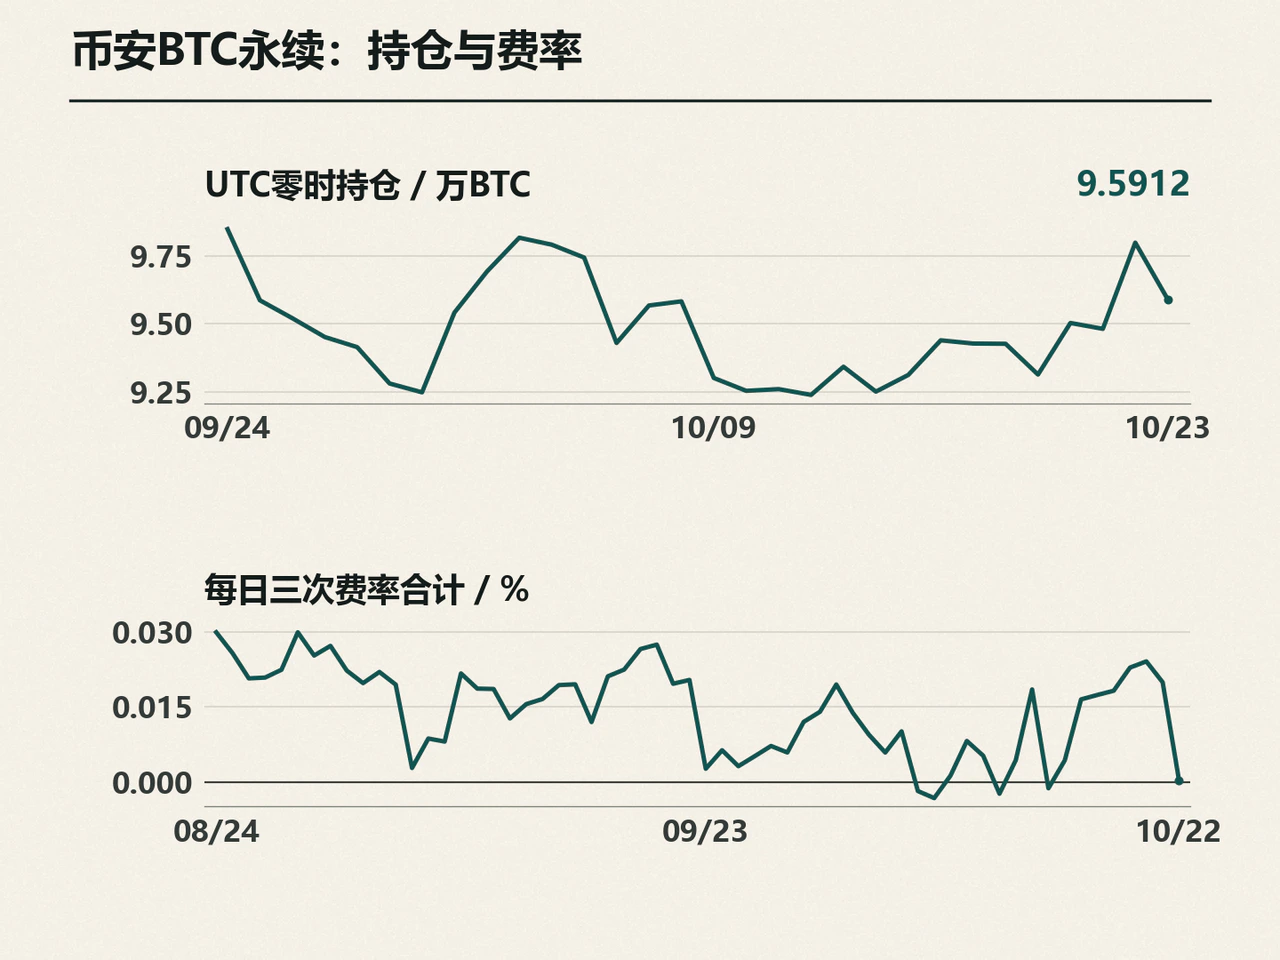
Between 00:00 UTC on October 22 and 00:00 UTC on October 23, open interest in Binance's Bitcoin USDT perpetual contract fell from 98,001.941 BTC to 95,911.629 BTC, a decline of 2.13%. Its dollar notional value dropped from $8.237 billion to $7.806 billion, down 5.24%. Even after stripping out the valuation effect of the falling Bitcoin price, open interest measured in BTC contracted materially, indicating that derivatives positions were being reduced.
Funding rates likewise confirmed cooling demand for leveraged longs. The contract's three eight-hour funding settlements on October 22 were 0.000507%, -0.001401% and 0.001265%, respectively. Funding briefly turned negative before returning to slightly positive territory; the simple daily sum was just 0.000371%, sharply below the previous day's 0.019978%. The premium paid by longs to maintain positions fell significantly. Together with declining prices and open interest, this reflected the exit of some leveraged long positions.
Liquidation data also highlighted the selling pressure borne by longs. In an October 22 report citing CoinGlass, Bitcoin.com said market-wide long liquidations exceeded $412 million in the 24 hours before publication, compared with more than $43 million in short liquidations. Bitcoin long liquidations accounted for about $135 million. Forced closures in that rolling window were heavily concentrated in longs, showing that derivatives deleveraging remained a key short-term drag after the preceding three days of ETF inflows.
The pullback followed a rebuilding of futures positions. In its October 21 research report, Bitfinex said that as of October 20, Bitcoin futures open interest across major exchanges had risen 4.2% from its October 12 low to 645,410 BTC. The contraction in Binance perpetual open interest on October 22 indicated that some of the leverage rebuilt earlier was beginning to unwind, although the extent of overall deleveraging across exchanges still required subsequent data.
Expiring options were another short-term trading variable. Bitfinex's earlier figures put the notional open interest of options expiring on October 23 at about $1.23 billion, with max pain near $82,000. The distribution of strikes reflected in max pain does not directly determine the eventual spot-market direction, but hedge adjustments around expiry can still affect local trading and volatility. Looking ahead, stabilization depends on whether spot ETF buying continues and whether derivatives open interest and funding remain moderate during price rebounds. Sustained spot demand absorbing supply, combined with restrained derivatives leverage, would support a steadier price recovery.
Click “Read the original” for full details.