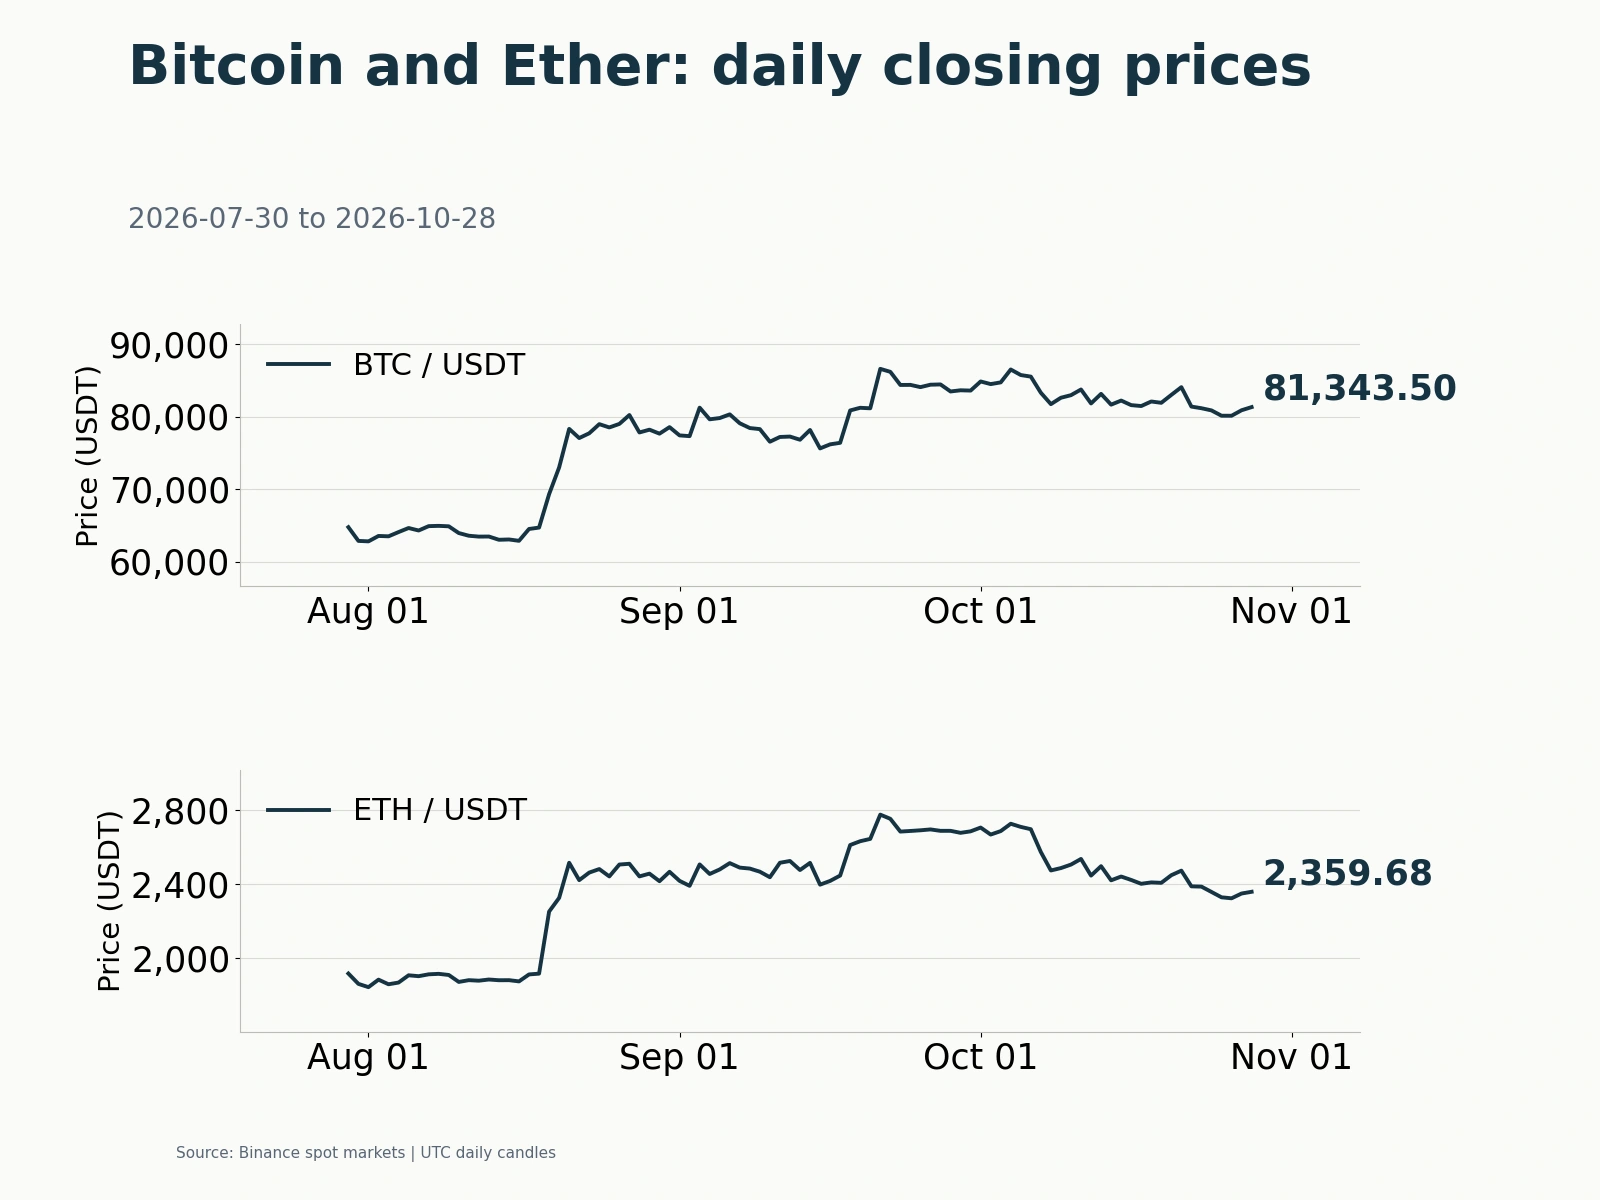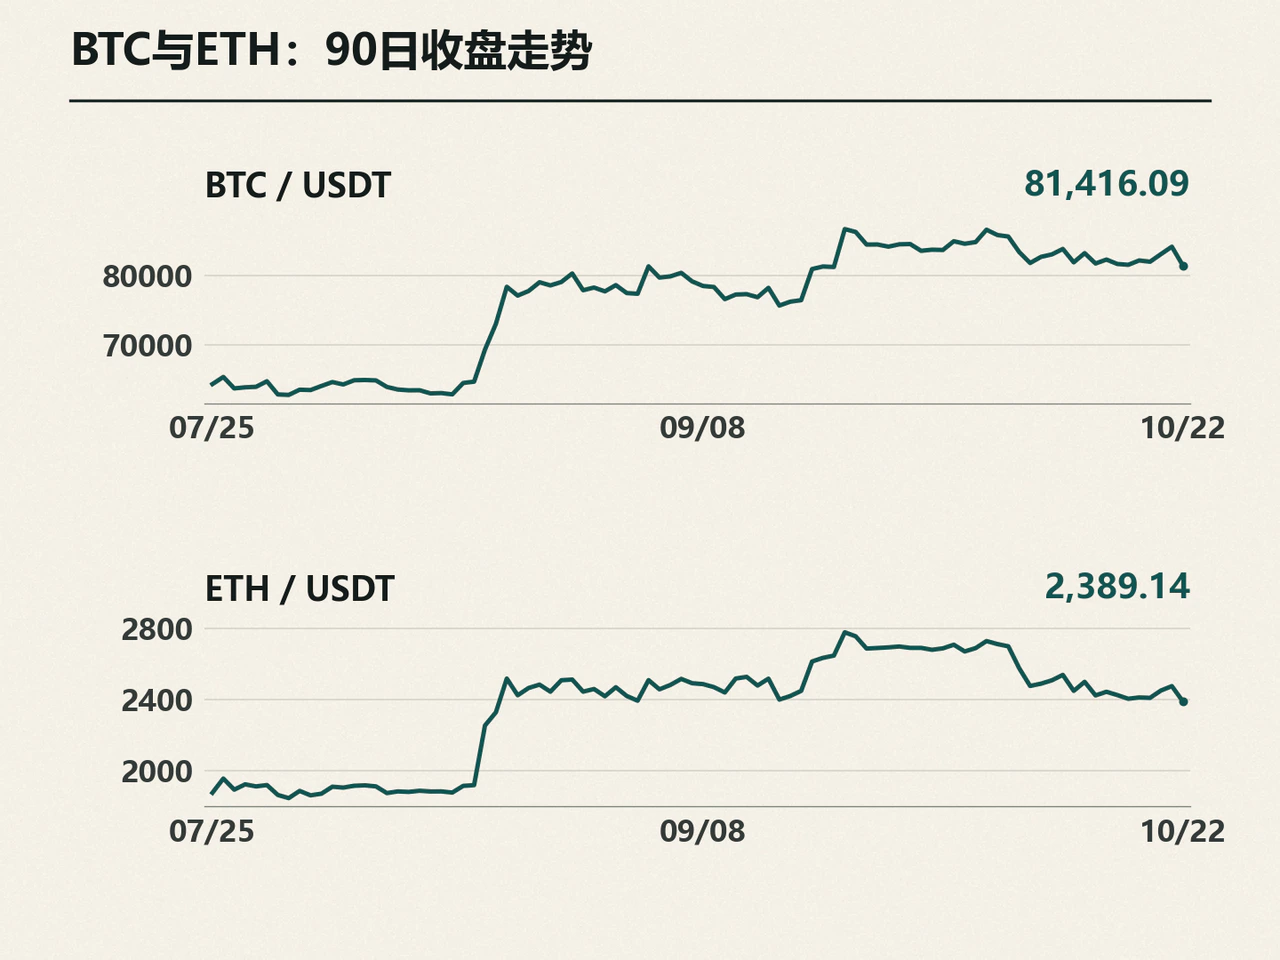
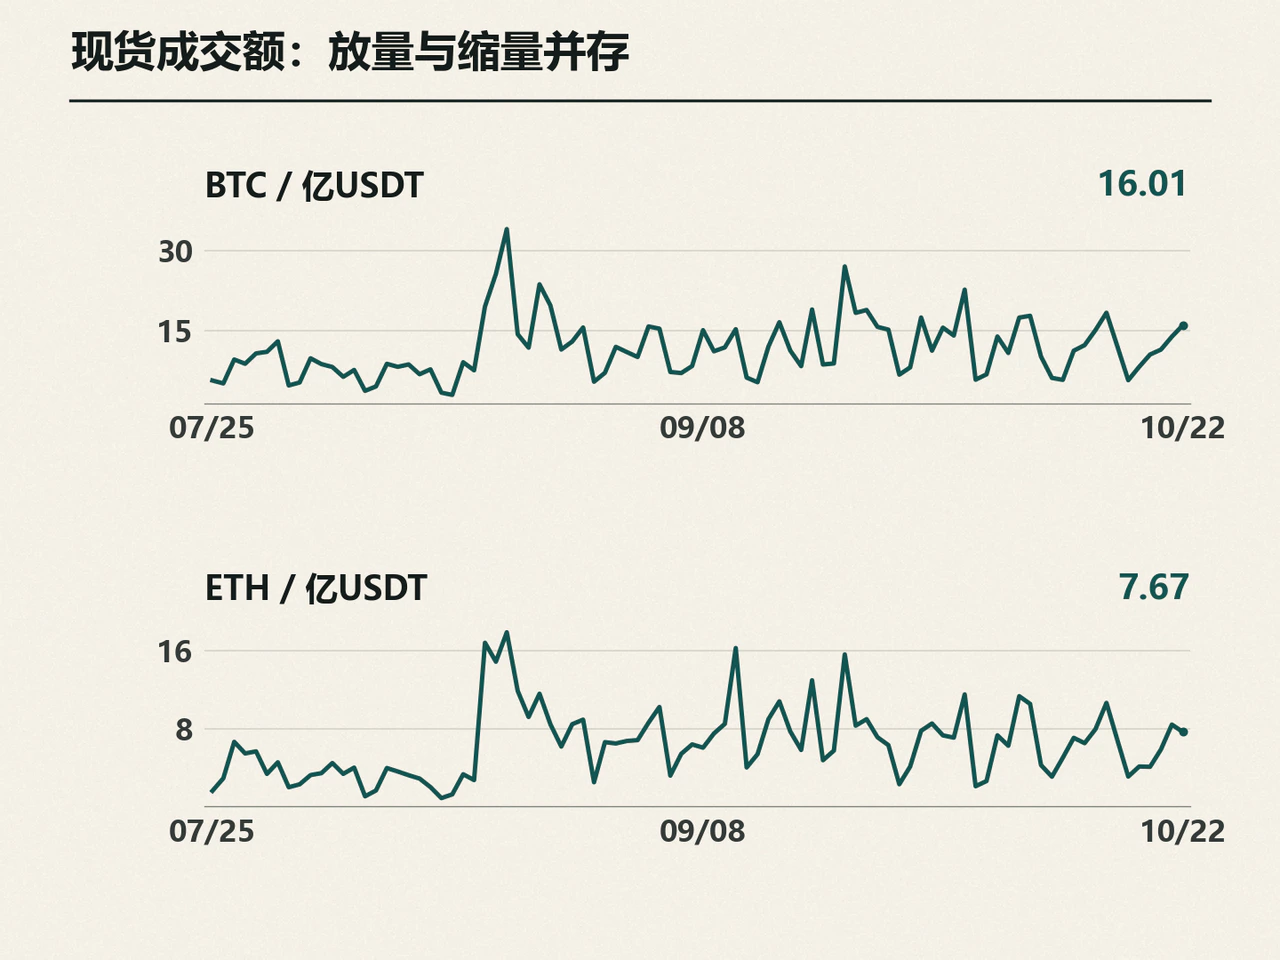
According to Binance spot UTC daily candles, as of 8 a.m. Beijing time on October 23, Bitcoin resumed its decline after the previous day's rebound, closing at 81,416.09 USDT, down 3.18% for the day. Ether closed at 2,389.14 USDT, down 3.42%, with major tokens falling in tandem. The simultaneous decline in U.S. technology shares and Treasury yields showed capital moving into defensive assets, while crypto assets continued to be cut as highly volatile risk exposure. Technical upgrades to public blockchains were progressing, but had yet to reverse the short-term pricing of macroeconomic risk aversion.
Major tokens all close lower: ETH/BTC falls more than 8% over 30 days as Bitcoin dominance rises to about 60%
Bitcoin fell from the previous close of 84,093.42 USDT, reached an intraday high of 84,377.21 USDT and a low of 80,939.54 USDT, and finished at 81,416.09 USDT, less than 500 USDT above the session low. It gave back almost all the price cushion created by the previous day's rebound. Ether touched an intraday low of 2,360.32 USDT before recovering slightly to close at 2,389.14 USDT. Binance spot BTC/USDT turnover was 1.601 billion USDT, up 15.28% from the previous day, while ETH/USDT turnover was 767 million USDT, down 8.96%. Their prices followed similar paths but trading activity diverged: Bitcoin changed hands more heavily during the retreat, whereas Ether fell on lighter turnover in the absence of sufficient buying support.
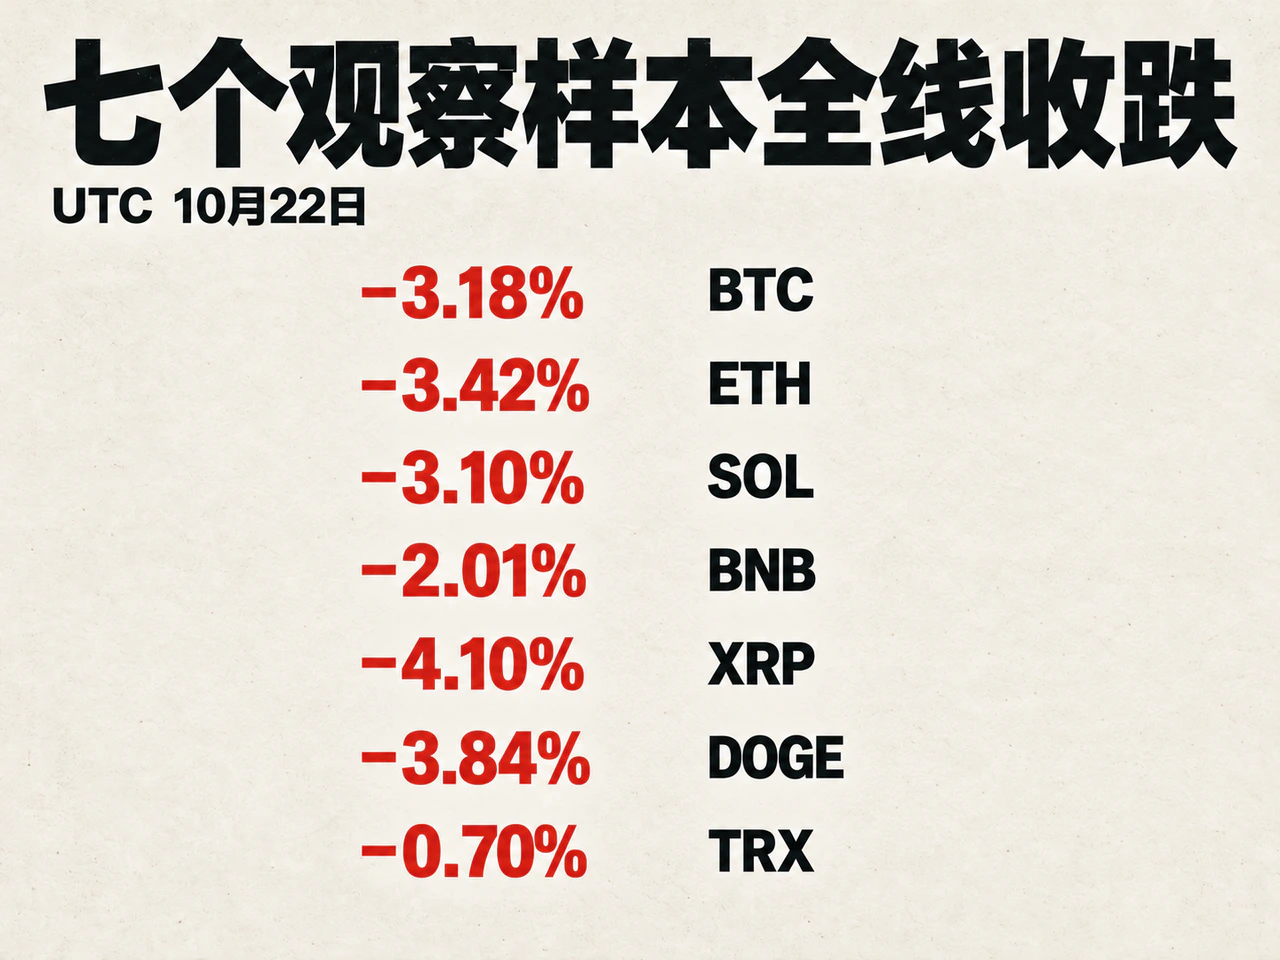
The weakness extended across the major liquid tokens, with all seven tokens in the fixed monitoring sample declining. Losses varied within the group: TRX (-0.70%) and BNB (-2.01%, closing at 731.28 USDT) were relatively resilient; SOL fell 3.10% to 103.65 USDT, while DOGE (-3.84%) and XRP (-4.10%) faced heavier selling pressure.
| Token | October 22 UTC close (USDT) | Daily change | Change from 30 days earlier |
|---|---|---|---|
| BTC | 81,416.09 | -3.18% | -5.56% |
| ETH | 2,389.14 | -3.42% | -13.24% |
| SOL | 103.65 | -3.10% | -12.58% |
| BNB | 731.28 | -2.01% | -7.24% |
| XRP | 1.3094 | -4.10% | -16.74% |
| DOGE | 0.07882 | -3.84% | -21.53% |
| TRX | 0.3286 | -0.70% | -3.95% |
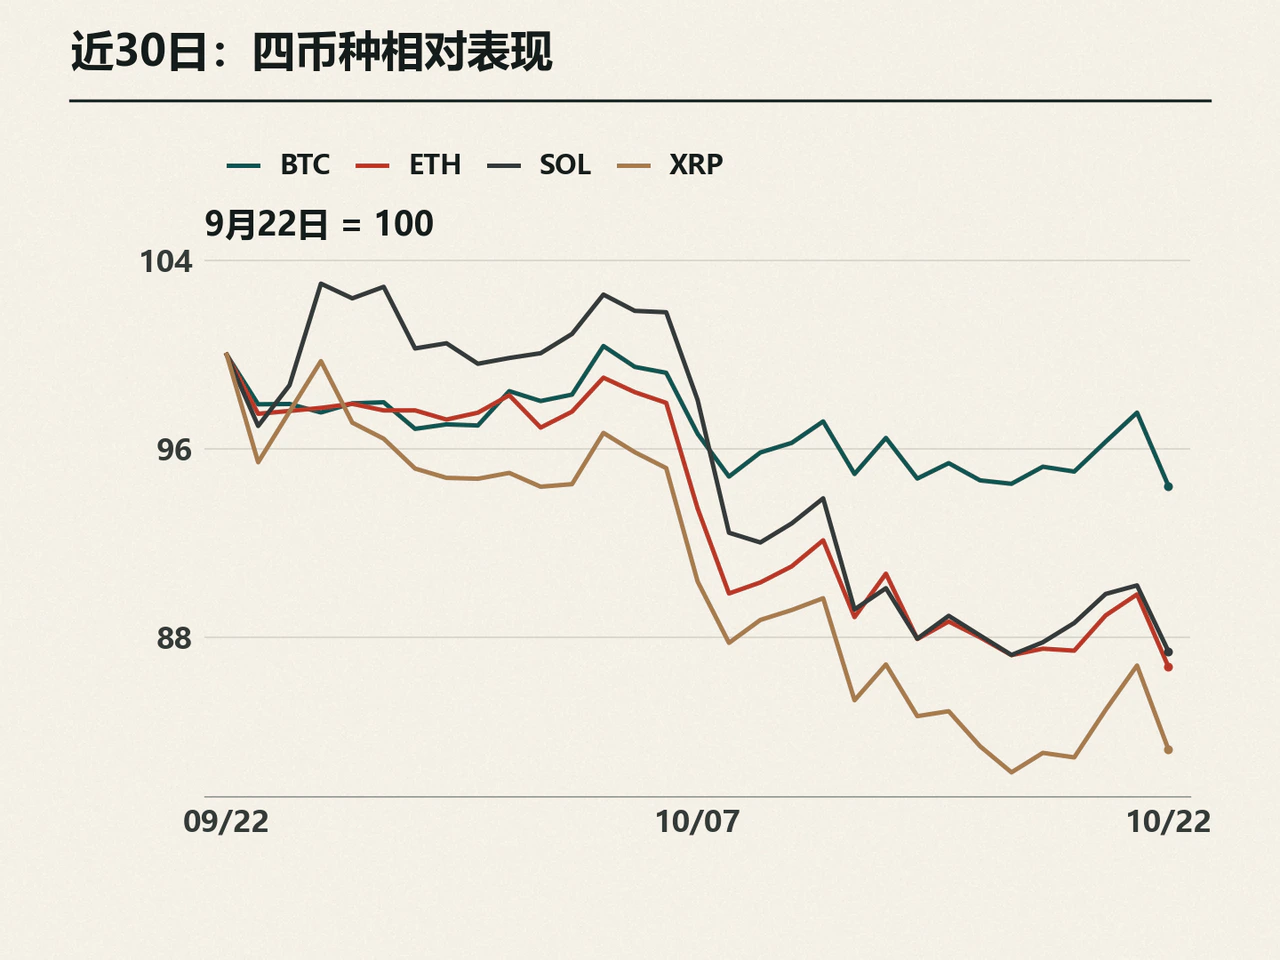
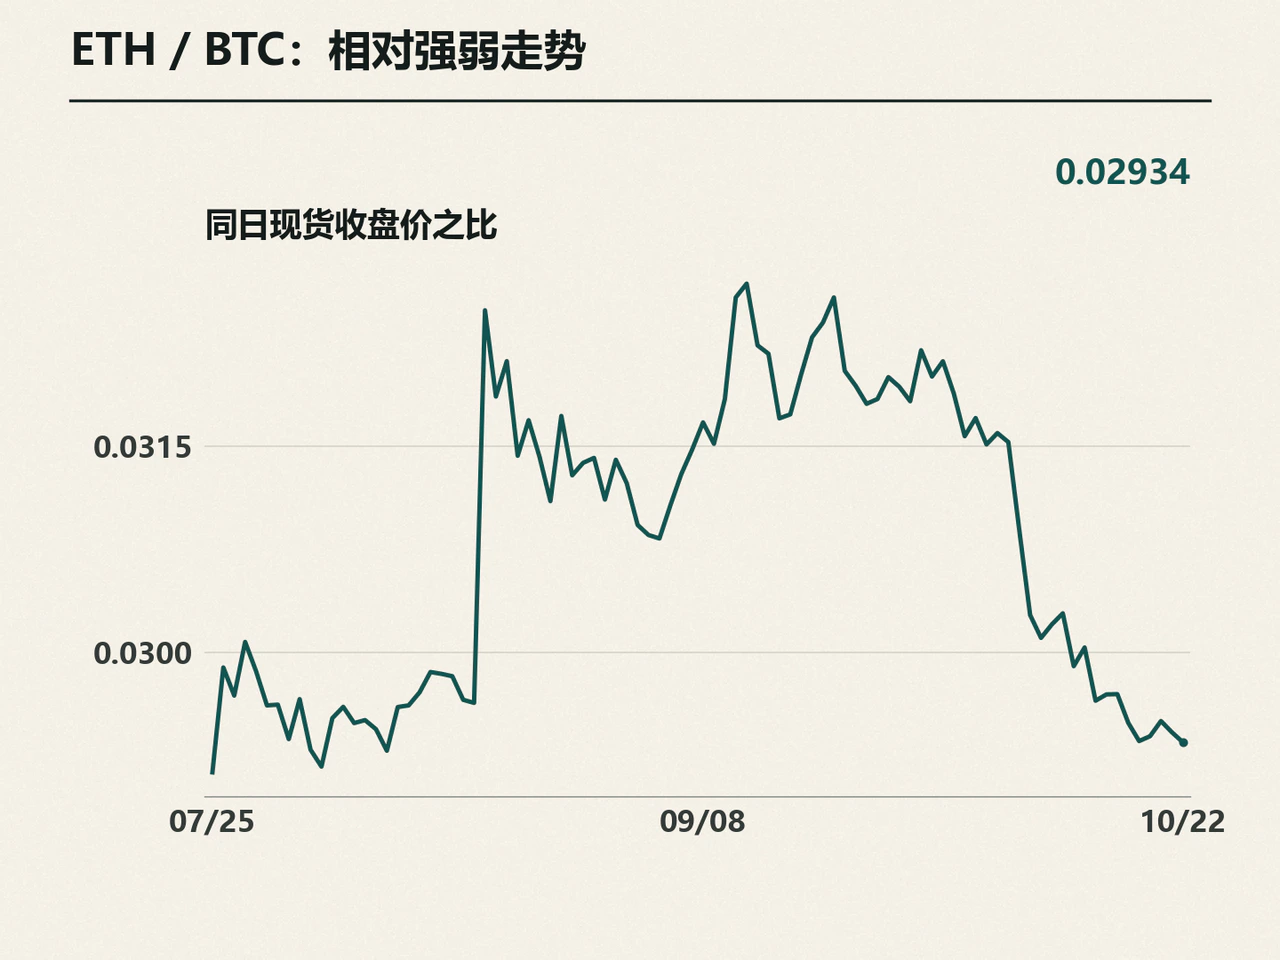
Bitcoin's relative resilience is clearer over a 30-day horizon. It lost 5.56% over the past 30 days, while Ether (-13.24%) and SOL (-12.58%) each fell more than twice as much; DOGE dropped more than 20%. The closing Ether-to-Bitcoin ratio, ETH/BTC, fell to 0.02934, down 8.13% from 30 days earlier. The extra volatility borne by Ether holders did not translate into relative returns over this period.
CoinDesk's market commentary on October 22 also noted that Bitcoin dominance had risen to about 60% the previous day, its highest level since May. This intraday indicator corroborates the relative performance of major tokens over the past month: valuations are becoming more differentiated, and Bitcoin remains the preferred allocation within crypto as risk appetite cools.
Nasdaq's 2.6% decline sparks cross-market risk aversion; Solana's upgrade cannot overcome macro selling pressure
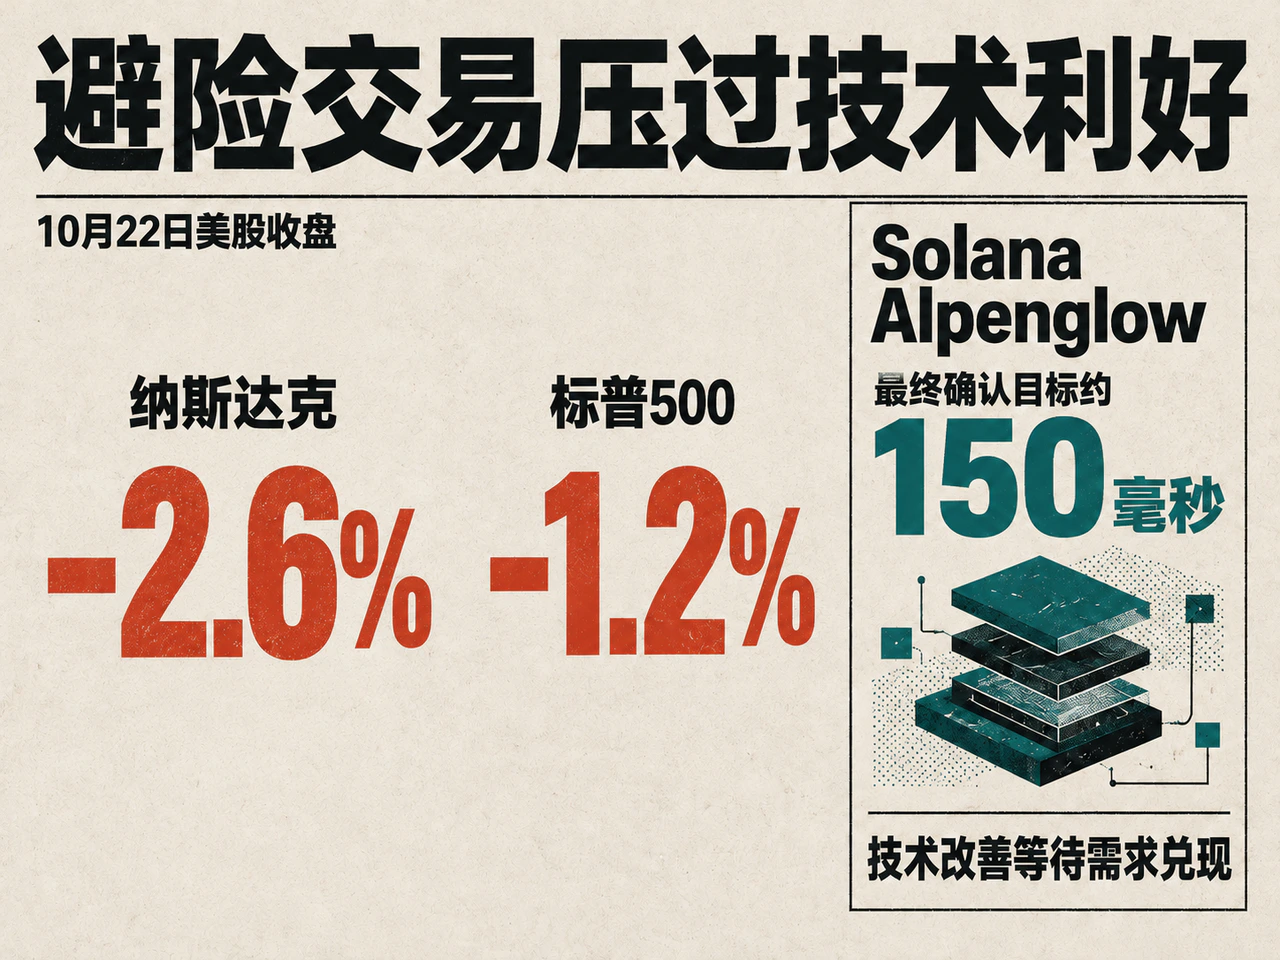
Stocks and bonds in traditional financial markets directly reflected the day's flight to safety. According to CoinDesk's closing report, the Nasdaq fell 2.6% and the S&P 500 lost 1.2%, with capital moving into defensive sectors such as healthcare and consumer staples as U.S. Treasury yields fell sharply across the curve. Lower risk-free rates failed to support crypto prices, indicating that shrinking risk exposure was the dominant force in cross-market trading that day. Lower discount rates were insufficient to offset the rise in risk premiums.
Equities came under pressure as investors reassessed technology companies' ability to deliver capacity and earn returns on capital expenditure. Although Blackstone President Jon Gray continued to emphasize strong customer demand, supply-chain constraints revealed by Lam Research raised concerns about future revenue realization, hurting AI-related shares broadly. As the focus shifted from demand narratives to actual delivery and conversion into profits, crypto tokens, which lack a stable cash-flow anchor for valuation, became more vulnerable to liquidity transmission from cross-market position adjustments.
LMAX market strategist Joel Kruger told CoinDesk that crypto's earlier independent outperformance had given way to closer correlation with equities, with participants still waiting for a new catalyst from within the industry. When macro risk appetite dominates pricing, there is a clear lag between advances in public-blockchain technology that improve the long-term user experience and fresh buying in secondary markets on a given day.
Solana's Alpenglow upgrade, launched on October 21, illustrates that disconnect. According to CoinDesk, the upgrade focuses on moving validator votes off-chain, reducing validators' operating costs and targeting transaction finality of about 150 milliseconds. Faster confirmation can reduce waiting times for payments and trades, while lower validation costs support the network's long-term operation. But Robin Nordnes, founder of trading-infrastructure company Raiku, noted that finality is not the only bottleneck for professional trading desks: proximity to block construction remains crucial. Even as technical metrics improve, the trading experience is still constrained by execution order, connection quality and market liquidity. The value of an upgrade must gradually be realized through actual use and recurring revenue, while token prices first absorb the short-term pressure of contracting asset allocations.
In community commentary, AirdropAlert writer Morten Christensen attributed SOL's decline to upgrade expectations having been priced in, followed by the shock from the technology-stock pullback. Market data, however, show that SOL's 3.10% decline was very close to Bitcoin's 3.18% loss, and all seven tokens in the fixed sample fell. Common macroeconomic and market-risk factors therefore remained the central drivers of that day's trading.
The quality of any subsequent recovery will depend on whether Bitcoin can retain buying support and whether ETH/BTC and the performance of major tokens improve alongside it. If the rebound remains concentrated in Bitcoin, risk appetite within the industry will still be defensive. A more durable internal catalyst will require technical upgrades to translate gradually into user activity and stronger protocol operations, corroborated by broader price participation.
Click “Read the original” for full details.