By the morning of October 25 Beijing time, on-chain spot trading and protocol fees had declined in the short term, while real-world asset (RWA) issuance and secondary-market trading continued to expand. Tokenized-stock turnover, particularly on BNB Chain, increased sharply in the third quarter. Crypto-native trading nevertheless contributed an important share of incremental network fees, while the conversion of new assets into lending collateral and protocol revenue remained at an early stage.
Daily DEX volume falls to US$6.986 billion as network TVL diverges and lending utilization declines
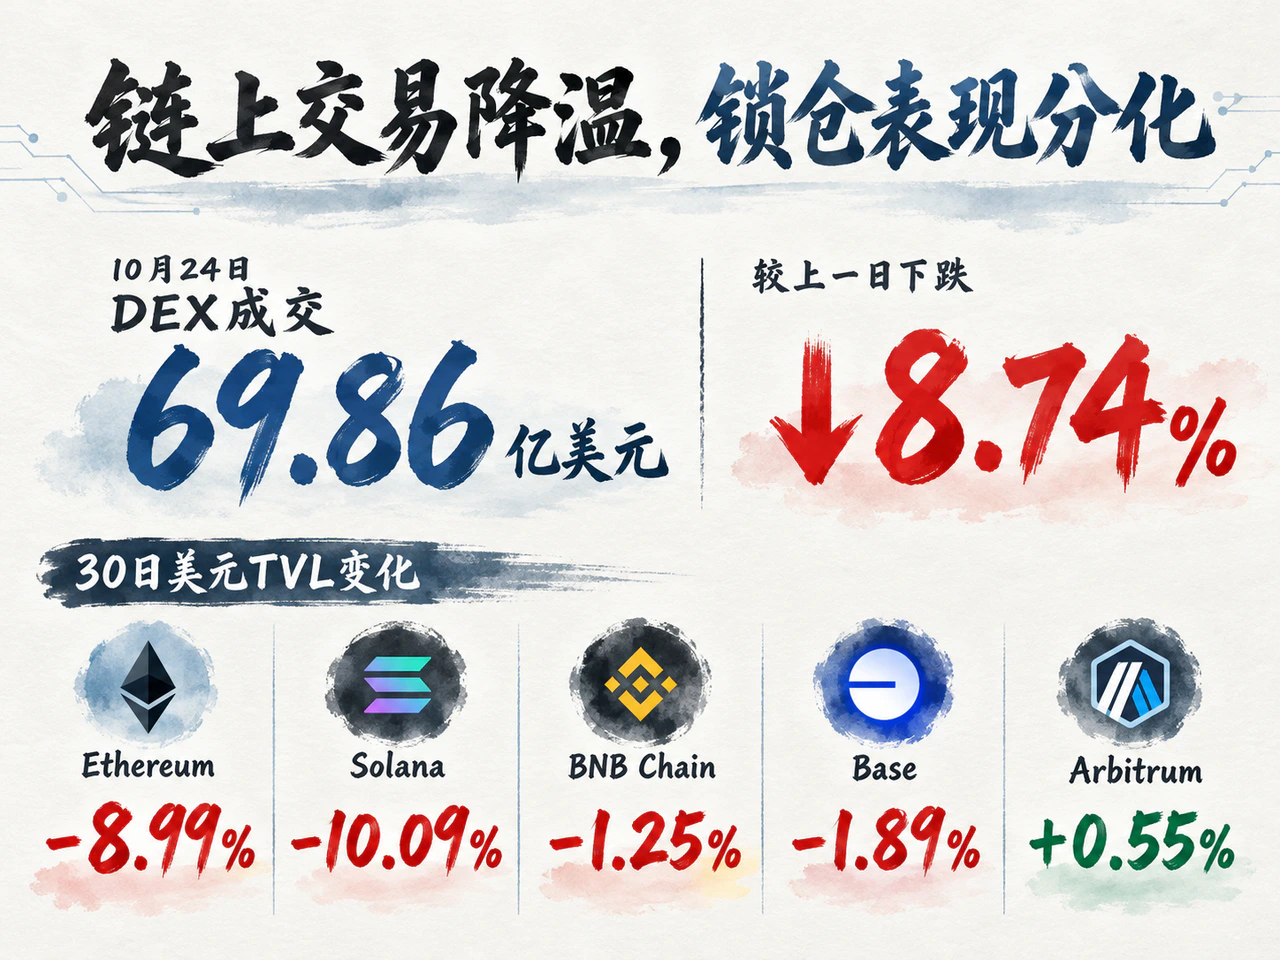
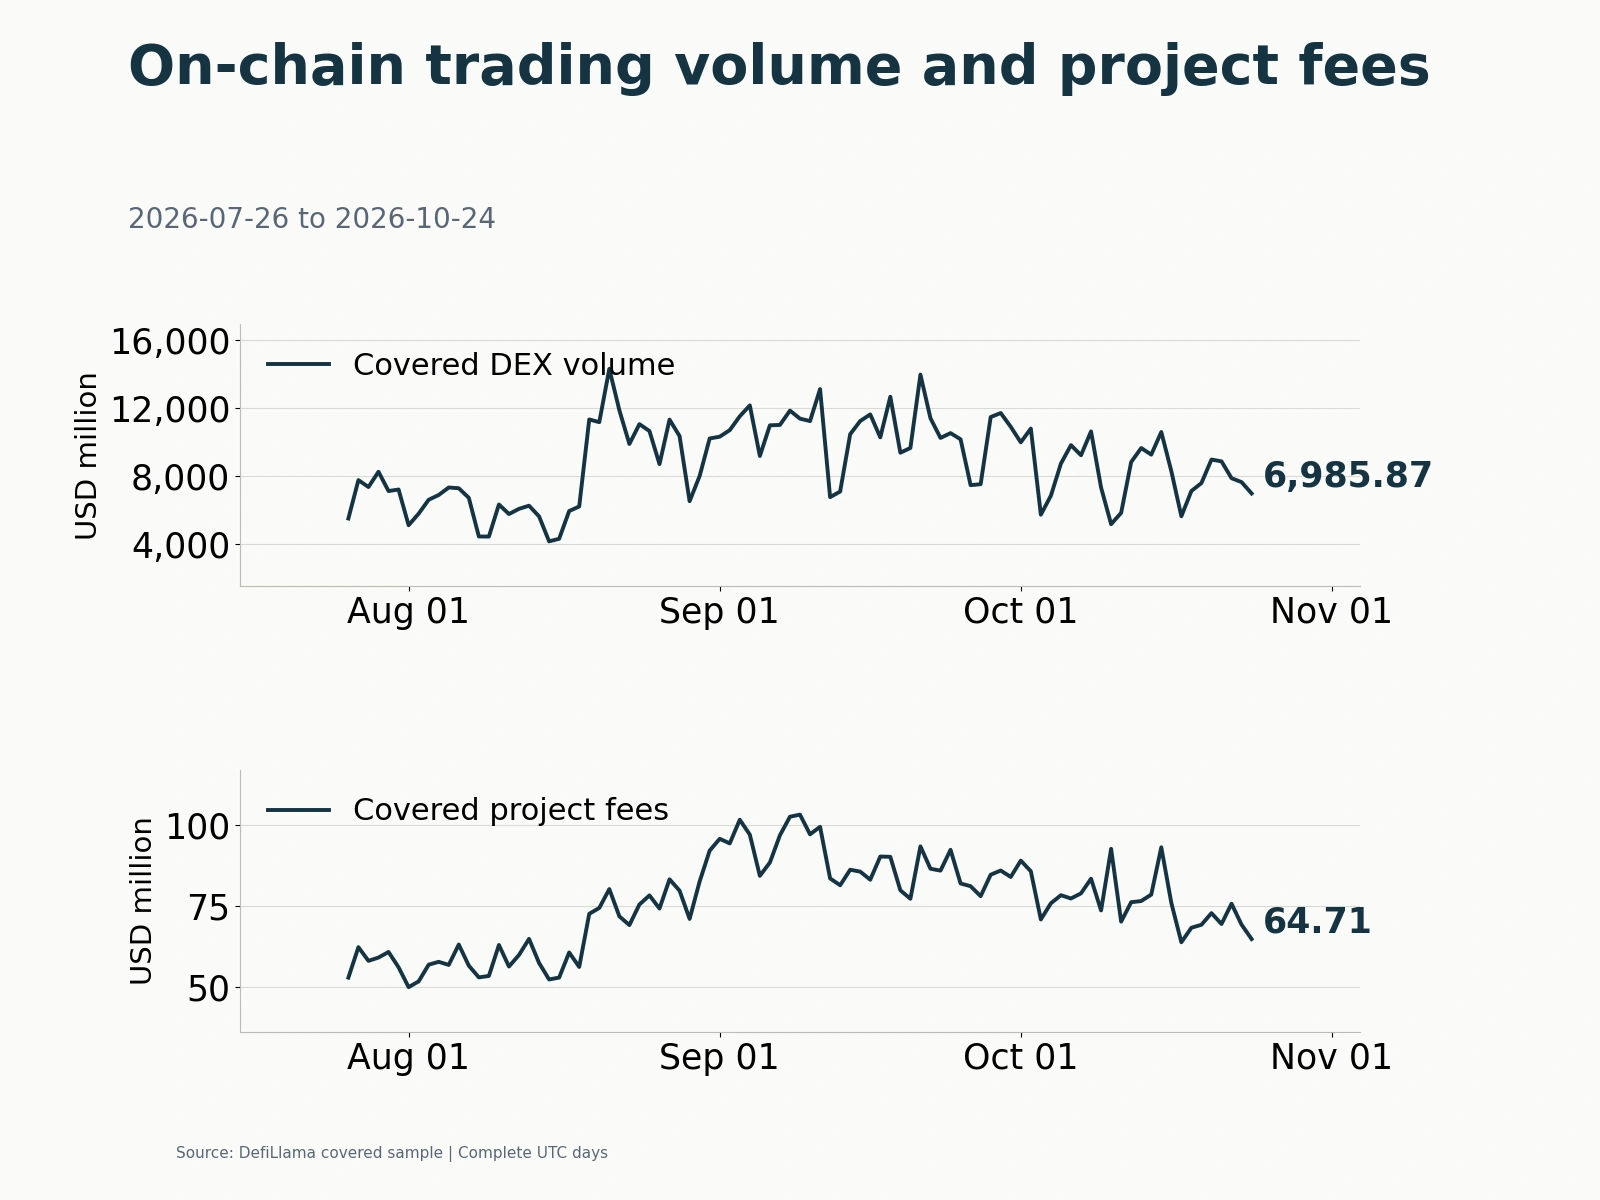
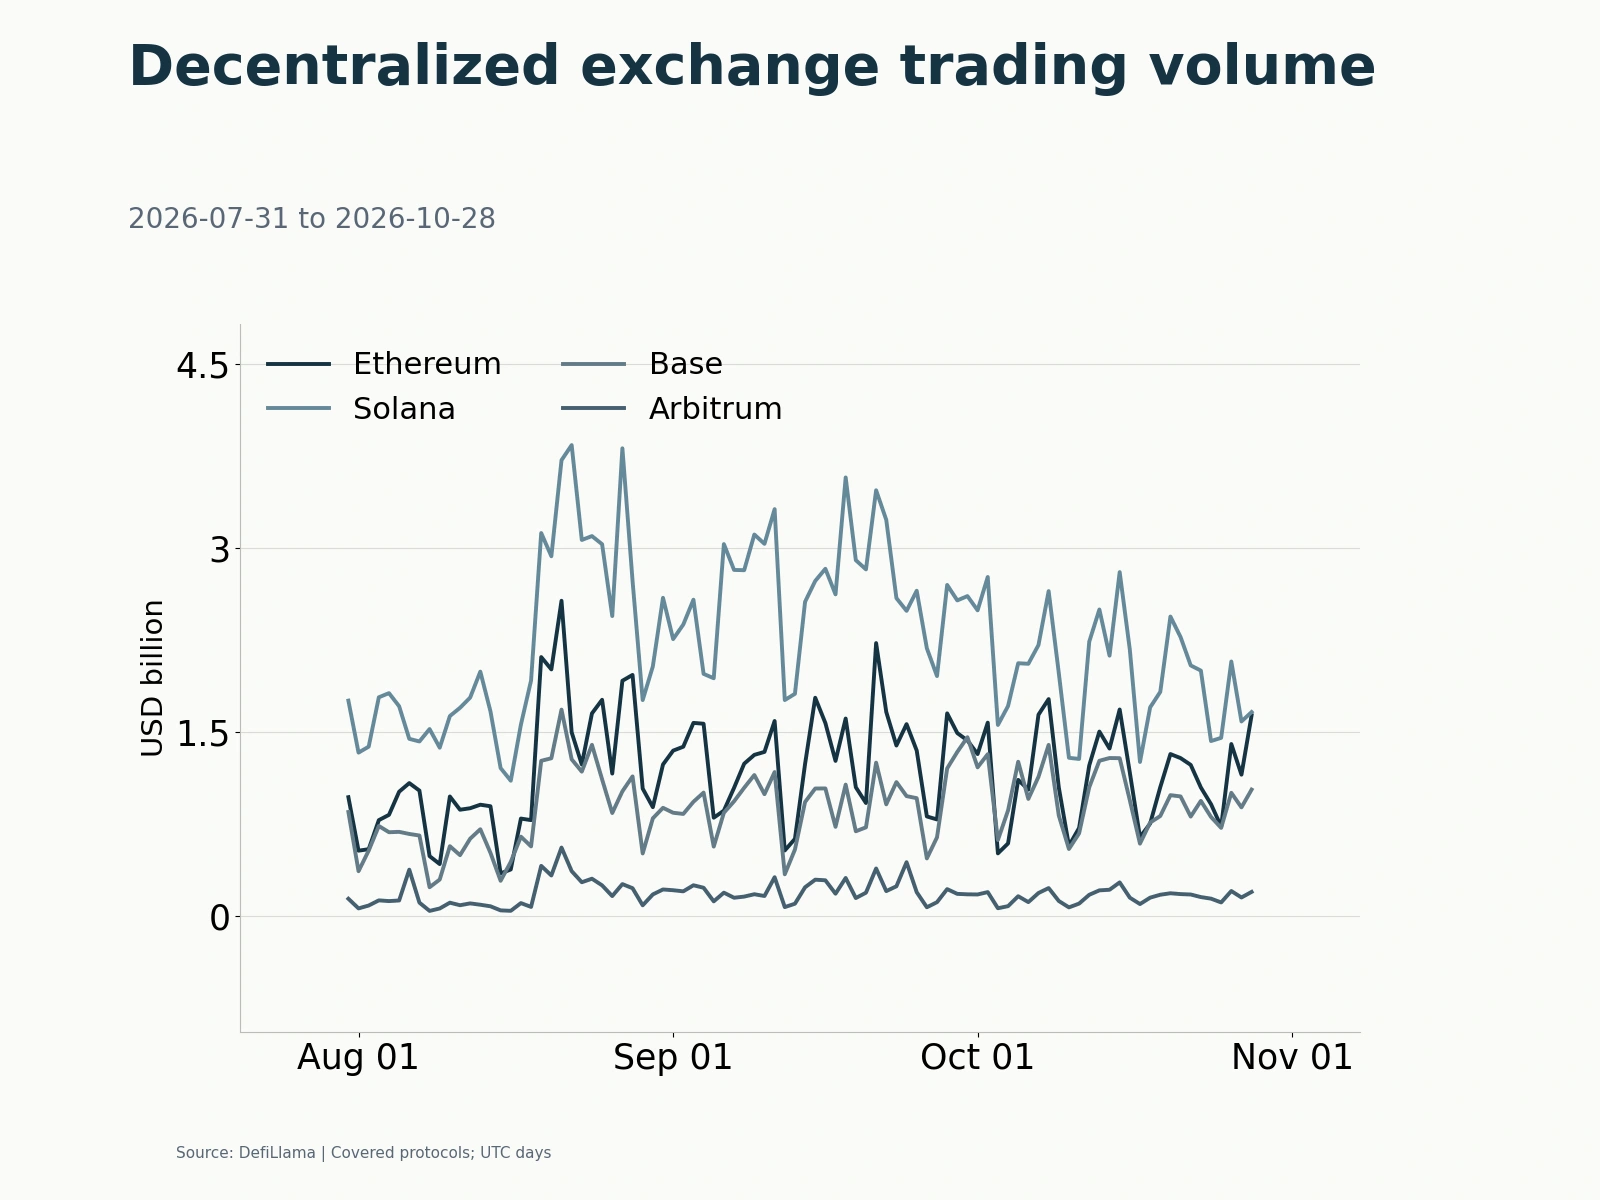
DefiLlama’s UTC daily data put spot trading volume across its covered decentralized exchanges (DEXs) at US$6.986 billion on October 24, down 8.74% from the preceding day. The latest seven complete days generated US$55.116 billion, 5.24% less than the previous seven. Covered on-chain projects collected US$64.71 million in fees that day, down 6.44%, showing a simultaneous short-term slowdown in trading and fees.
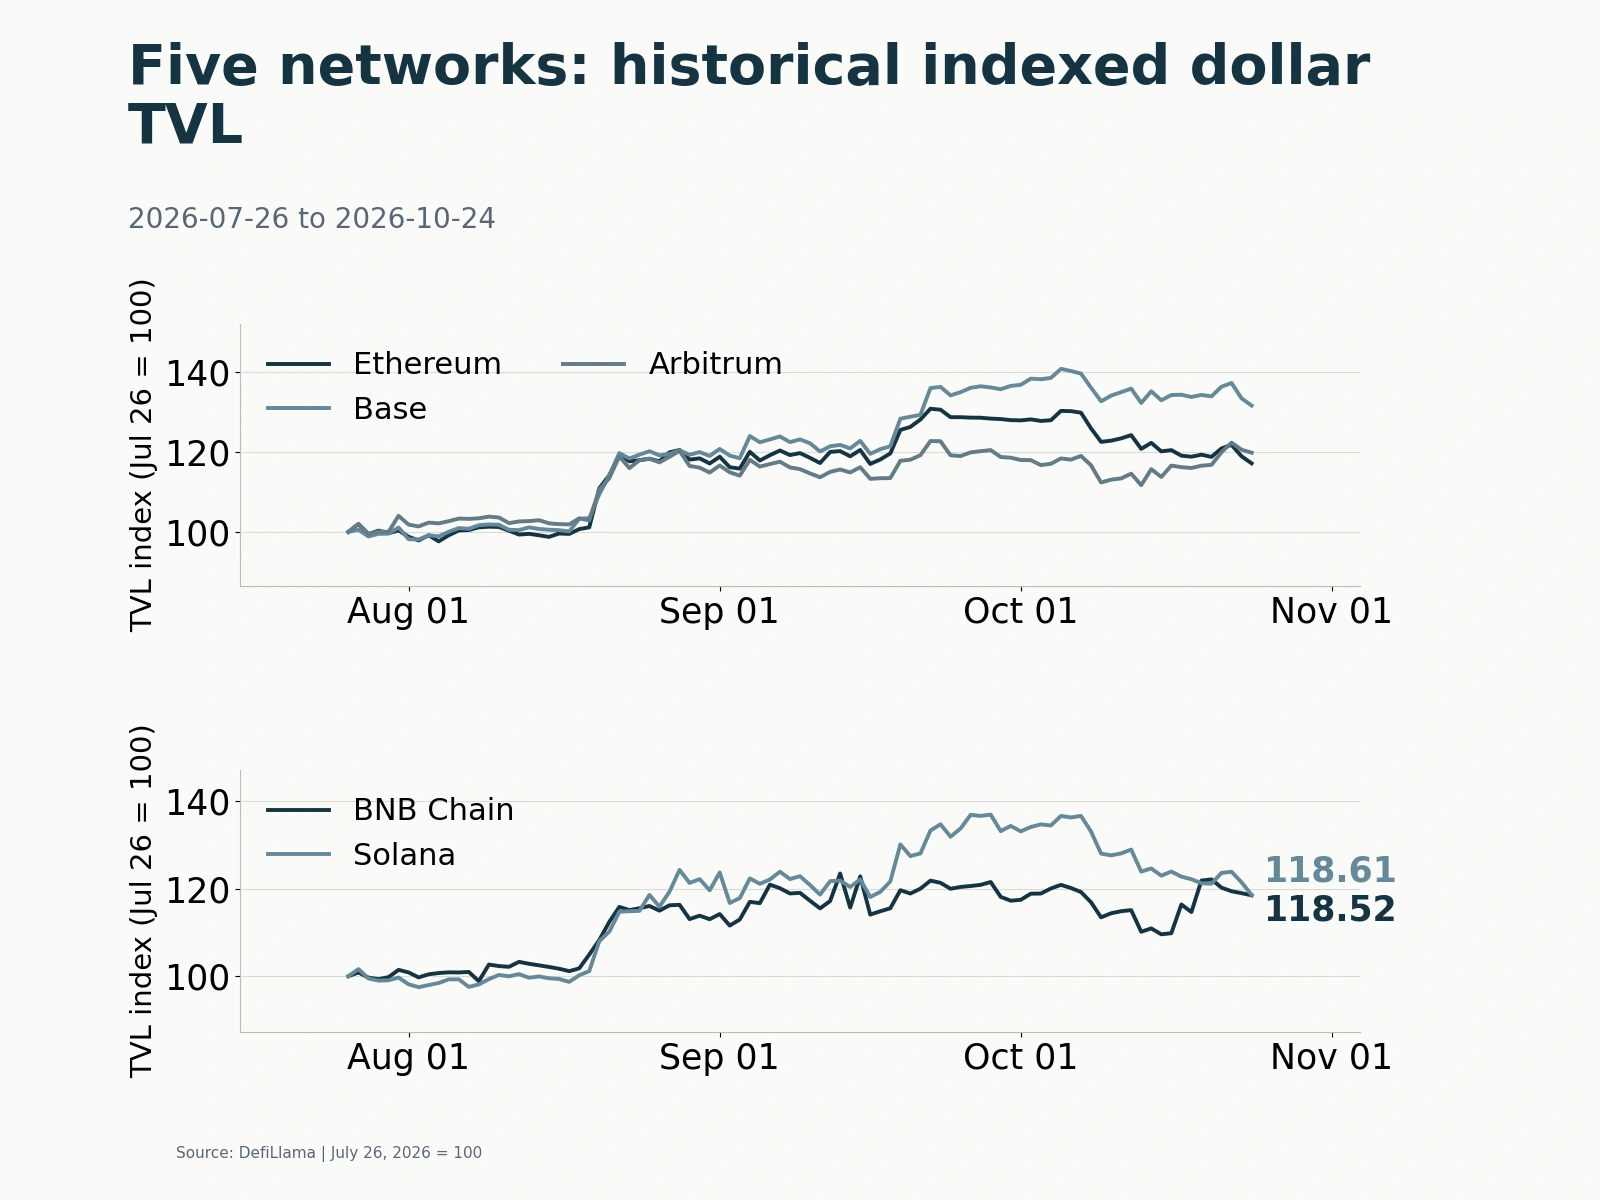
Monthly total value locked (TVL) performance differed across networks. As of October 24, dollar TVL on Ethereum mainnet was down 8.99% from 30 days earlier at US$48.669 billion. Solana fell 10.09% to approximately US$5.723 billion; BNB Smart Chain slipped 1.25% to about US$5.757 billion; Base declined 1.89% to roughly US$6.048 billion; and Arbitrum edged up 0.55%. Dollar TVL reflects both token prices and asset quantities, so a decline measures a change in outstanding dollar value and cannot be directly converted into net fund outflows. Over 90 days, all five networks remained above their starting levels, with Base up approximately 31.68%. The overall pattern was a structural adjustment following earlier expansion.
Whether retained assets generated operating revenue on-chain depended on actual demand for borrowing, payments and settlement. A BNB Chain quarterly report disclosed on October 24 and its cited original Blockworks third-quarter report showed lending deposits rising 42% to US$3.57 billion and outstanding borrowing increasing 33% to US$940 million. Faster deposit growth reduced utilization from 27.9% to 26.2%, indicating that additional collateral had not fully translated into financing demand. For stablecoin payments, BNB Chain extended fee subsidies on some transfers through the end of October. Low costs could attract usage, but conversion into network revenue depended on subsequent charging arrangements. Data provider Allium’s recent explanation of payment measurement also said genuine payments must exclude minting and burning, cross-chain representations, internal exchange transfers and automated circular transactions. Simply adding transfer amounts does not reveal actual settlement volume.
BNB Chain tokenized stocks trade US$25.6 billion in a quarter; native routing contributes over a third of fee growth
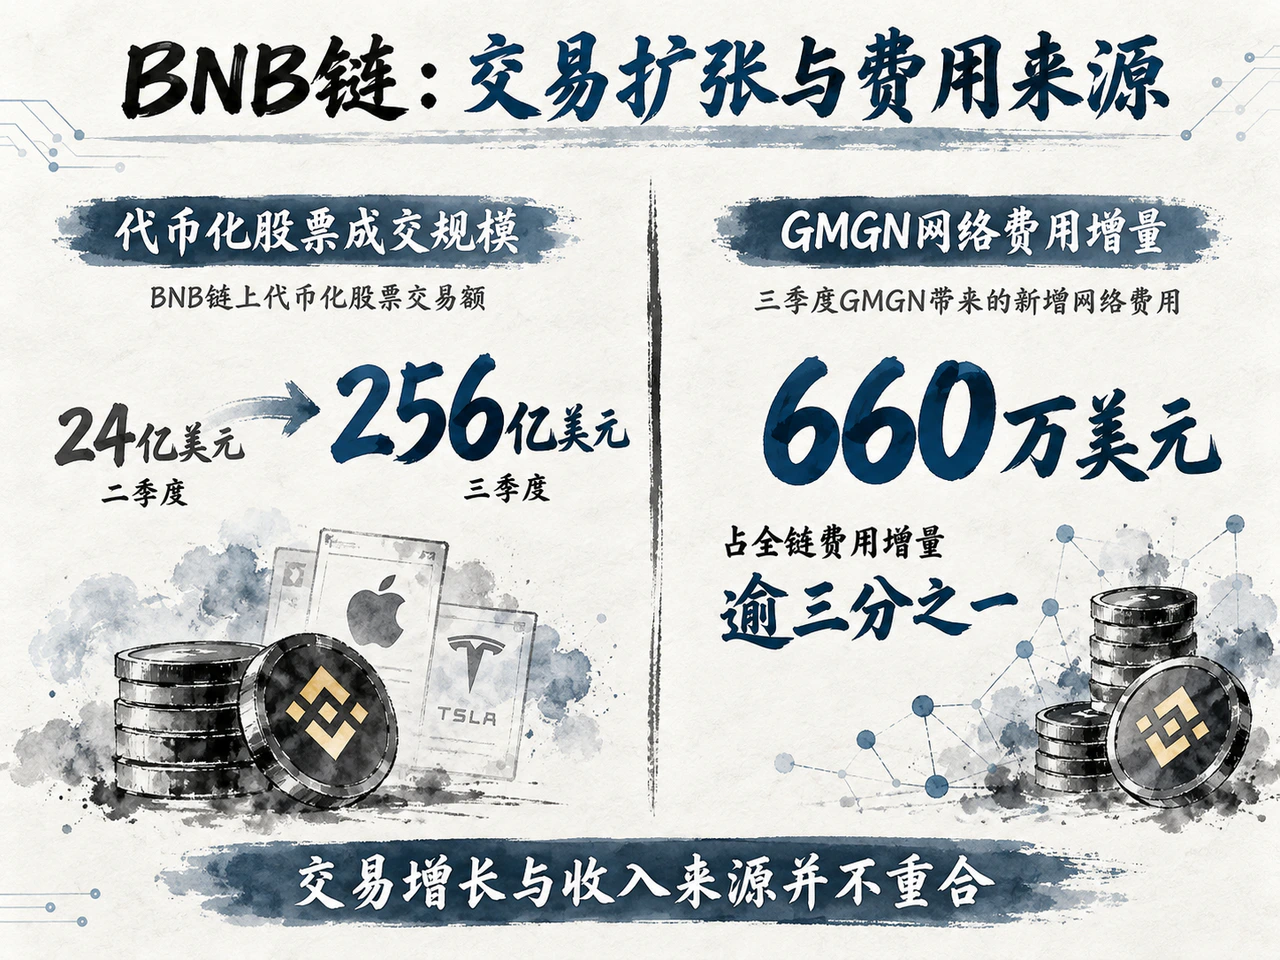
Among individual applications, expansion in tokenized-stock secondary trading was especially pronounced. Blockworks’ third-quarter report put BNB Chain tokenized-stock turnover at US$25.6 billion, up from approximately US$2.4 billion in the second quarter. About US$24.4 billion was DEX trading and US$1.2 billion came from Ondo Global Markets. Tokenized-stock supply doubled from US$560 million to US$1.13 billion, increasing both the stock of issued assets and secondary-market turnover. Across the report’s covered tokenized-asset DEX sample, excluding trades paired with memecoins, third-quarter volume was US$45.8 billion. BNB Chain accounted for more than half, while Robinhood Chain and Solana generated approximately US$10.2 billion and US$6.4 billion. Tokenized-asset pairs’ share of BNB Chain spot DEX volume rose from 0.2% in the second quarter to 32.3% in the third.
The sources of volume growth and incremental network income did not fully coincide. BNB Chain’s third-quarter network economic value was US$54.2 million, comprising US$49.1 million in transaction fees and US$5.1 million in MEV payments, up 54% quarter on quarter. The original report attributed an important part of fee growth to GMGN routing: its network fees increased from US$2.2 million to US$8.8 million. That increase represented more than one-third of the chain’s total increase in transaction fees and was concentrated in August and September, when Flap token issuance was active. Traditional assets moving on-chain enlarged spot turnover, but crypto-native trading still contributed substantially to growth in the network’s underlying income.
Tokenized-stock trading also remained highly concentrated, and lending applications were still nascent. QQQB, representing a Nasdaq 100 ETF, generated approximately 80% of bStocks’ quarterly DEX turnover. By the end of the third quarter, about US$62 million of tokenized stocks had entered lending markets, up from US$6 million but still less than 2% of the chain’s total lending deposits. Expansion from secondary trading into collateral applications remained constrained by oracle pricing, liquidation liquidity and collateral-ratio parameters.
Whether broader securities coverage could support stable liquidity, collateral financing could scale, and stablecoin payment users would stay after subsidies ended in late October would determine whether new on-chain assets could contribute lasting protocol income. For public-chain token holders, the conversion of application growth into token-economic returns ultimately also depended on how network fees were allocated among validators, stakers and burn mechanisms.
Read the original article for full details.