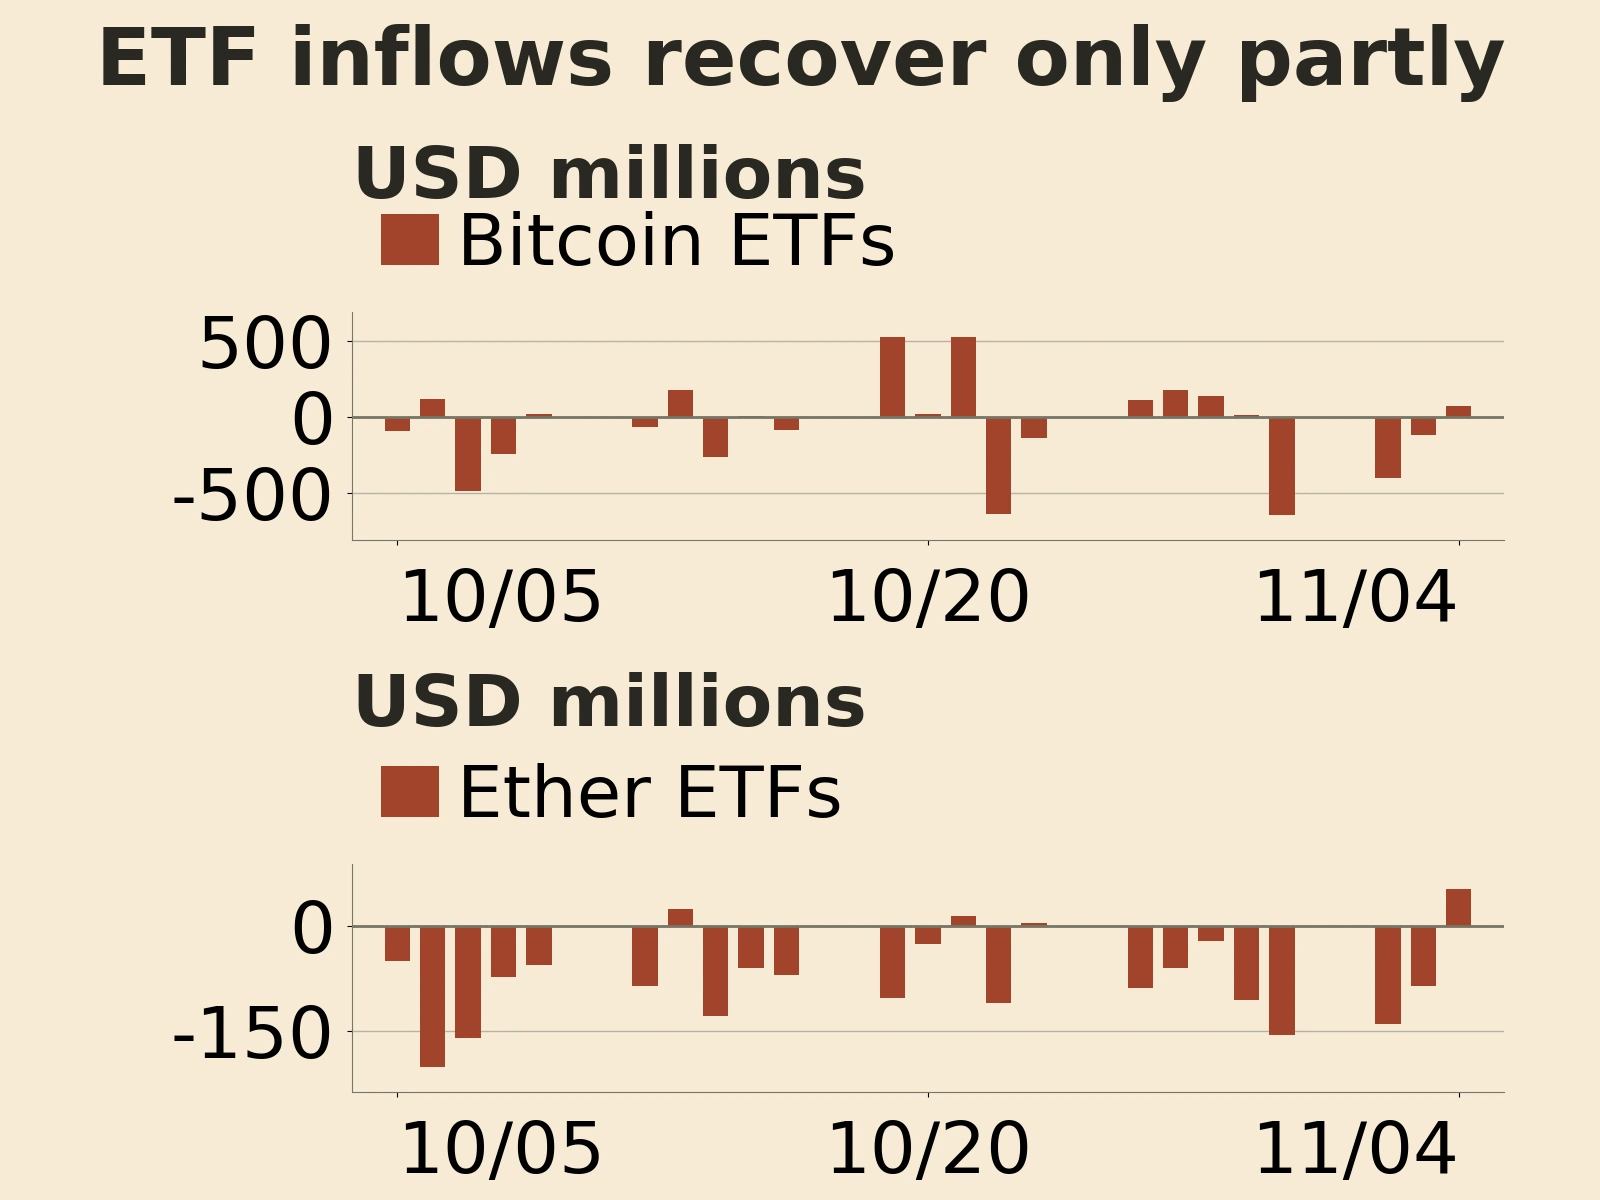
On November 5, 2026, U.S. technology stocks fell sharply, reversing the previous day's rebound in crypto. Based on Binance spot prices quoted in USDT and measured on a UTC daily basis, Bitcoin stood at 76,088.01 USDT as of 8 a.m. Beijing time on November 6, down 5.49% from the previous day. Ether fell 7.70% to 2,238.01 USDT. Bitcoin touched an intraday low of 75,208.42 USDT and recovered some ground by the close, but failed to hold above 80,000 USDT.
The decline reflected both an external shock and pressure within the crypto market. Investors reassessed the returns on AI spending and the pace of infrastructure construction, while subdued spot trading and rising leverage in perpetual futures made crypto more vulnerable. The election results briefly lifted risk appetite, but funding constraints persisted.
Chip stocks sell off, and long liquidations deepen crypto losses
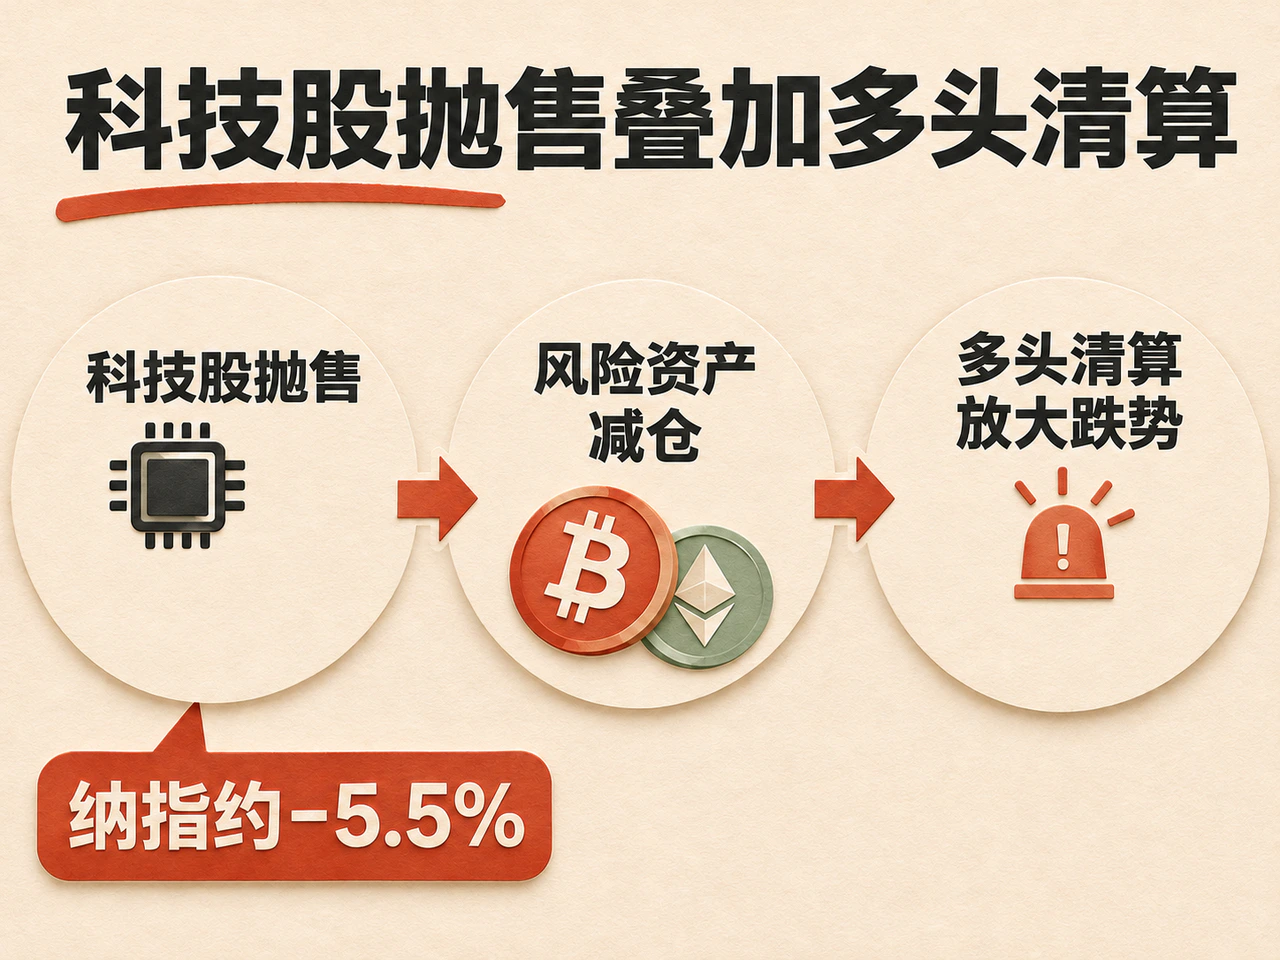
CNBC reported that Qualcomm's weaker-than-expected guidance for the current quarter, together with concerns that data center construction could slow, prompted broad selling in chip stocks. The Nasdaq Composite fell about 5.5% on the day, while Nvidia and Qualcomm each dropped more than 9%. High capital spending, financing costs and uncertainty over construction timelines are putting the cash-flow case for AI growth under closer scrutiny.
The selloff spread to crypto through risk-asset positioning. As volatility rose across markets, multi-asset investors may have cut their technology and digital-asset positions at the same time, while margin pressure may have forced leveraged traders to sell. The Block reported large-scale liquidations of long positions in crypto derivatives that day, showing that the initial decline had already triggered forced closures. The combination of a broader retreat from risk and deleveraging within crypto better explains the widespread losses than any single piece of crypto news.
The macro signals were mixed. Reuters reported that the 10-year U.S. Treasury yield fell to around 4.835%, while Brent crude rose 3.88% to settle at $98.29 a barrel. Safe-haven buying pushed Treasury yields lower, while the rebound in oil kept inflation pressure in play. For Bitcoin, the valuation support from lower yields was insufficient to offset the pressure from cuts to risk-asset positions that day. The oil rebound also weakened hopes that cheaper energy would quickly improve the macro backdrop.
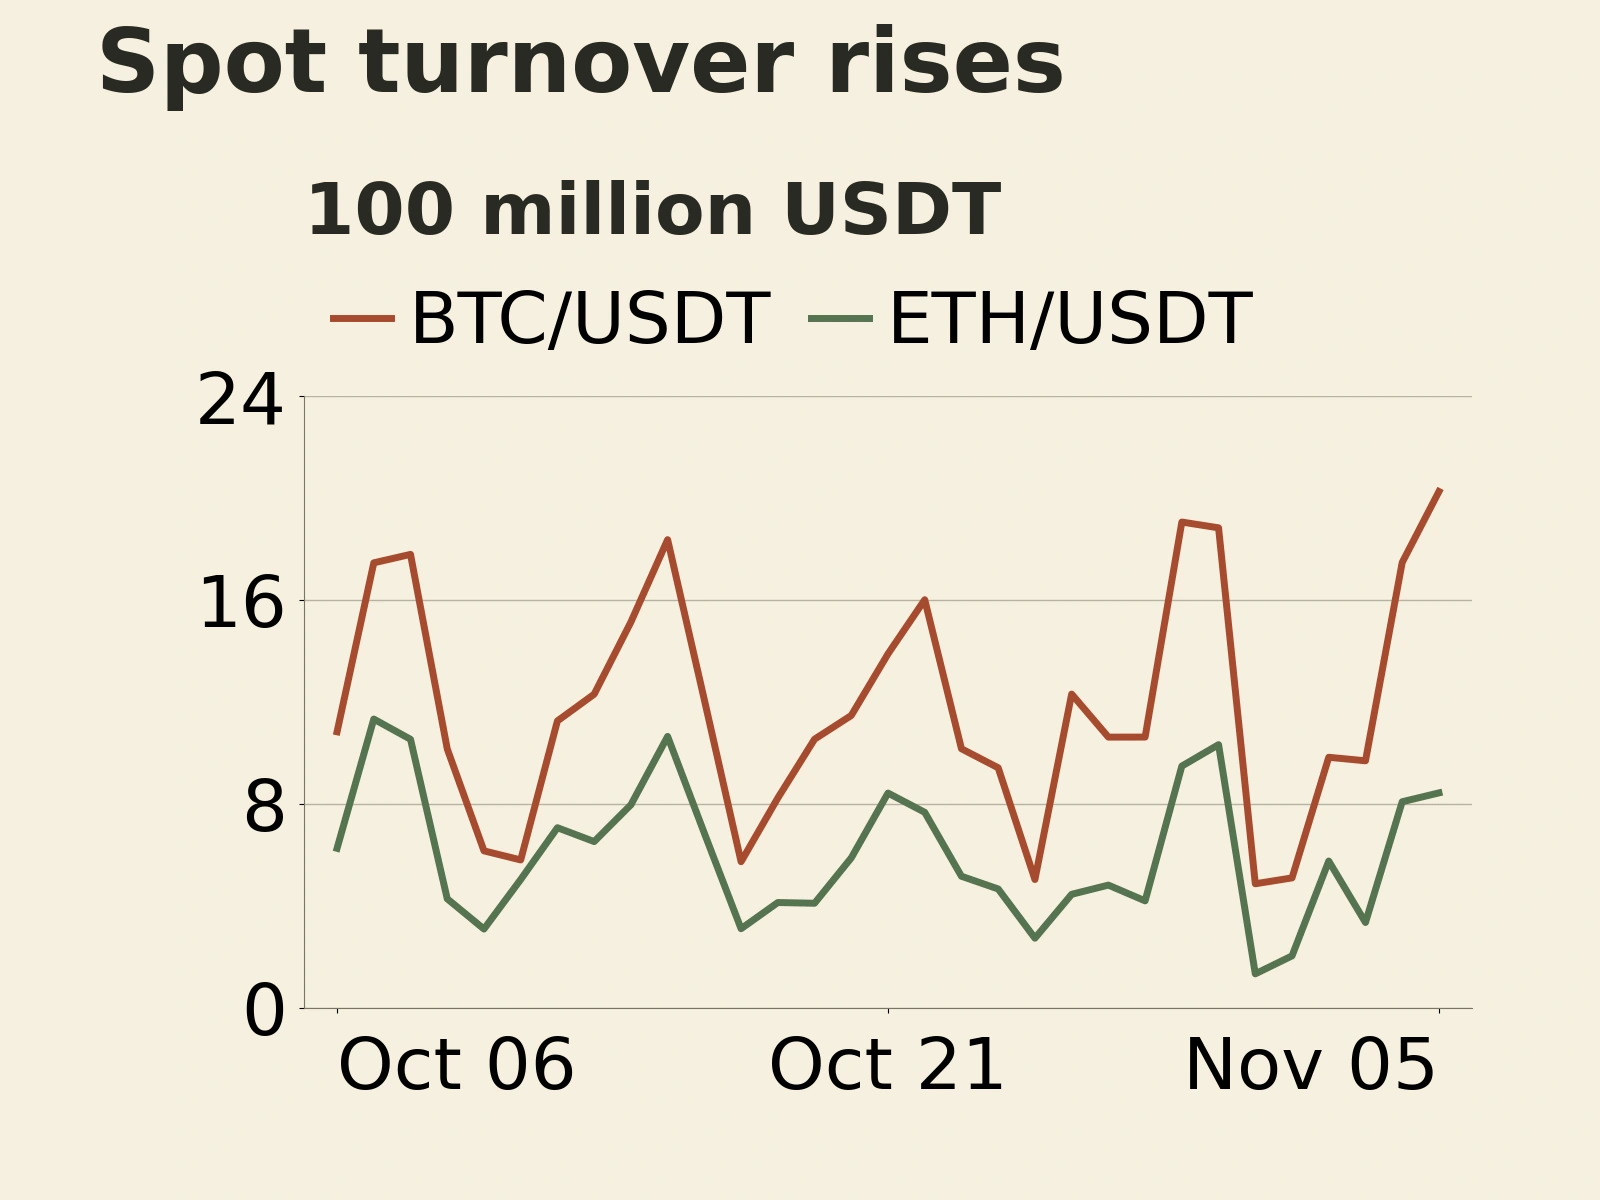
Crypto's market structure added to its vulnerability. In a research preview this week, K33 pointed out that subdued spot trading and rising perpetual futures leverage can turn fresh shocks into sharper price swings. On November 5, Binance spot turnover in BTC/USDT rose 15.9% from the previous day to about 2.025 billion USDT, while ETH/USDT turnover rose 4.3% to about 844 million USDT. Both figures use spot turnover from the same exchange and show that trading picked up as prices fell, although the increase was uneven across the two assets.
Market participants differed on what drove the previous day's rebound and what might drive prices next. Wintermute trader Jasper De Maere told The Block that several short-lived tailwinds had helped lift prices the day before, while macro pressure persisted. Yahoo Finance reported that Fundstrat's Sean Farrell had argued that the prospect of a wider fiscal deficit supported the long-term case for holding Bitcoin as a hedge. De Maere focused on immediate funding constraints, while Farrell emphasized the case for a medium- to long-term allocation. The November 5 price action was more consistent with De Maere's assessment, while the longer-term case still depends on sustained buying.
All seven major tokens fall, and ETH/BTC is down about 6.72% since October 6
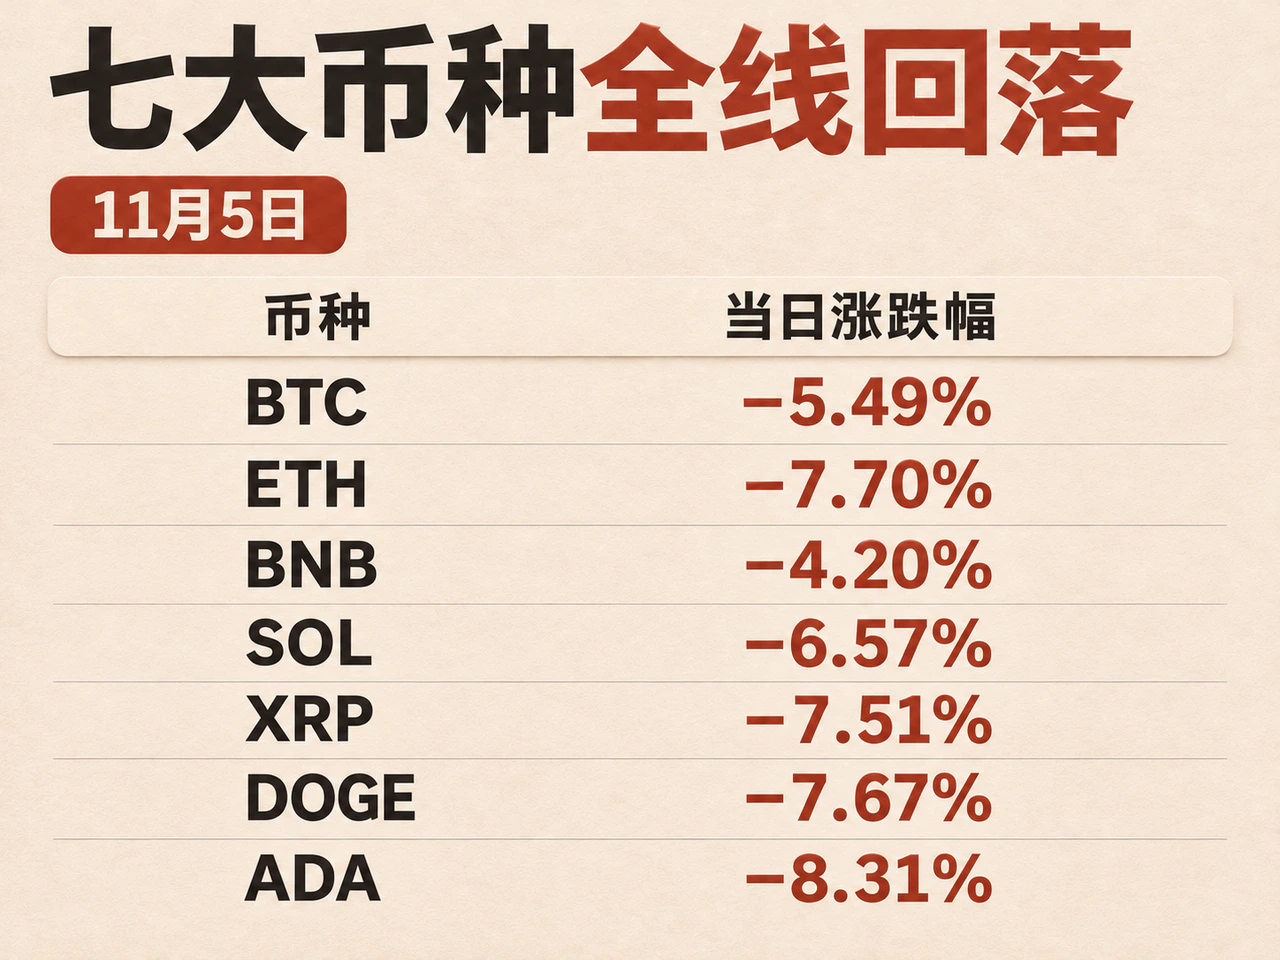
All seven highly liquid assets tracked regularly in this report fell on November 5. Alongside BTC and ETH, BNB fell 4.20%, SOL 6.57%, XRP 7.51%, DOGE 7.67% and ADA 8.31%. The sample excludes stablecoins and avoids double-counting wrapped tokens. Its coverage is narrower than the full token market, but the losses across several major segments show that the selloff was broad and that no asset emerged as an independent market leader.
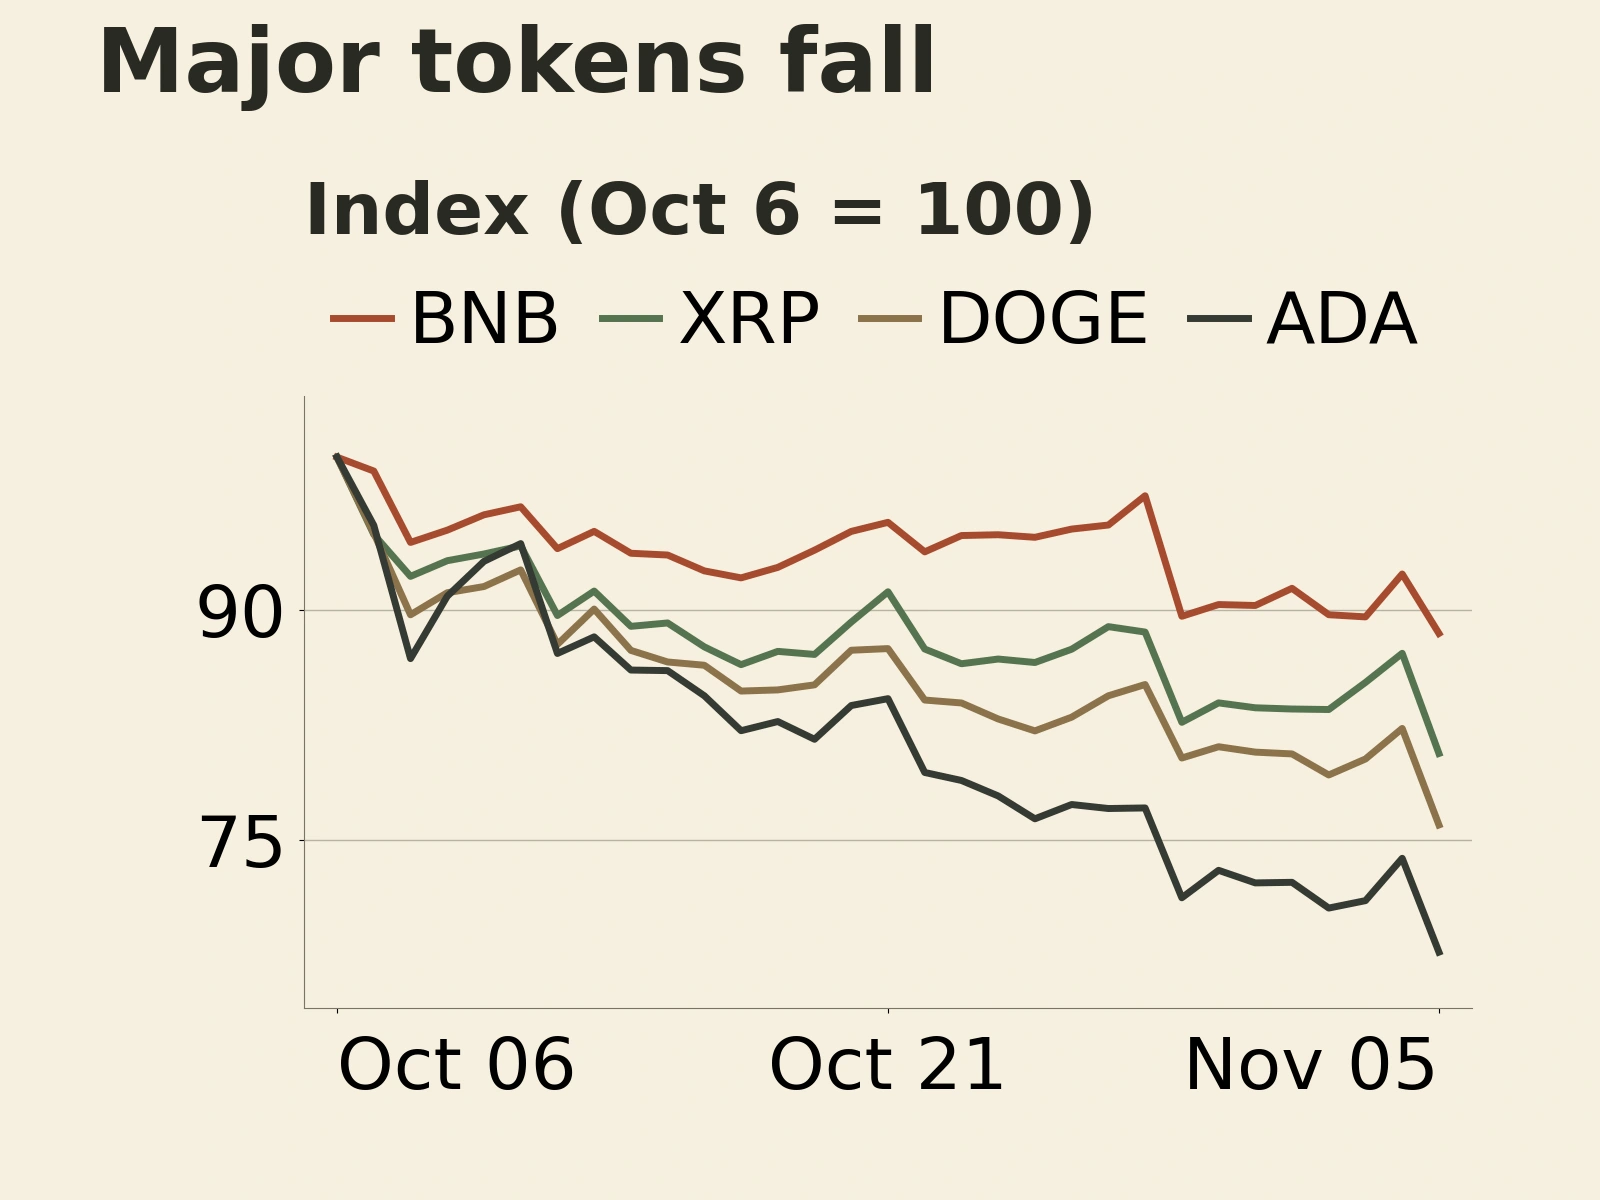
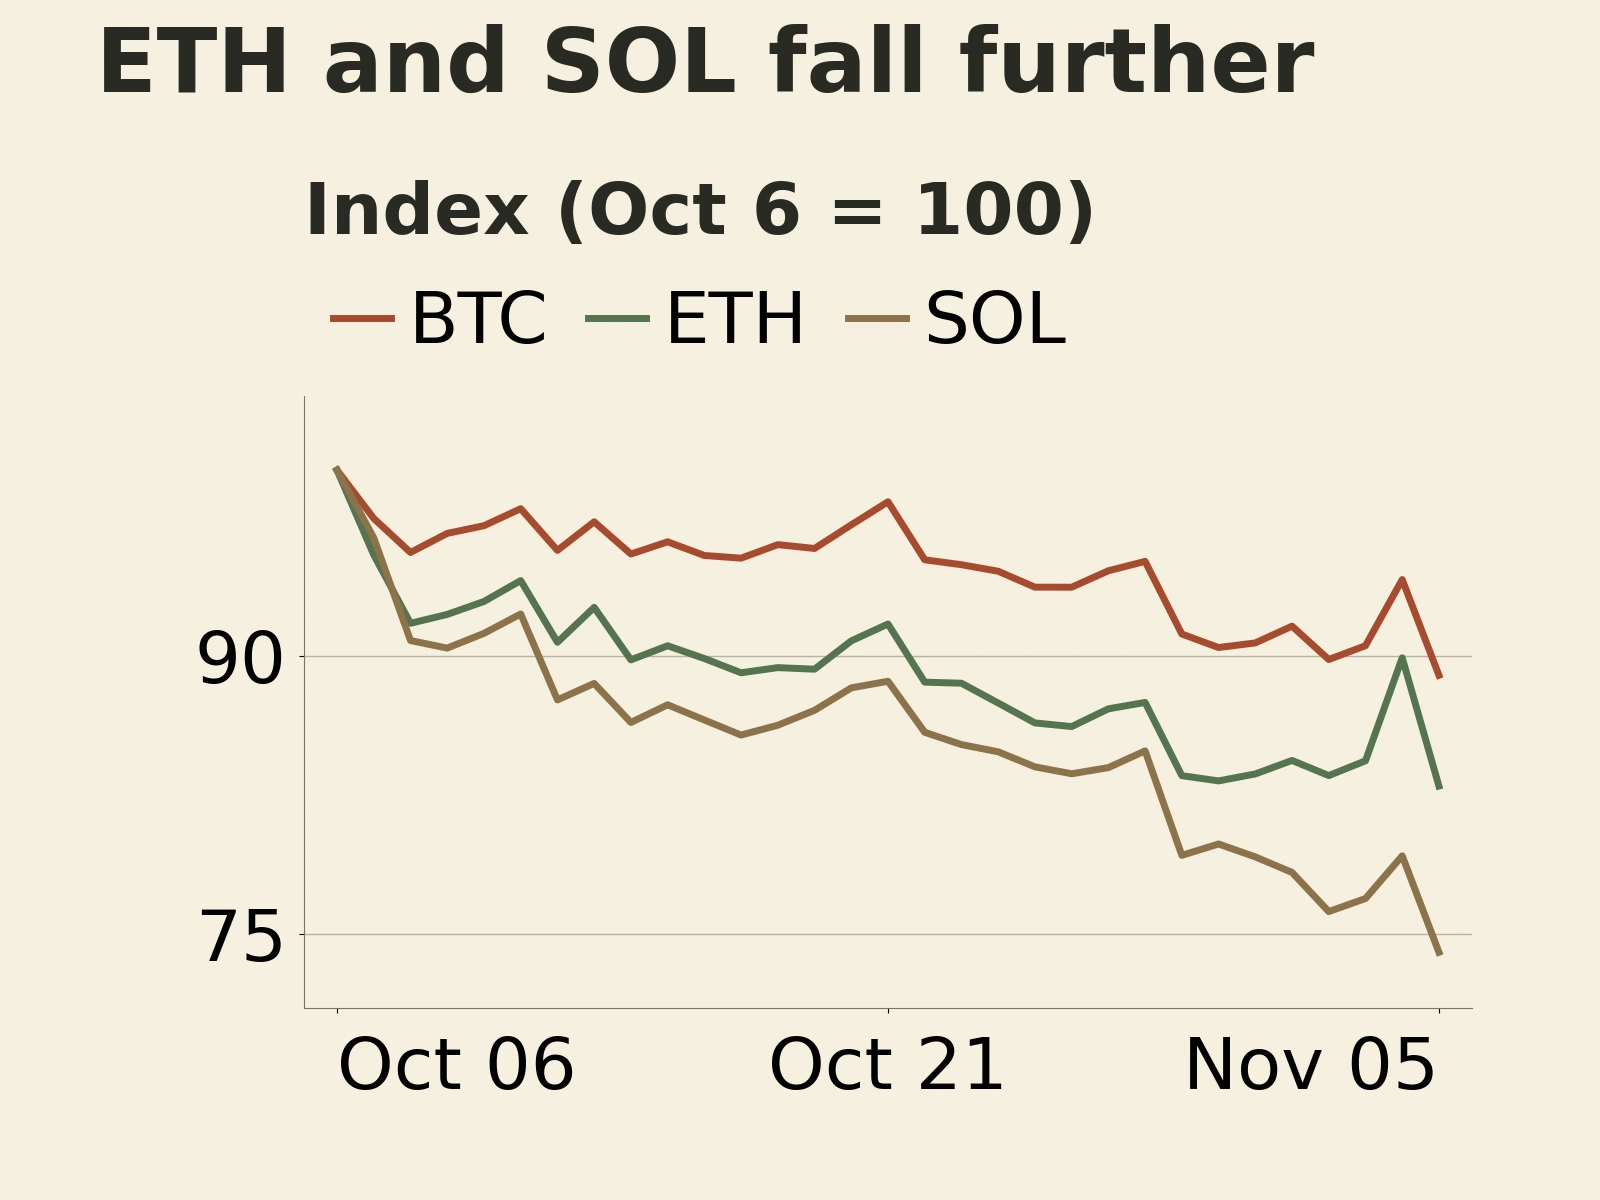
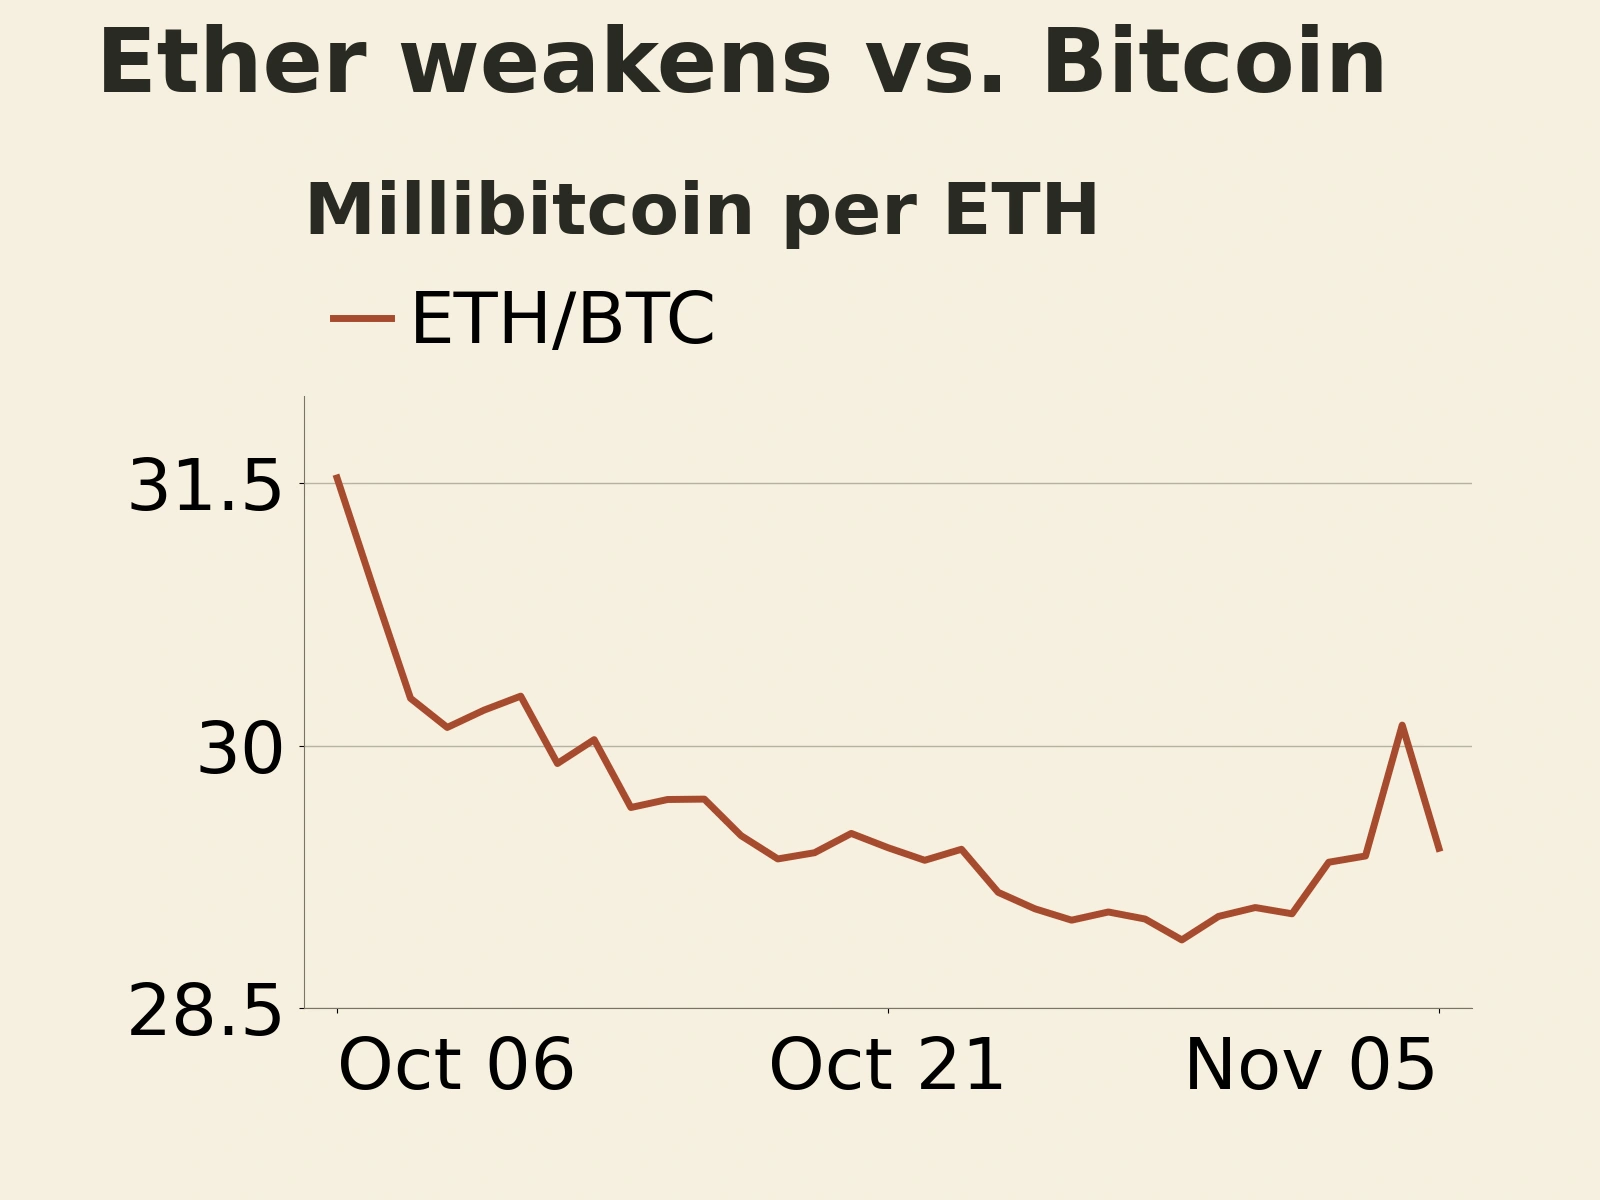
Relative prices offer another perspective. Using BTC/USDT and ETH/USDT closing prices at the same time, ETH/BTC fell from about 0.03012 the previous day to 0.02941, so one ETH continued to buy less BTC. From October 6 through November 5, BTC fell 11.06%, ETH 17.03% and SOL 26.00%. ETH/BTC declined about 6.72% over the same period. Ether had already been underperforming Bitcoin before the sharp selloff, and the November 5 move extended that trend.
CoinGecko data from around the end of November 5 UTC put Bitcoin at about 59.31% of total crypto market capitalization. That calculation includes stablecoins and other assets in the denominator, so it captures a different aspect of the market from trading-pair returns. Across the seven assets tracked here, major risk tokens came under broad pressure and BTC held up better than most.
Samsung Wallet adds Solana USDC access as SOL falls 6.57%
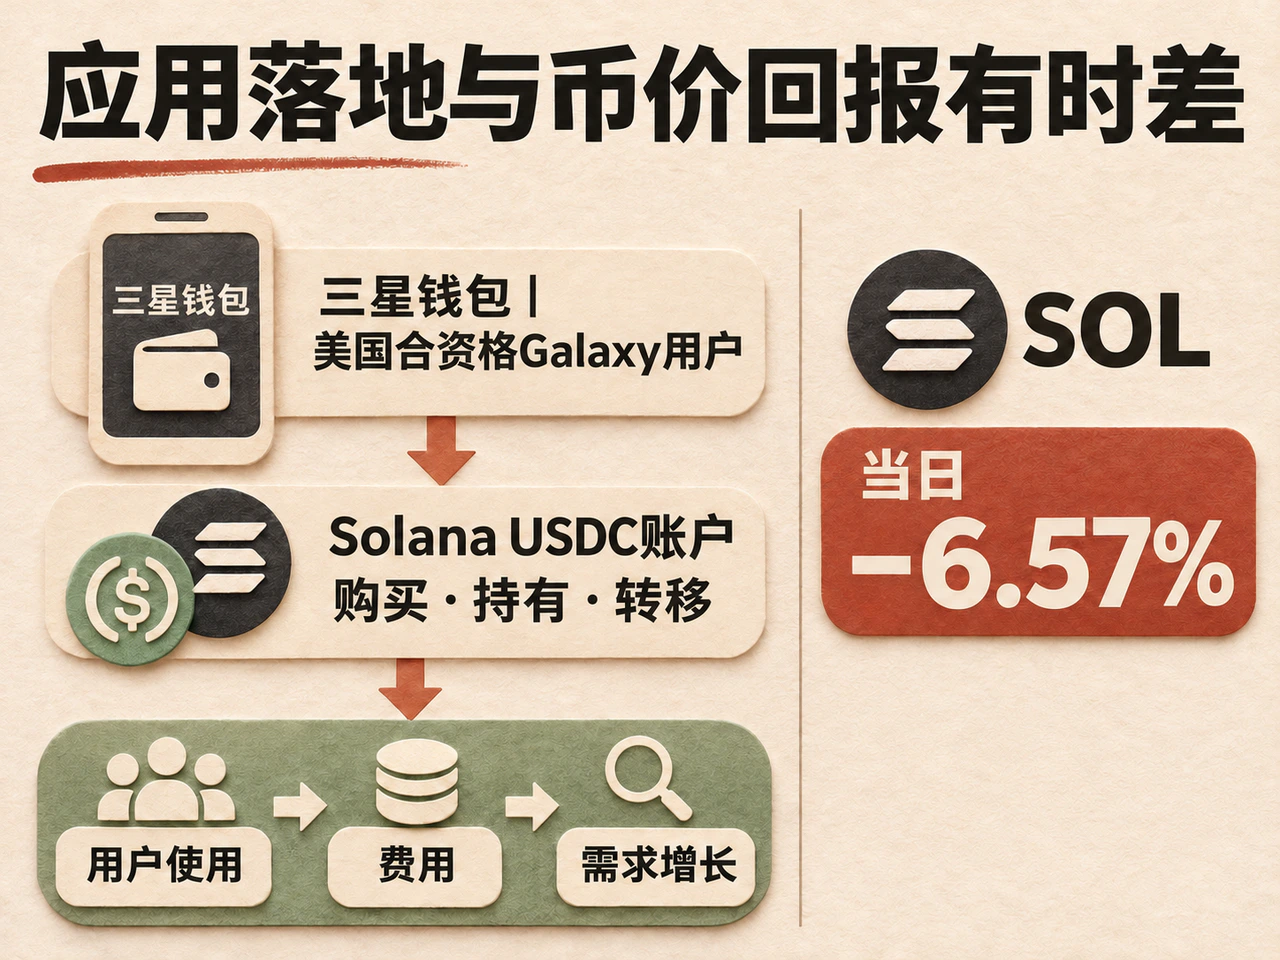
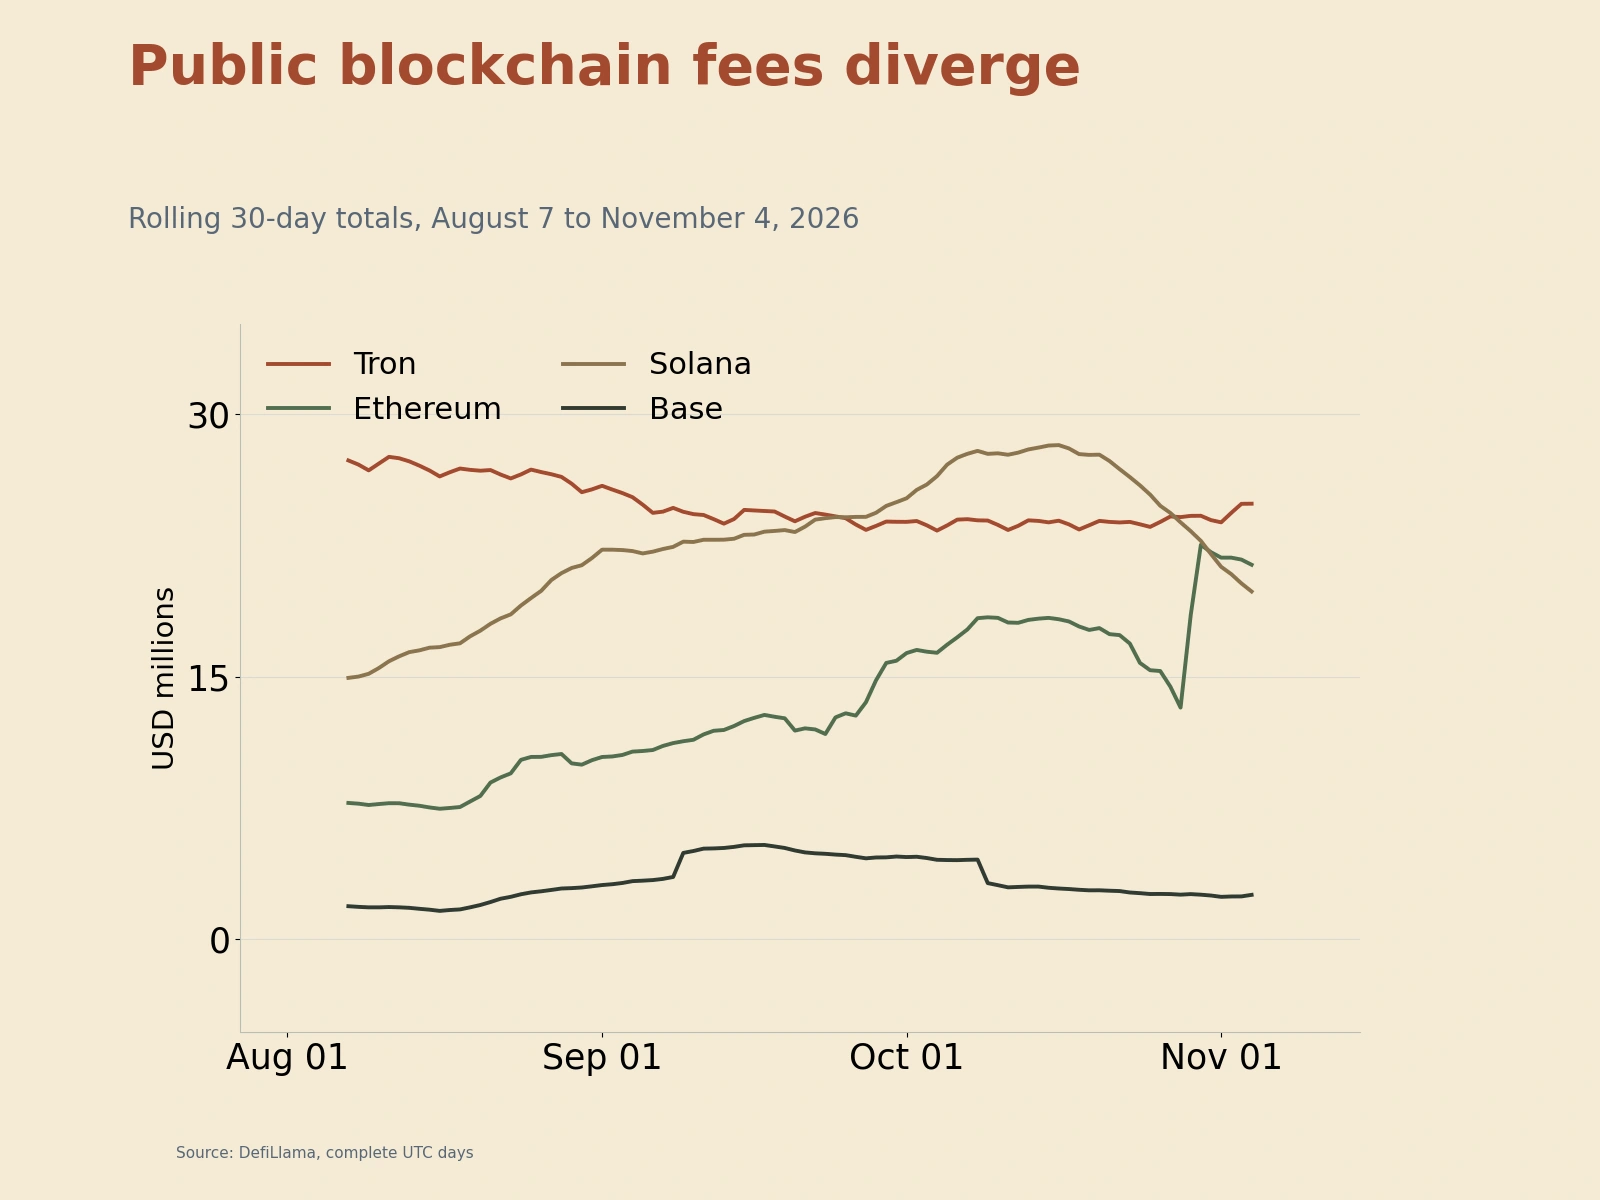
New uses for blockchain technology continued to emerge. The Block reported that Samsung Wallet confirmed on November 5 that eligible U.S. Galaxy users could open Solana-based USDC accounts to buy, hold and transfer the stablecoin. The rollout broadens the potential reach of blockchain payments, while SOL fell 6.57% that day. Wallet availability is only the first step. Sustained use would have to follow before network fees and demand for the token could grow, so short-term token returns can diverge sharply from the pace of adoption.
Crypto market commentators are also reassessing the role of elections. Santiment noted that day that Bitcoin's slide around the 2022 midterms coincided with the FTX crisis, and that comparing prices by election dates alone can obscure what drove the move. The same applies now. Stabilization will depend on whether technology-stock selling eases, whether spot buying holds up and whether ETH/BTC and the breadth of gains among major tokens improve. If any one-day rebound remains concentrated in a handful of assets, the recovery will still have a narrow base.
Click through to read the original article for more details.