On November 5, 2026, crypto markets saw another wave of deleveraging. U.S. spot Bitcoin and Ether ETFs returned to modest net inflows in the previous trading session, while the circulating market capitalization of dollar-pegged stablecoins continued to decline. Buying returned in parts of the market even as the pool of available capital shrank.
One day of ETF inflows leaves most of the earlier outflows unrecovered

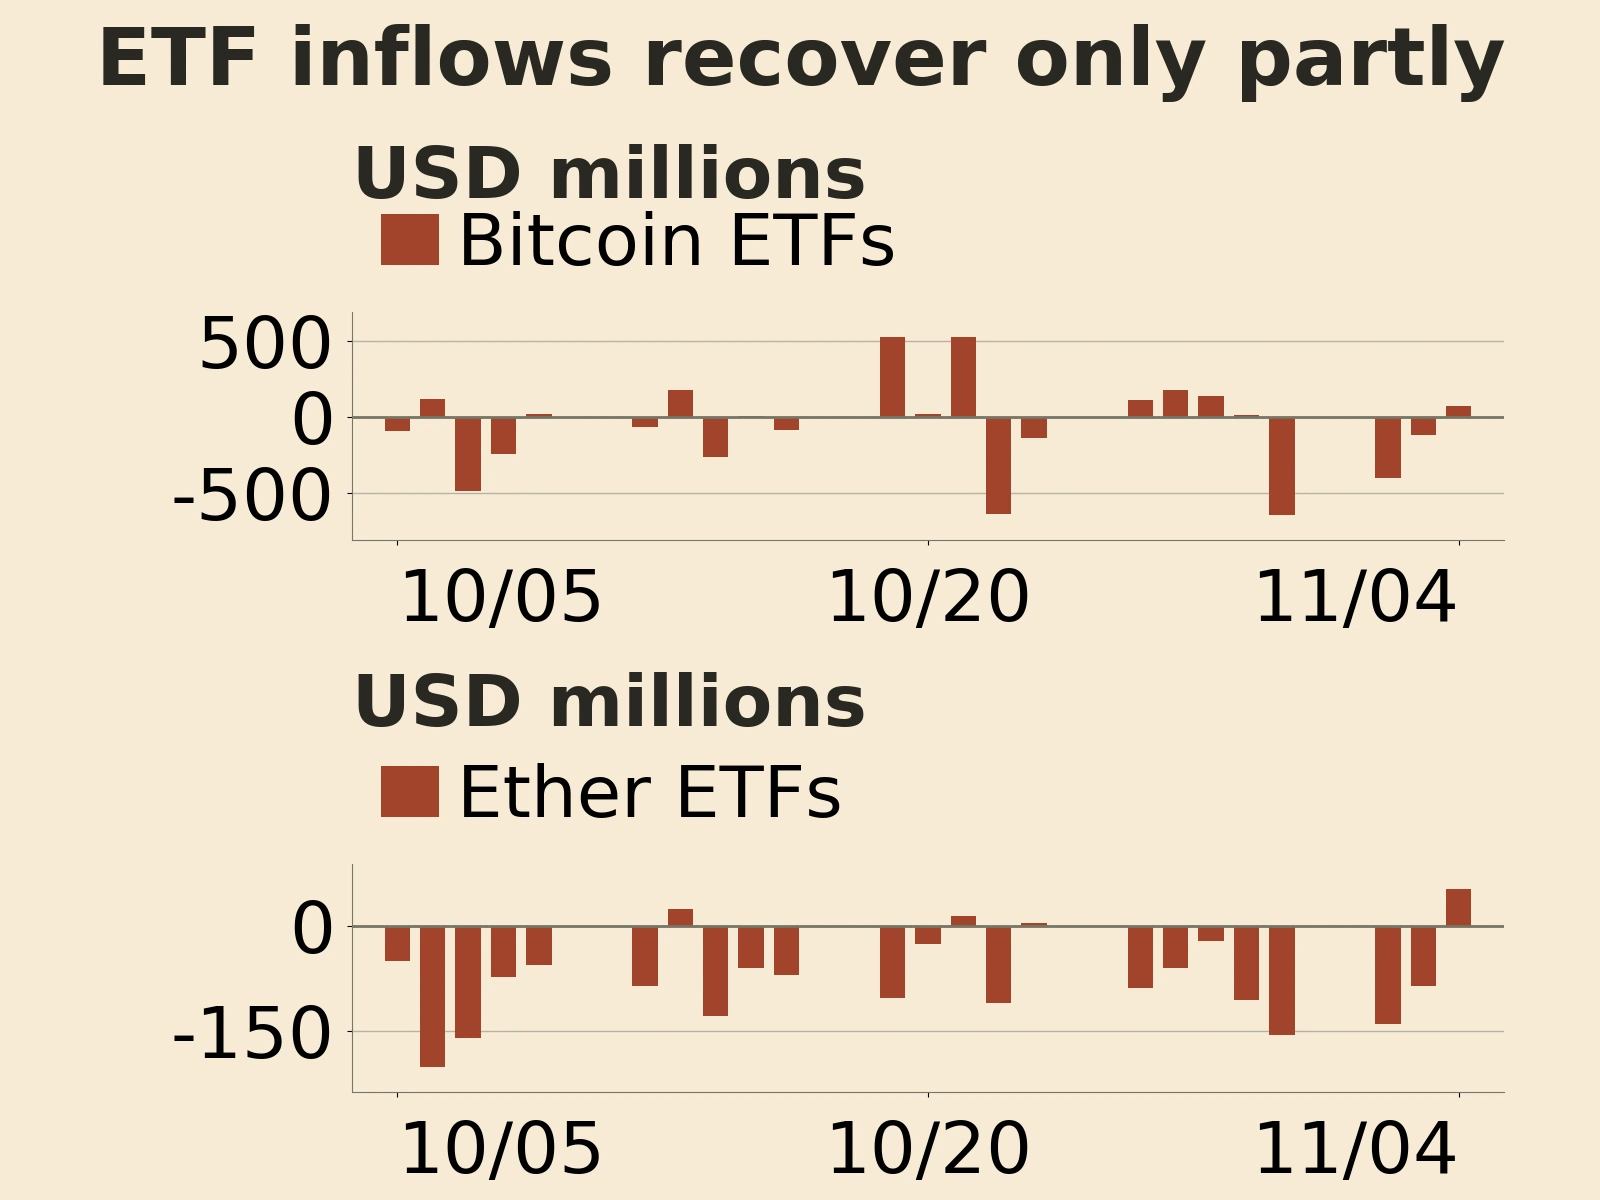
Farside’s U.S. trading-day data show that spot Bitcoin ETFs took in a net $74.6 million on November 4, ending three consecutive sessions of outflows. Net outflows were $643.2 million on October 30, $398.6 million on November 2 and $115.6 million on November 3, for a total of $1.1574 billion. The November 4 inflow recovered only about 6.4% of those outflows, leaving a net $1.0828 billion in outflows over the four sessions.
Flows varied widely across funds. On November 4, Fidelity’s FBTC took in $236.7 million while BlackRock’s IBIT lost $201.2 million. The other funds together contributed a smaller net inflow. Aggregate flows turned positive even as the two largest funds moved in opposite directions. Client allocations, trading arrangements and distribution channels may all contribute to differences between funds. Subscriptions and redemptions measure flows at the fund level and offer limited insight into institutional positioning as a whole.
Ether ETFs also recovered some ground. They drew a net $53.0 million on November 4 after losing $380.7 million over the three trading sessions from October 30 through November 3. The inflow recouped about 14% of the earlier outflows, leaving a four-session net outflow of $327.7 million. Inflows resumed in both Bitcoin and Ether ETFs on the same day, but neither group made up its recent outflows. Whether the buying persists remains to be seen.
Stablecoin market capitalization falls $5.51 billion in seven days
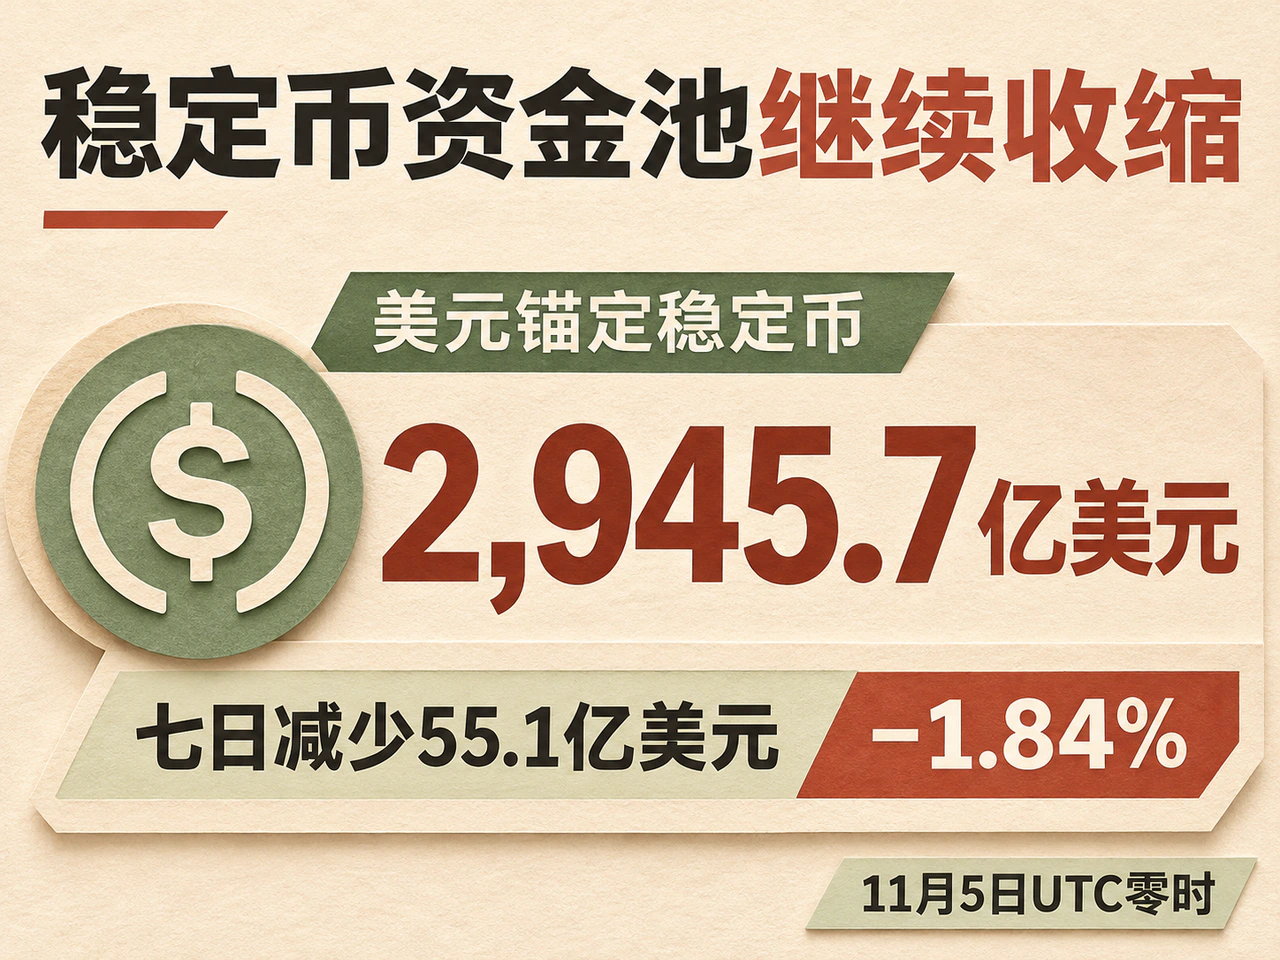
DefiLlama data put the circulating market capitalization of dollar-pegged stablecoins at about $294.57 billion at 00:00 UTC on November 5, down about $561 million from the previous day. It fell about $5.51 billion, or 1.84%, in the seven days since October 29. Compared with about $307.77 billion on October 6, the total was down about $13.20 billion, or 4.29%, over 30 days. That leaves a smaller pool of dollar-pegged assets available for on-chain settlement, lending and trading.
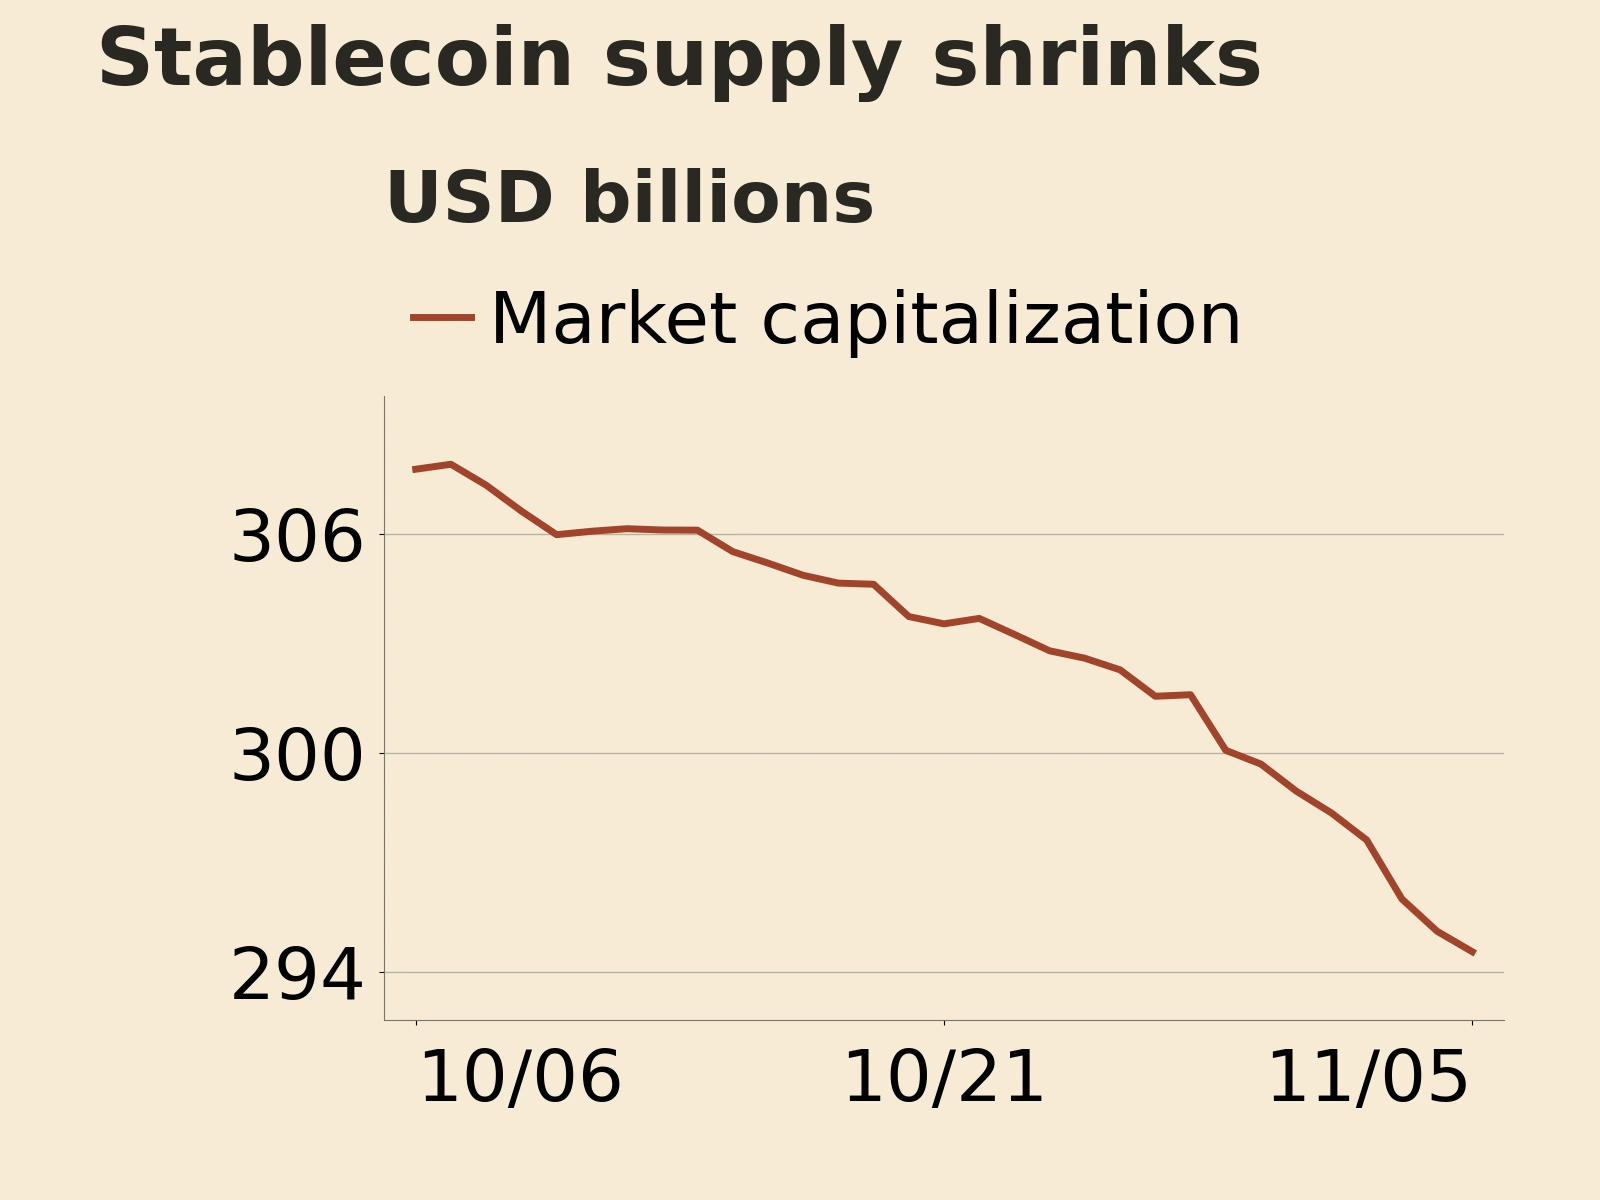
Stablecoins serve as a means of payment, collateral and a trading asset. A fall in their circulating market capitalization does not imply an equal amount of Bitcoin selling. Stablecoin market capitalization tracks the supply of on-chain funding, while ETF subscriptions and redemptions track allocation shifts in securities accounts. A brief return to ETF inflows can support spot demand, but the continued contraction in stablecoins shows that on-chain dollar funding has yet to expand alongside it. With the two channels moving at different speeds, a price rebound depends more heavily on the redeployment of existing capital and on incremental buying.
Long liquidations cluster in a few hours as funding rates diverge

Citing CoinGlass data, crypto.news reported at 19:02 UTC on November 5 that liquidations totaled about $1.08 billion over the preceding 24 hours. Longs accounted for 88.2% of the total, with $954.38 million liquidated, versus $127.30 million in shorts. Liquidations in the latest four hours reached $896.18 million, including $817.35 million in longs.
Those rolling figures reflect the positions that were forced out as selling accelerated that day. When margin on long positions falls below requirements, forced closures add sell orders to a falling market. The more liquidations cluster in a short period, the more market depth is needed to absorb them at once.
Perpetual futures funding rates varied by contract and settlement. On Binance, BTCUSDT settled at 0.002405%, 0.01% and 0.01% at 00:00, 08:00 and 16:00 UTC on November 5, respectively. ETHUSDT settled at −0.002650%, 0.005731% and 0.01%. These rates settle every eight hours. A positive rate means longs pay shorts. Ether funding briefly went negative early in the day before turning positive again, while Bitcoin funding stayed positive at all three settlements. The exchange has yet to see a sustained shift to shorts paying longs. The direction of payments still varies across contracts and settlement times.
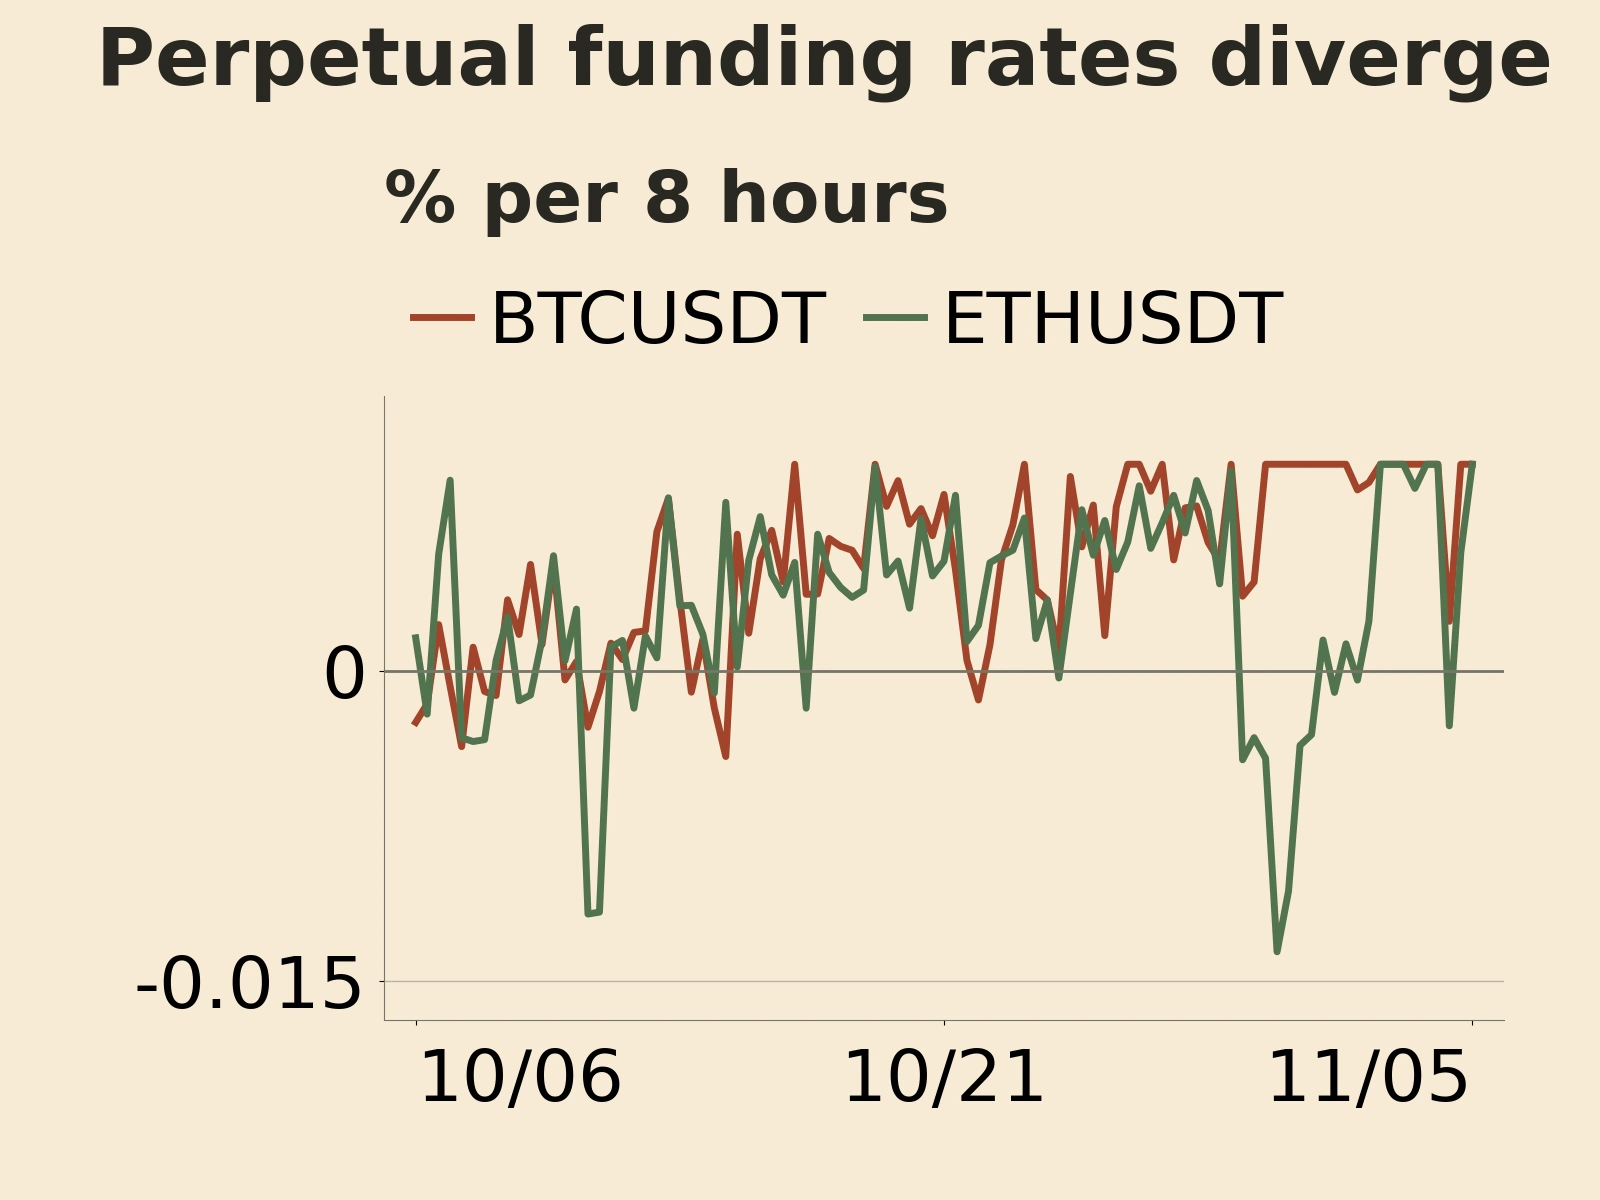
Funding rates indicate the relative cost of holding positions, while liquidation data show which positions were forcibly closed. Positive funding can coexist with a wave of long liquidations. Gauging whether leverage pressure has eased requires watching how well prices hold after the liquidations, whether funding rates stabilize and whether allocations to spot assets continue to draw inflows. The wave of liquidations cleared some positions, but the strength of subsequent buying will help determine how long the adjustment lasts.
ETF flows have recovered for a single day, stablecoin supply is still falling, and leveraged markets have just seen a concentrated bout of selling. A more durable improvement would require sustained ETF inflows and a halt to the decline in on-chain dollar funding. Until then, episodes of renewed inflows may continue to alternate with bouts of deleveraging, leaving prices sensitive to short-term shifts in funding.
Read the original article for more details.