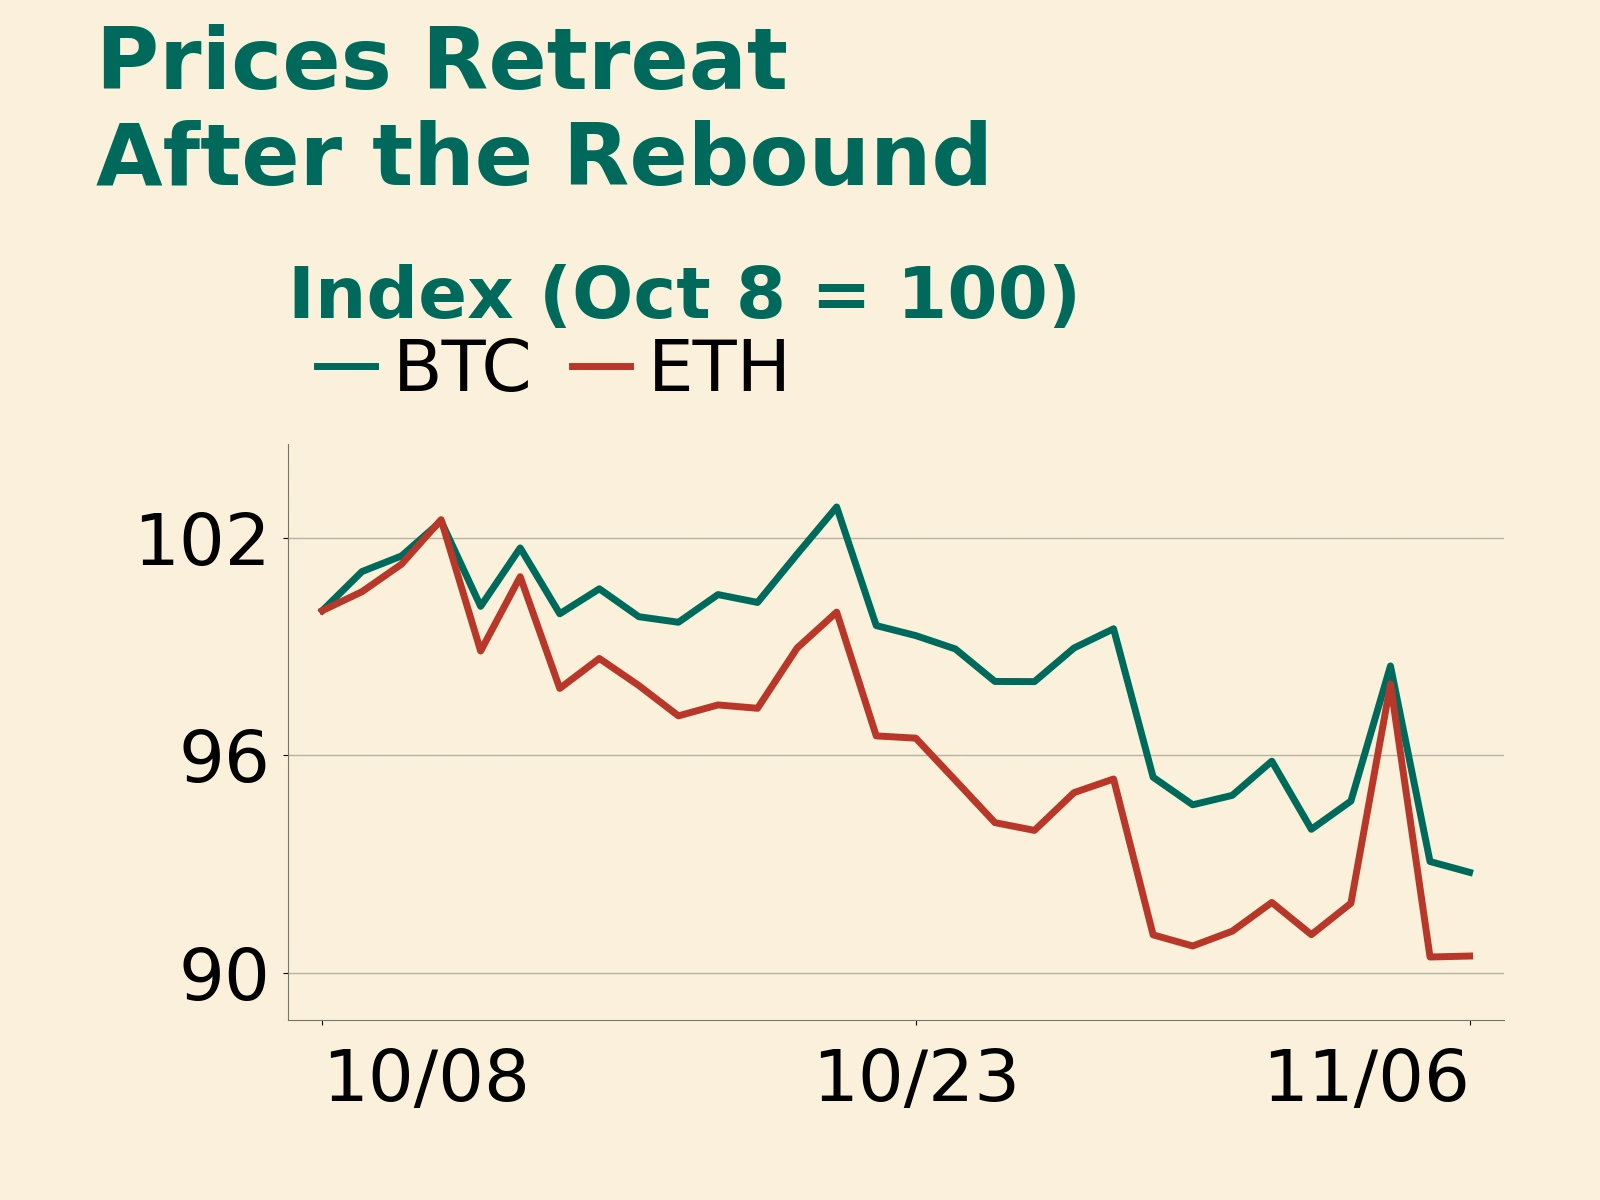
On November 6, 2026, the United States released a stronger-than-expected October jobs report. U.S. equities rebounded, with the Nasdaq Composite closing up about 1.1%, but crypto markets did not recover in tandem. At the close of Binance's UTC spot trading day, at 8 a.m. Beijing time on November 7, Bitcoin stood at 75,844 USDT, down 0.32%, after briefly falling below 75,000 USDT during the session. Ether closed at 2,238.67 USDT, edging up 0.03%. Both recovered from intraday lows reached after the U.S. stock market opened, but Bitcoin remained below the previous day's close and Ether regained only a little ground.
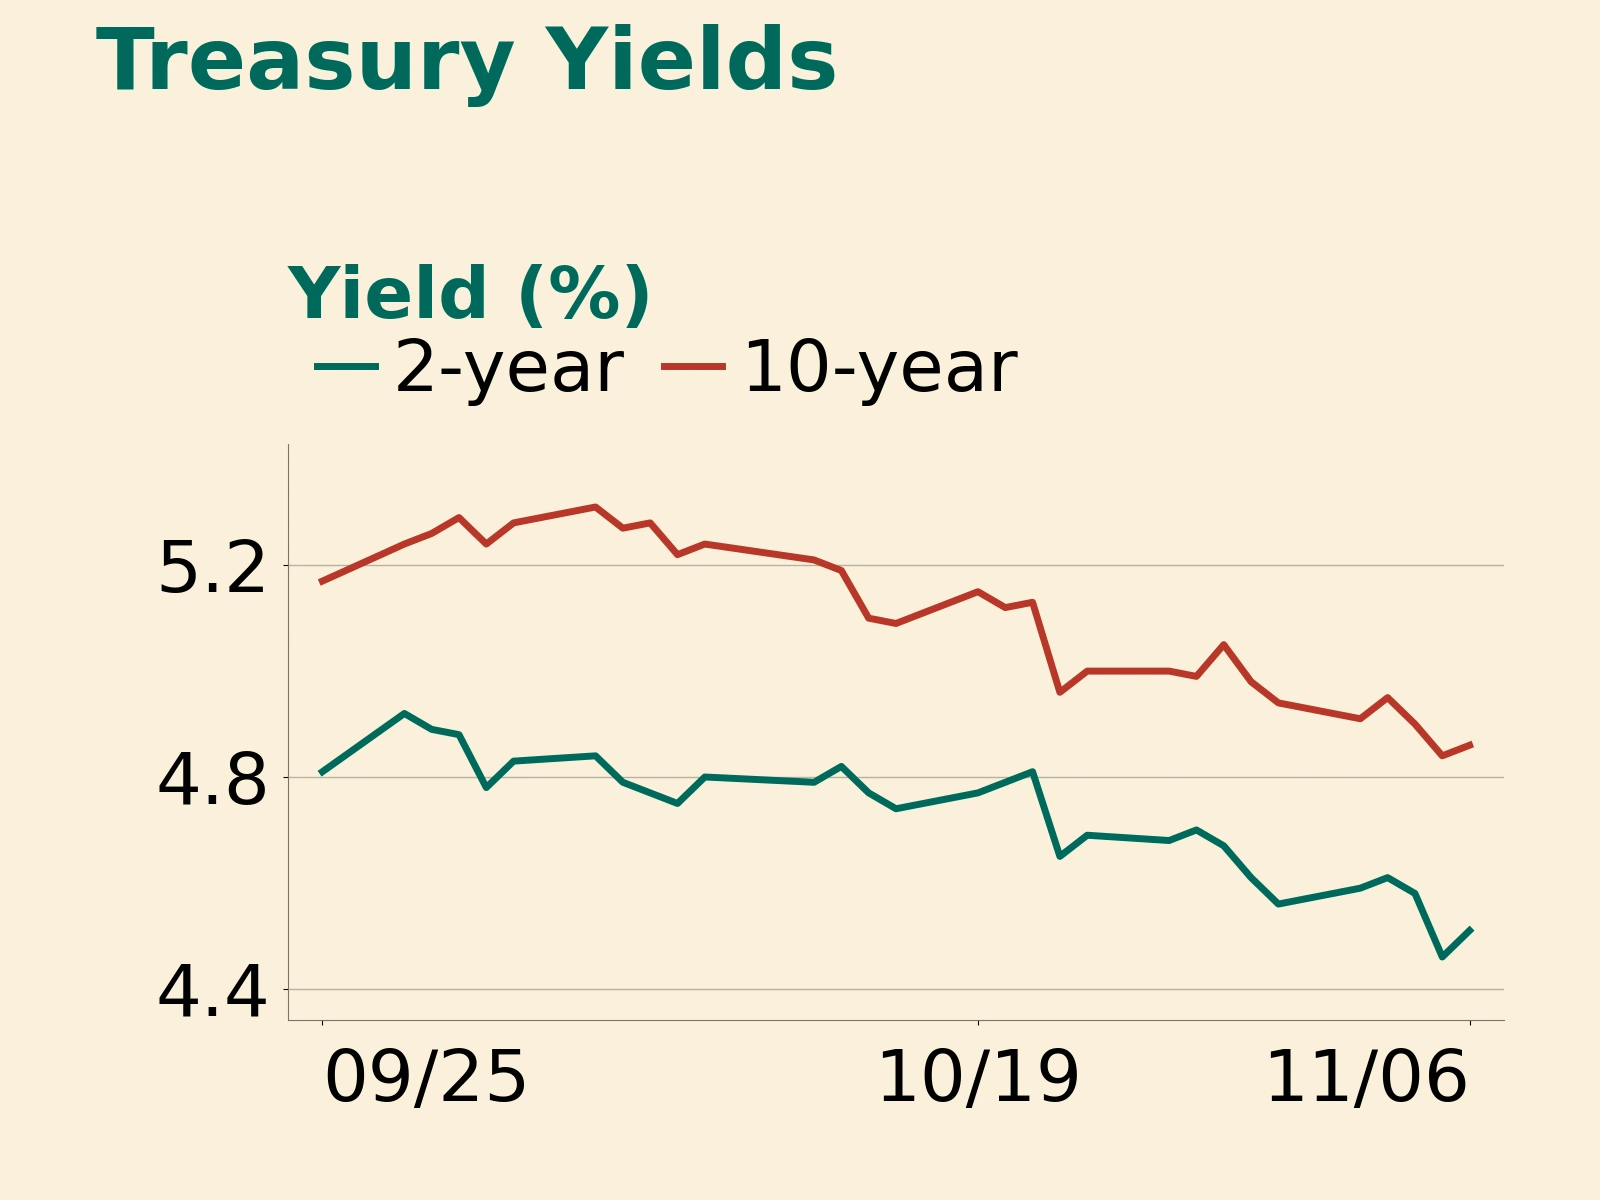
Short-term yields rise after the payrolls beat, while the equity rebound leaves Bitcoin behind

At 8:30 a.m. Eastern time on November 6, the U.S. Bureau of Labor Statistics reported that nonfarm payrolls increased by 165,000 in October and the unemployment rate was 4.1%. The consensus forecast compiled by Charles Schwab had called for an increase of 65,000. The U.S. Treasury's daily yield curve showed the two-year yield rising from 4.46% to 4.51% and the ten-year yield from 4.84% to 4.86%. The larger increase at the short end was consistent with the rise in expectations of a December rate hike that Charles Schwab observed that day. Strong employment both eased concerns about an economic slowdown and led markets to price in more tightening.
Before the release, Bitcoin's most recent 15-minute close was approximately 76,044 USDT. The first 15-minute period after the release closed at 75,804.43 USDT. In the 15-minute interval beginning half an hour after U.S. equities opened, Bitcoin and Ether reached their daily lows of 74,888 USDT and 2,210 USDT, respectively. Bitcoin later returned to around 75,800 USDT, still below its level before the data release. Ether reached its intraday high of 2,254.26 USDT after U.S. equities closed. The S&P 500 finished up 0.31%, with semiconductor shares rebounding after the previous day's sharp sell-off. Cointelegraph also documented the divergence that day, with technology shares rising after the U.S. open while Bitcoin fell.
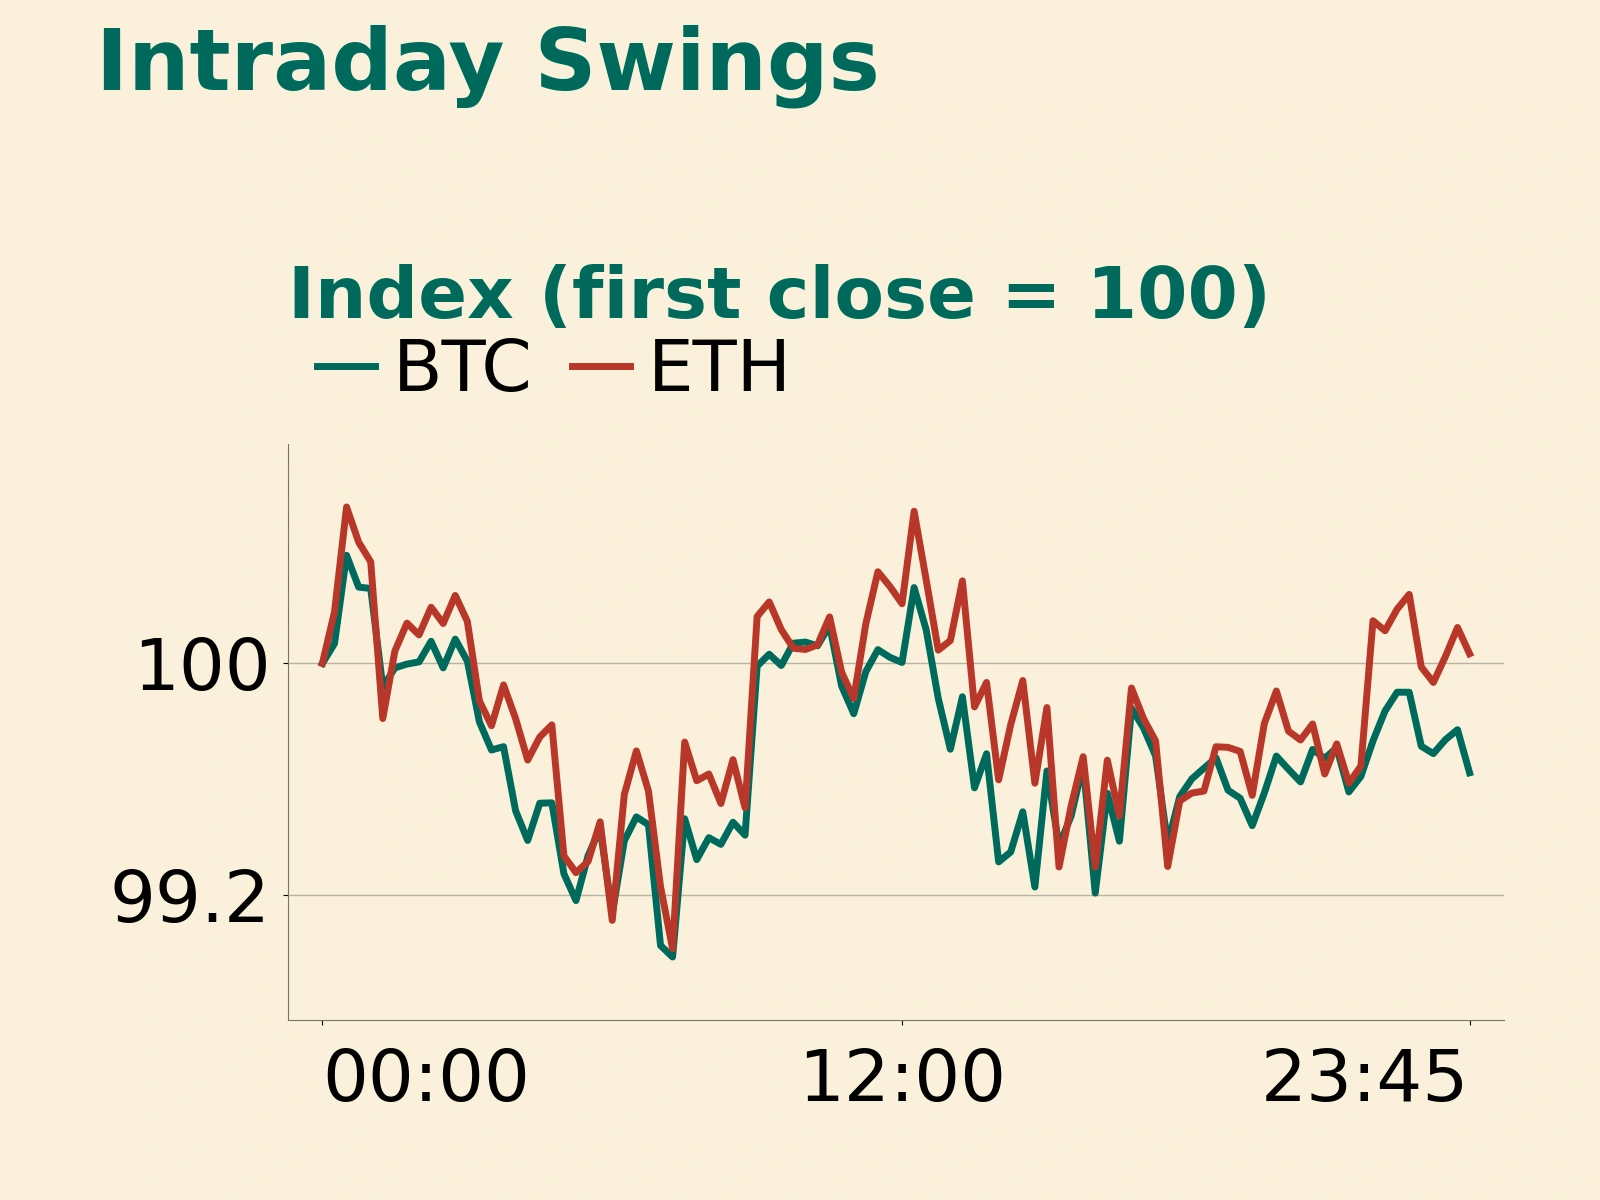
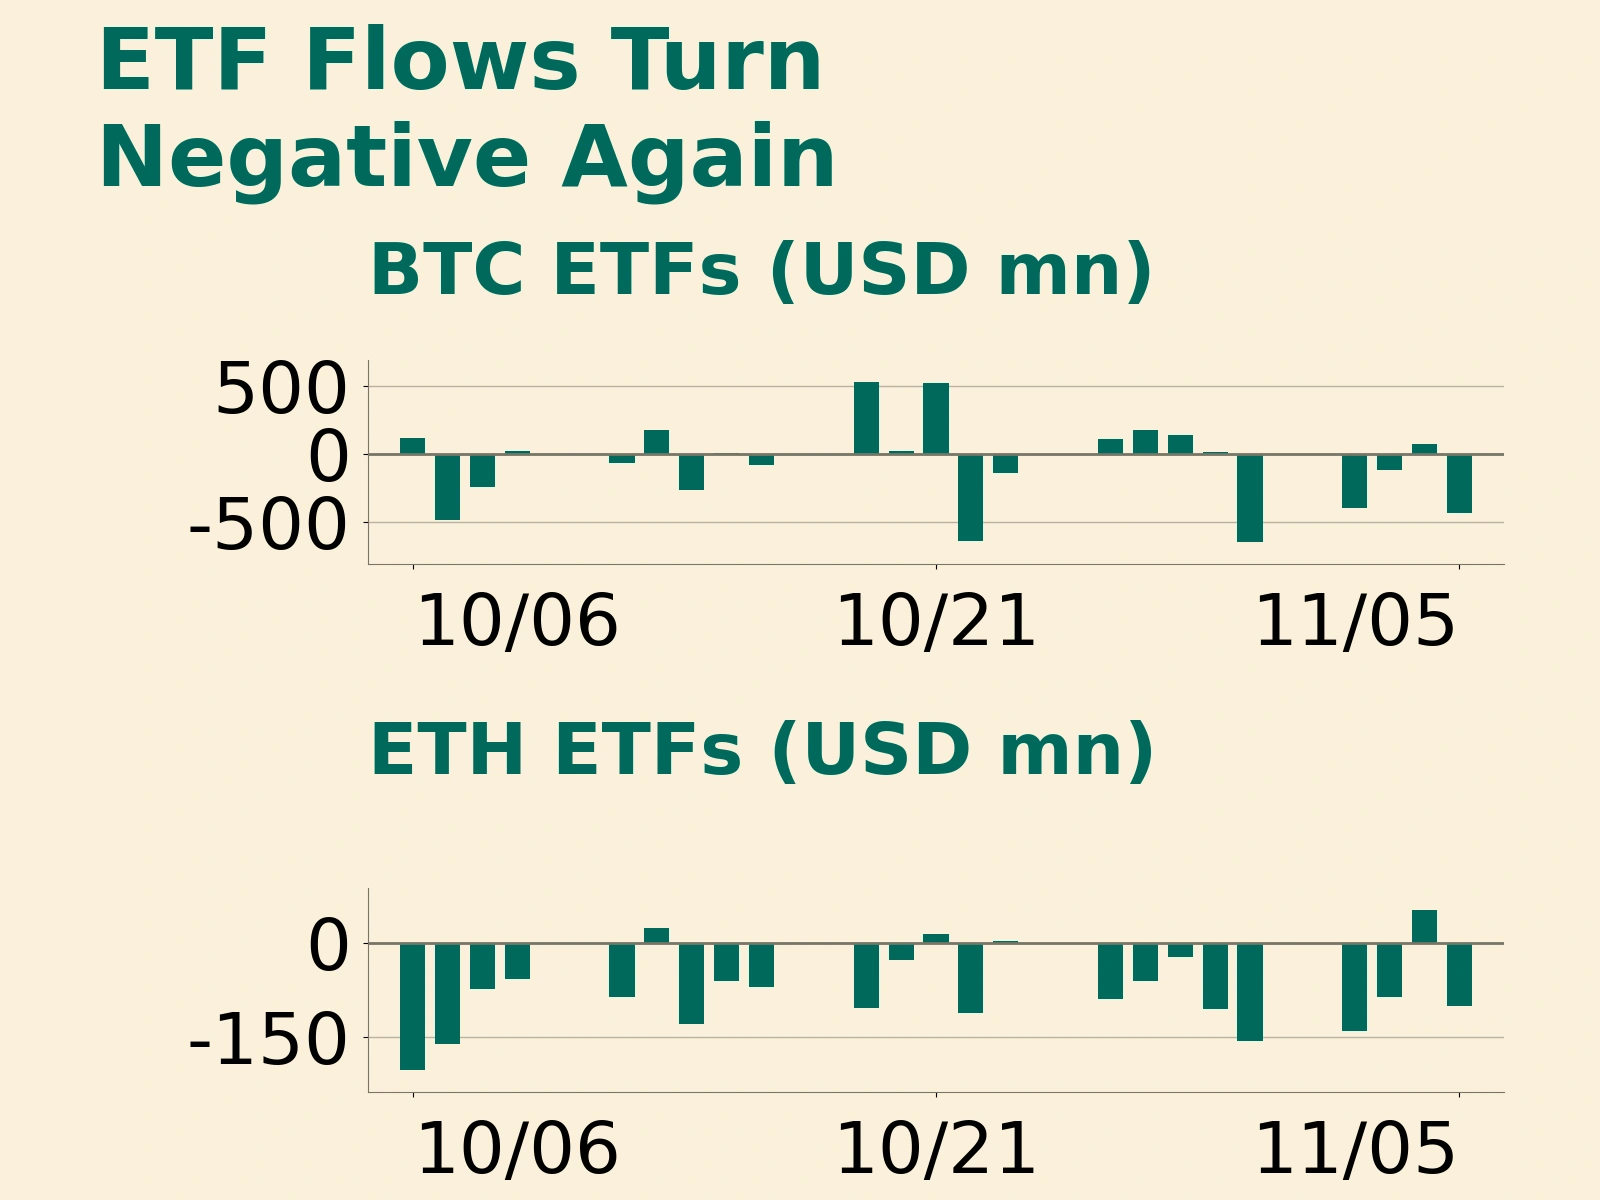
In the previous session, both asset classes had fallen together. The Nasdaq declined 5.52%, while Bitcoin and Ether fell 5.49% and 7.70%, respectively, on their UTC daily candles. On November 6, U.S. equities saw a rebound in sectors that had come under pressure the day before, while crypto assets continued to absorb the earlier selling. Farside data showed net outflows of $430.2 million from U.S. spot Bitcoin ETFs on November 5, following net inflows of $74.6 million in the preceding session. The shift from inflows to outflows showed that the allocation demand seen during the preceding rebound failed to persist into the next day. Together with rising Treasury yields and Bitcoin's price path after the jobs release, tighter financial conditions can explain part of the divergence. ETF net flows follow U.S. trading days and are used here to describe the previous day's allocation backdrop.
There was also a clear time gap between two risk events that day. Citing Deribit data, CryptoSlate reported that the relevant batch of Bitcoin options expired at 3 a.m. Eastern time, five and a half hours before the payrolls release. Positions relying on those options for risk management would have needed to switch to later-dated contracts to maintain protection through the jobs report. The day's price lows occurred about an hour and a half after the release, so the two points in time need to be examined separately.
Seven sampled coins rise, but combined turnover across all ten drops 37.23%

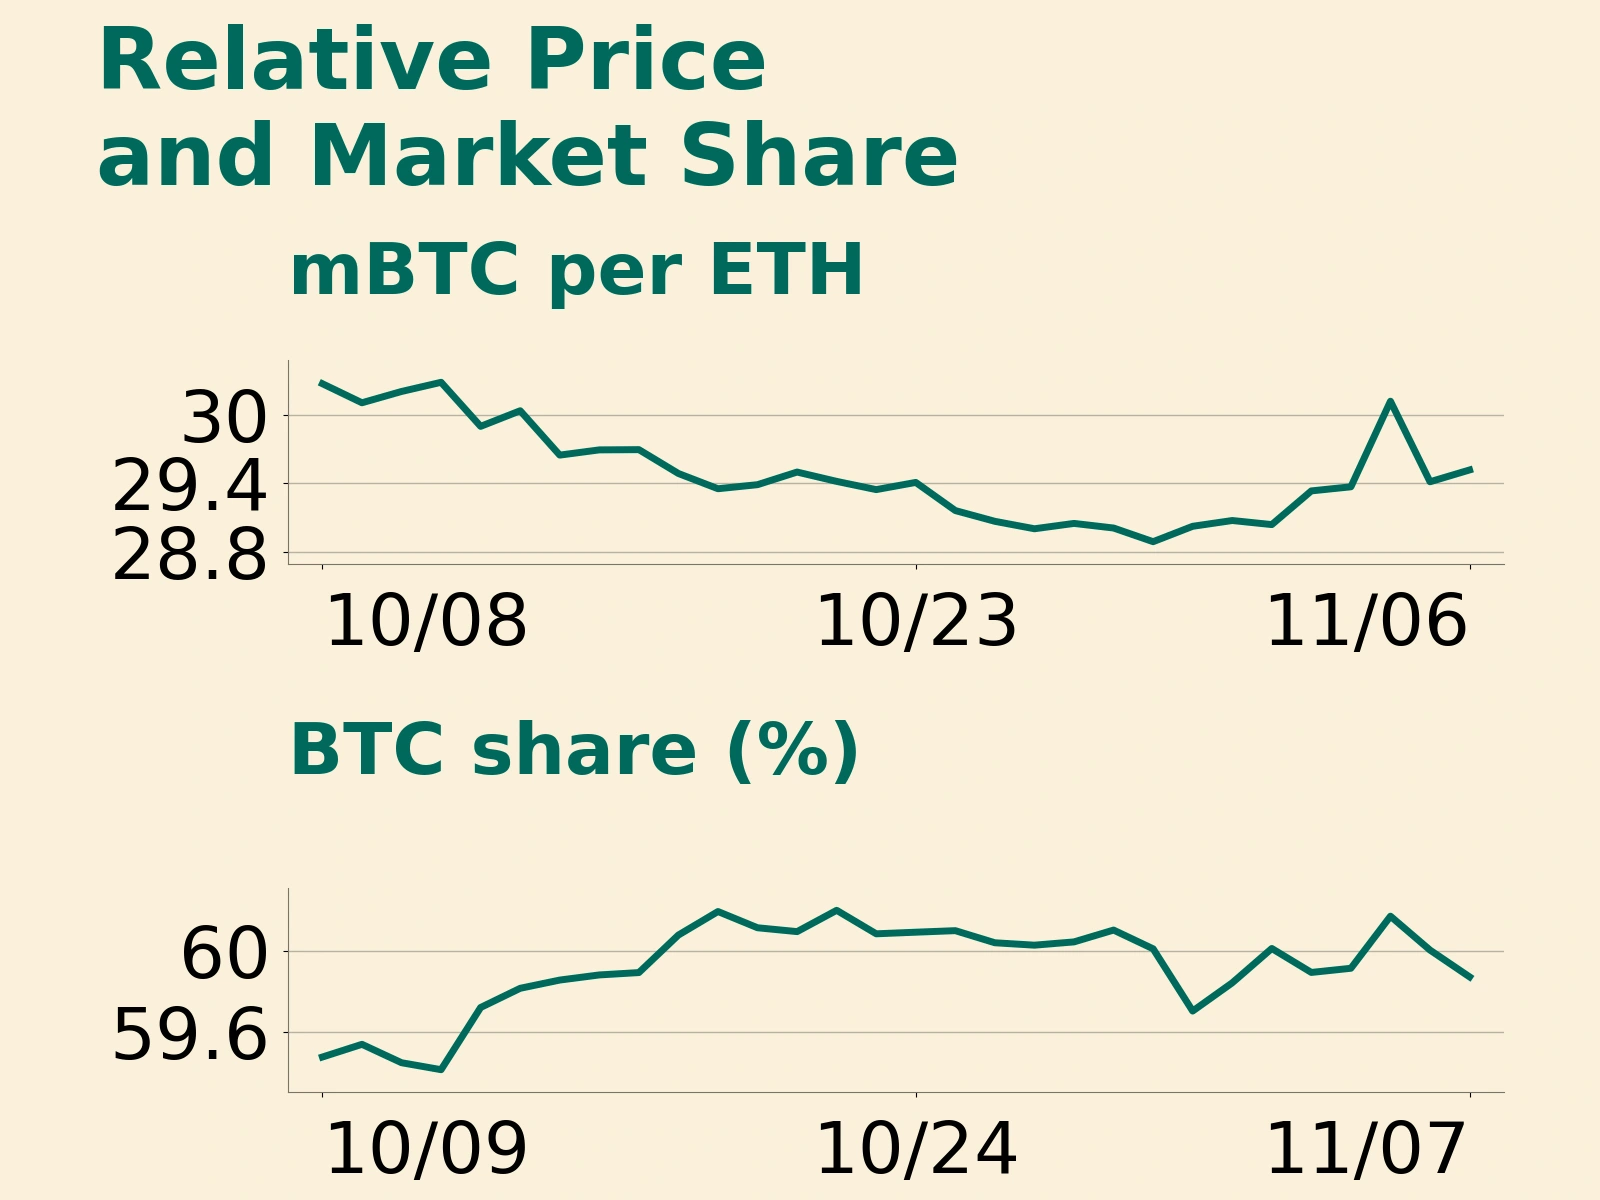
Of ten highly liquid Binance spot assets in the sample, seven rose and three fell. SOL stood at 90.13 USDT, up 0.90%, DOGE at 0.0724 USDT, up 1.77%, and AVAX at 8.343 USDT, up 2.07%. XRP fell 2.34% to 1.179 USDT, the largest decline in the sample. The Ether-to-Bitcoin closing-price ratio rose to 0.02952, up 0.35% from the previous day but still below its November 4 level of 0.03012. CoinMarketCap recorded Bitcoin's share of total crypto market capitalization at 59.87% at 00:00 UTC on November 7, slightly below 60.01% at the same time a day earlier.
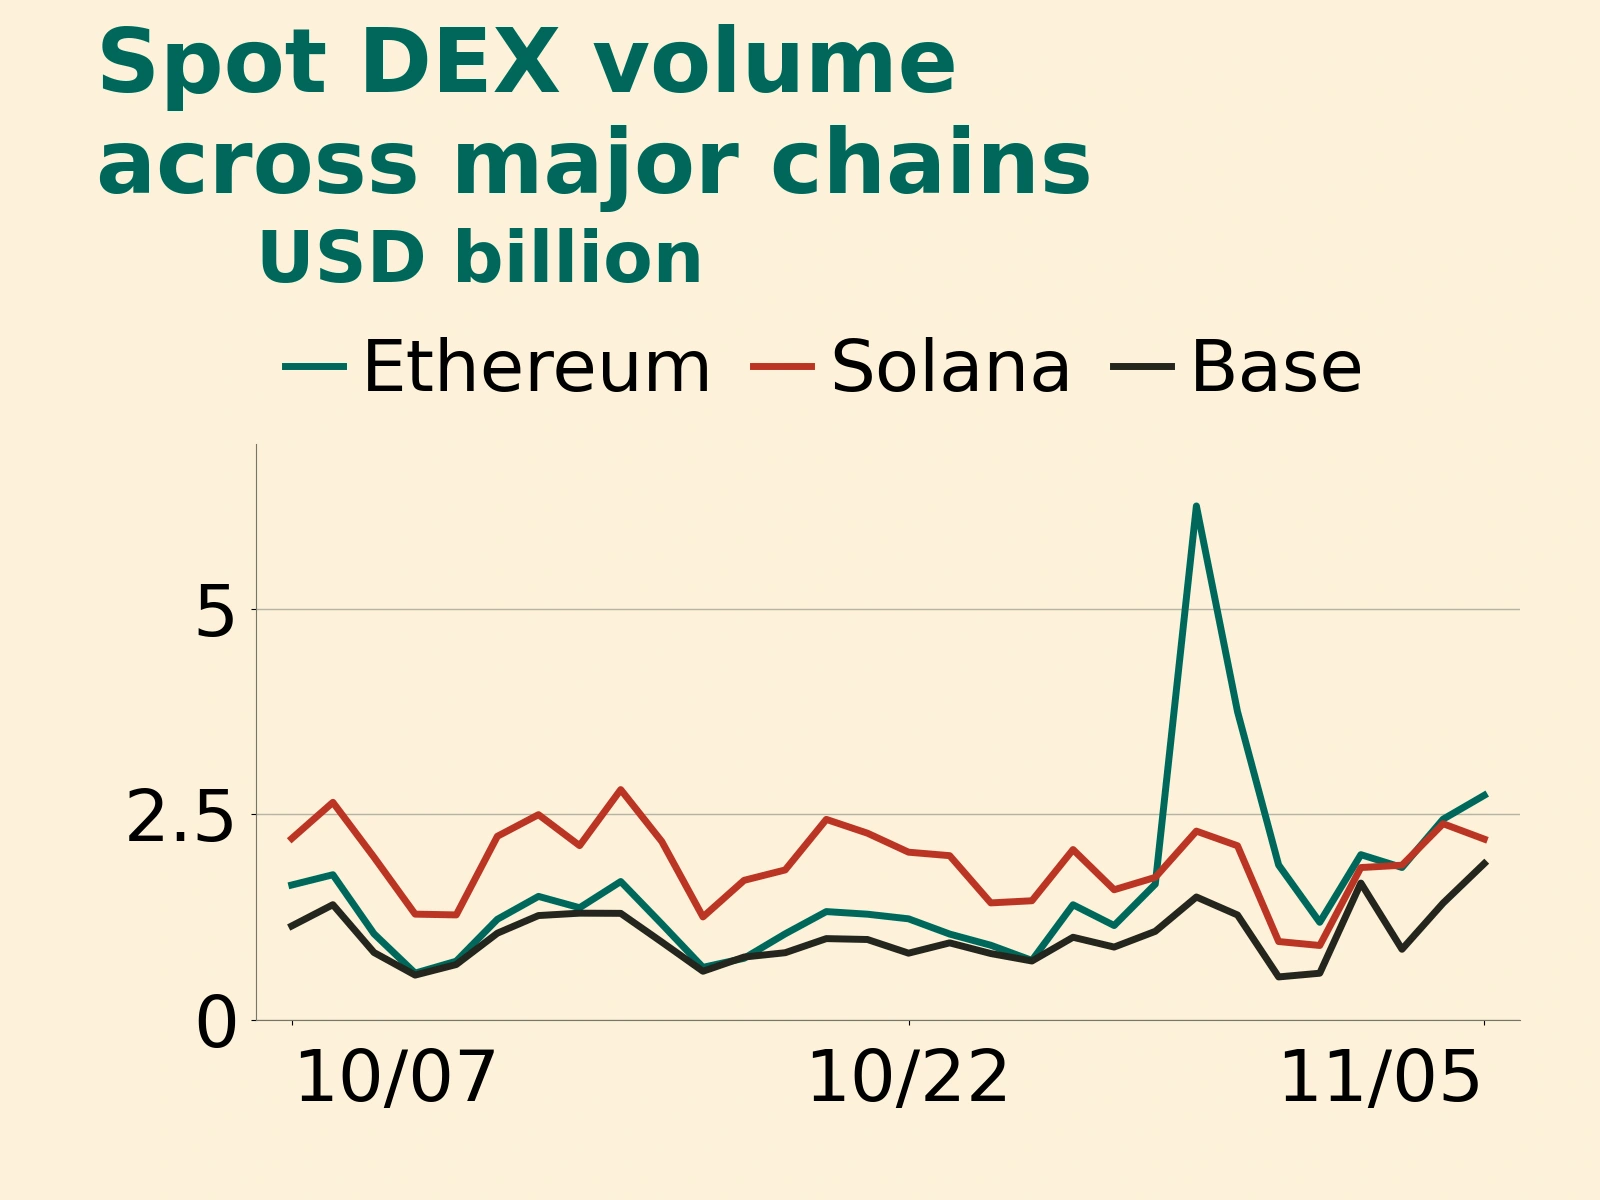
As price breadth improved, turnover declined across every asset in the sample. Combined turnover in the ten trading pairs was 2.211 billion USDT, down 37.23% from the previous session. Bitcoin accounted for 1.304 billion USDT, down 35.60%, and Ether for 470 million USDT, down 44.31%. The previous day's large swings created a high comparison base. Even against each asset's median turnover over the preceding 30 UTC trading days, however, eight of the ten remained below their own medians. Bitcoin and XRP were the exceptions, with turnover approximately 19% and 21% above their respective medians, yet both closed lower.
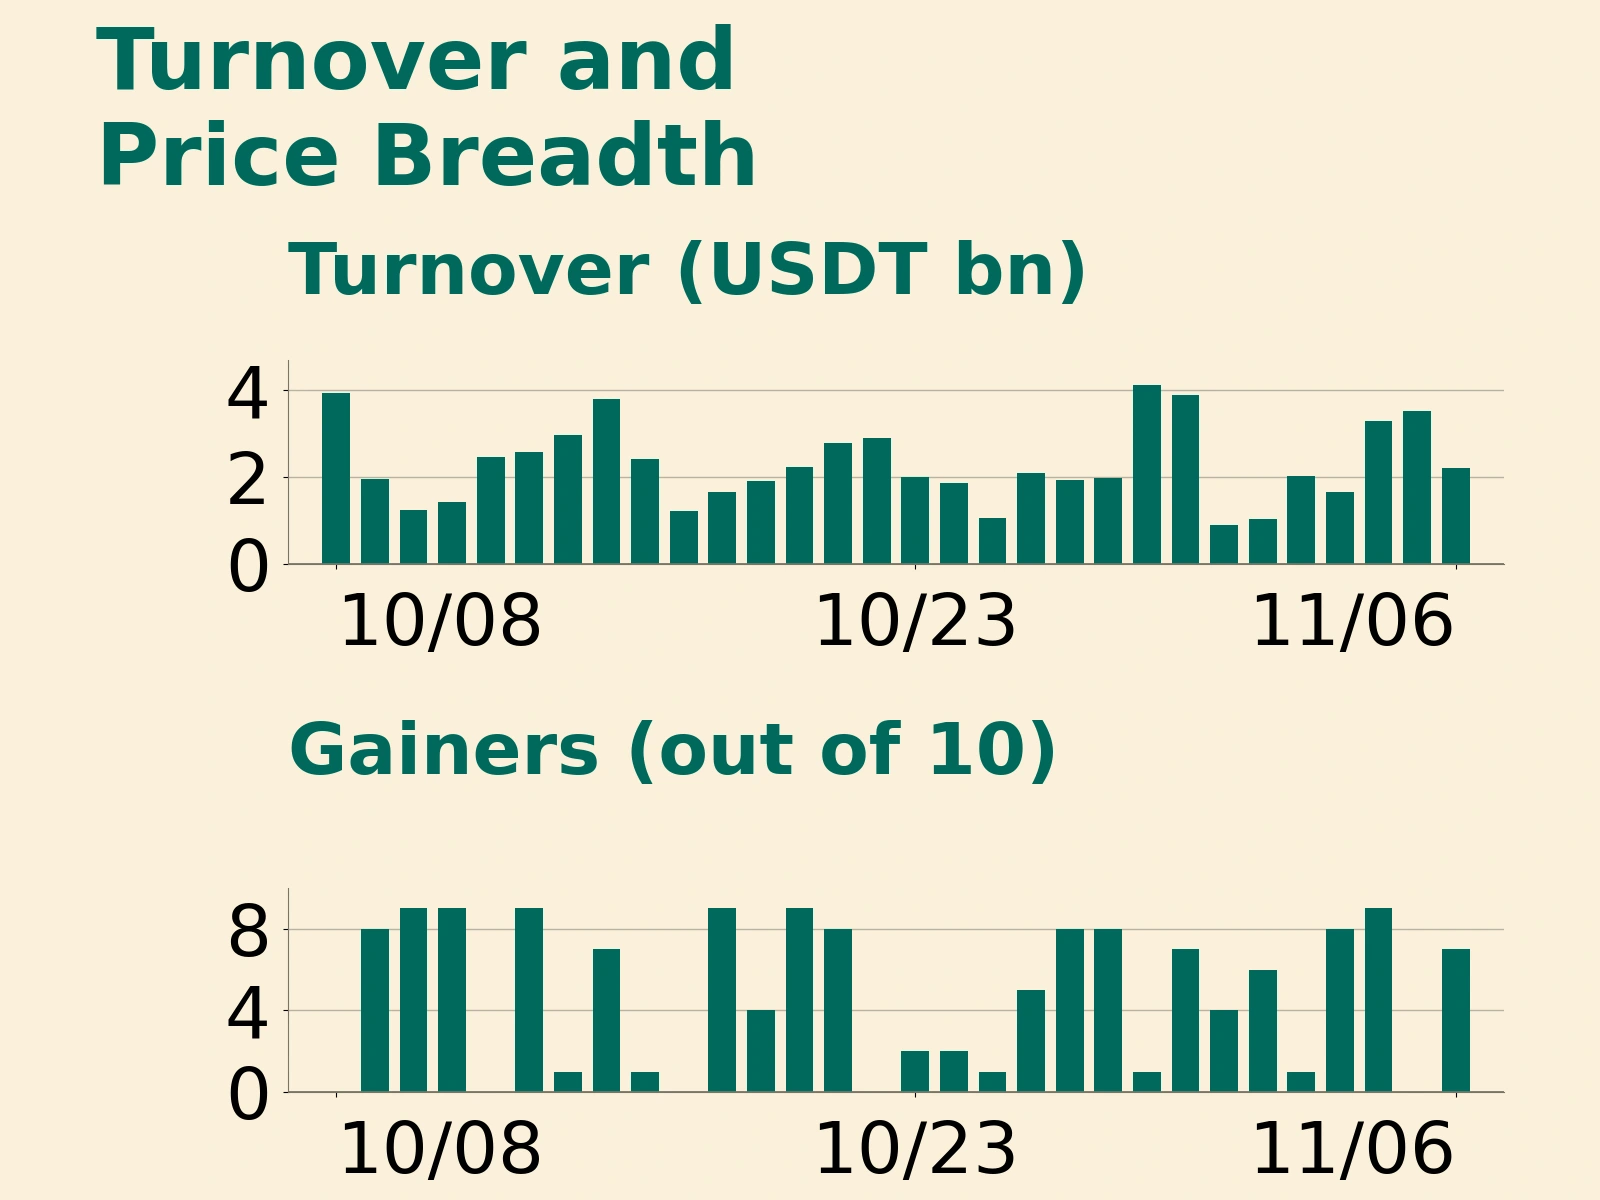
At the November 6 UTC daily close, Bitcoin and Ether were still 5.79% and 7.67% below their November 4 prices, respectively. Gains in seven sampled assets indicated a somewhat better balance between buying and selling after the preceding sell-off. Bitcoin and XRP closing lower despite turnover above their own medians showed that selling pressure was receding at different speeds across assets. Keith Alan, co-founder of trading analytics platform Material Indicators, also identified trading activity and rising short-term highs and lows that day as conditions to watch for stabilization. A return by Bitcoin to its price range before the November 6 jobs release, a continued recovery in Ether relative to Bitcoin, and a return to normal turnover in more of the rising coins would provide firmer grounds for judging that the recovery was broadening.
Click Read Original for further details.