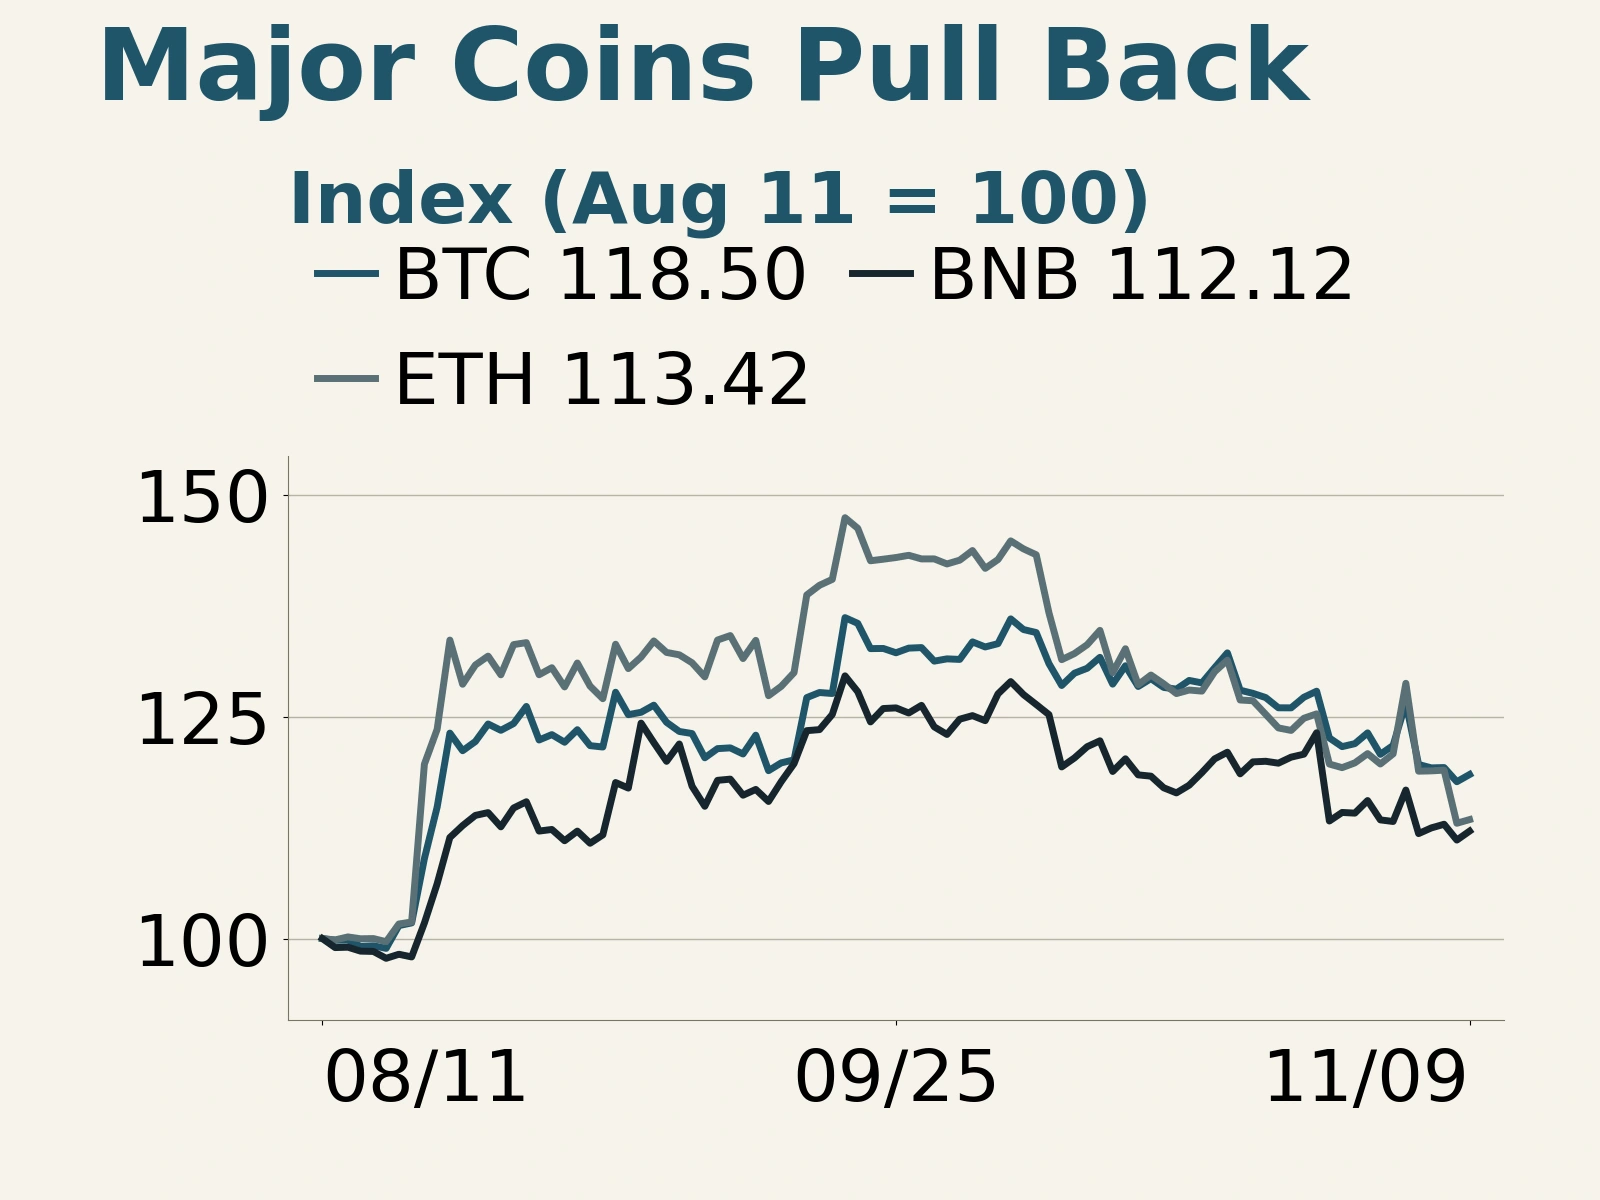
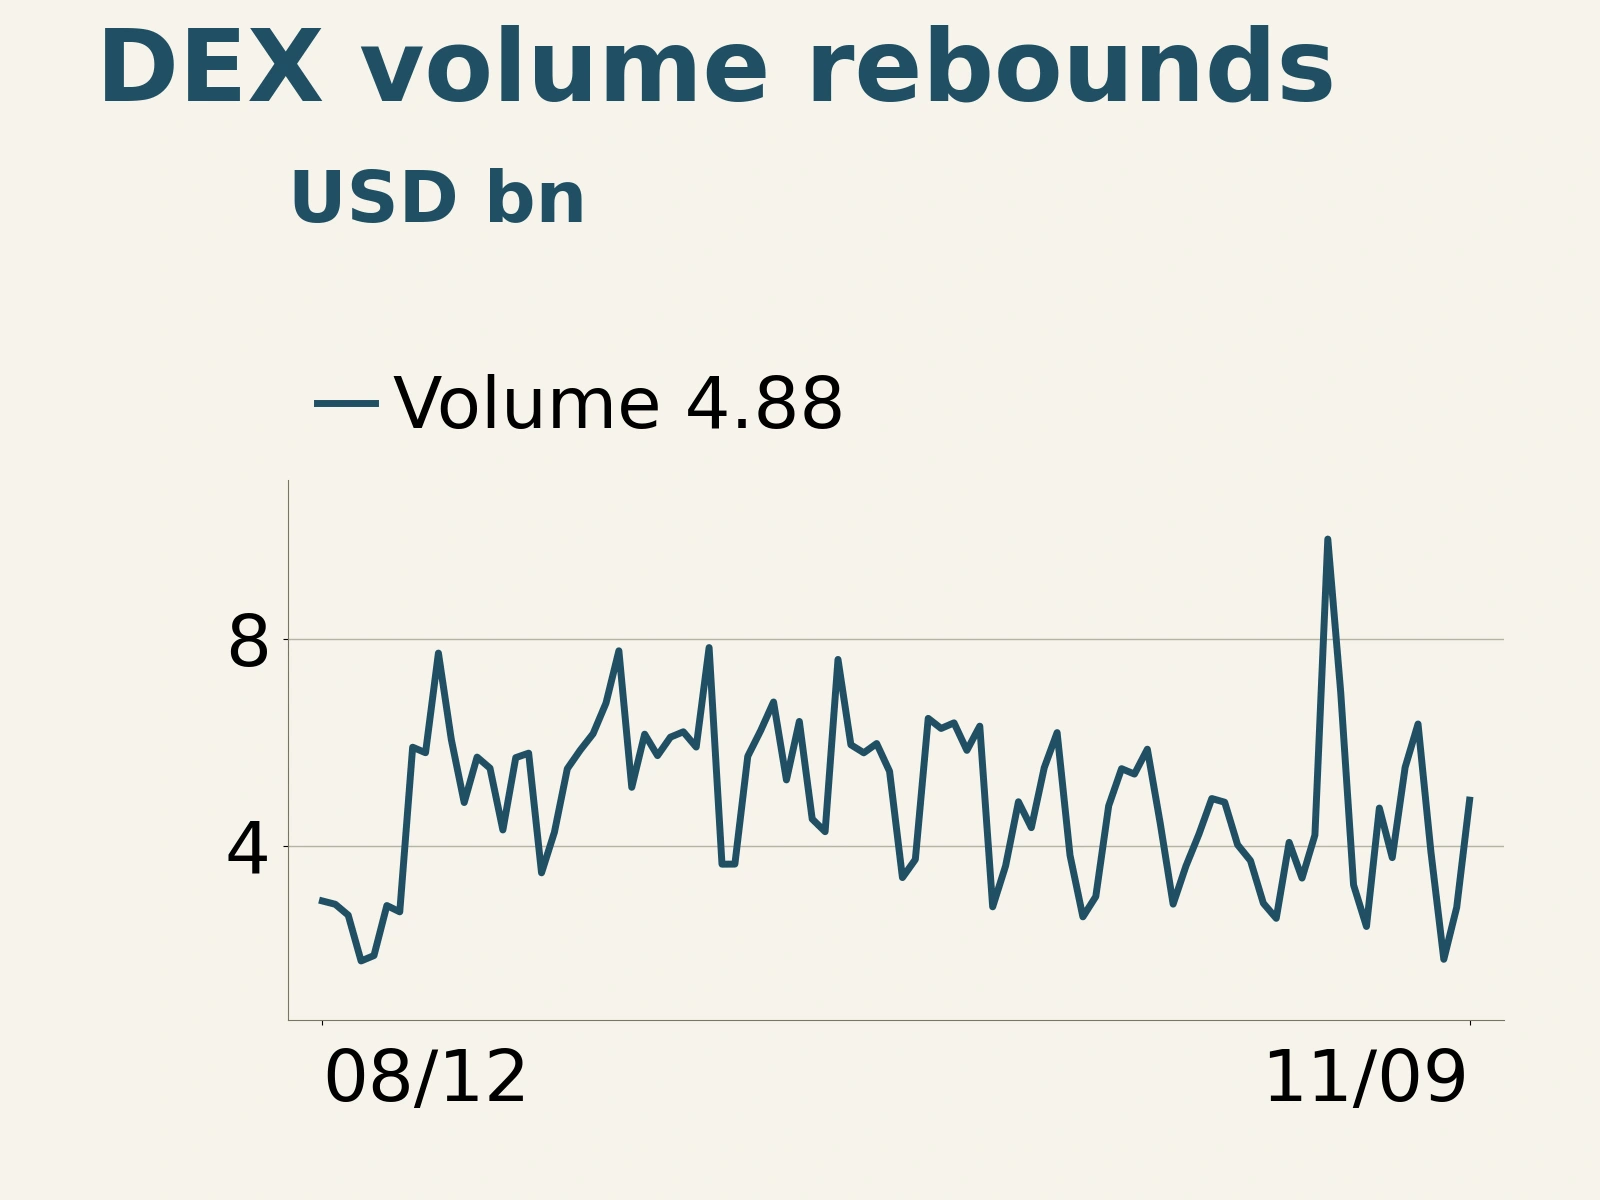
On November 9, 2026, positioning diverged after the weekend selloff. Bitcoin perpetual open interest on Binance rebounded, and longs continued to pay funding. Ethereum open interest fell further, even as its funding rate turned positive. Implied volatility eased for both assets by the end of the UTC day, while ETF flows and stablecoin supply had yet to show a sustained return of investor capital.
Bitcoin open interest rises as longs pay, while Ethereum open interest falls and funding turns positive
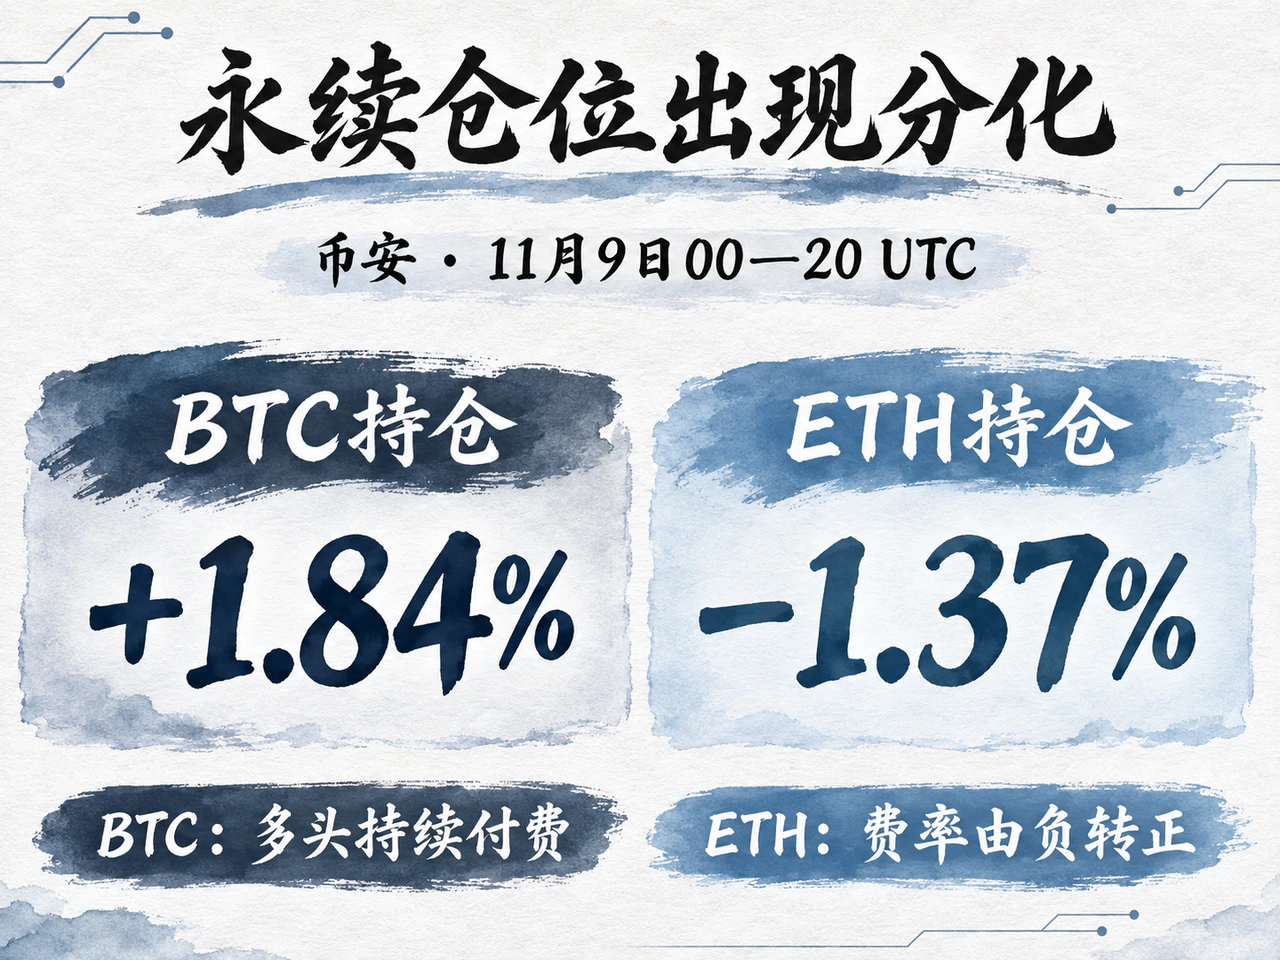
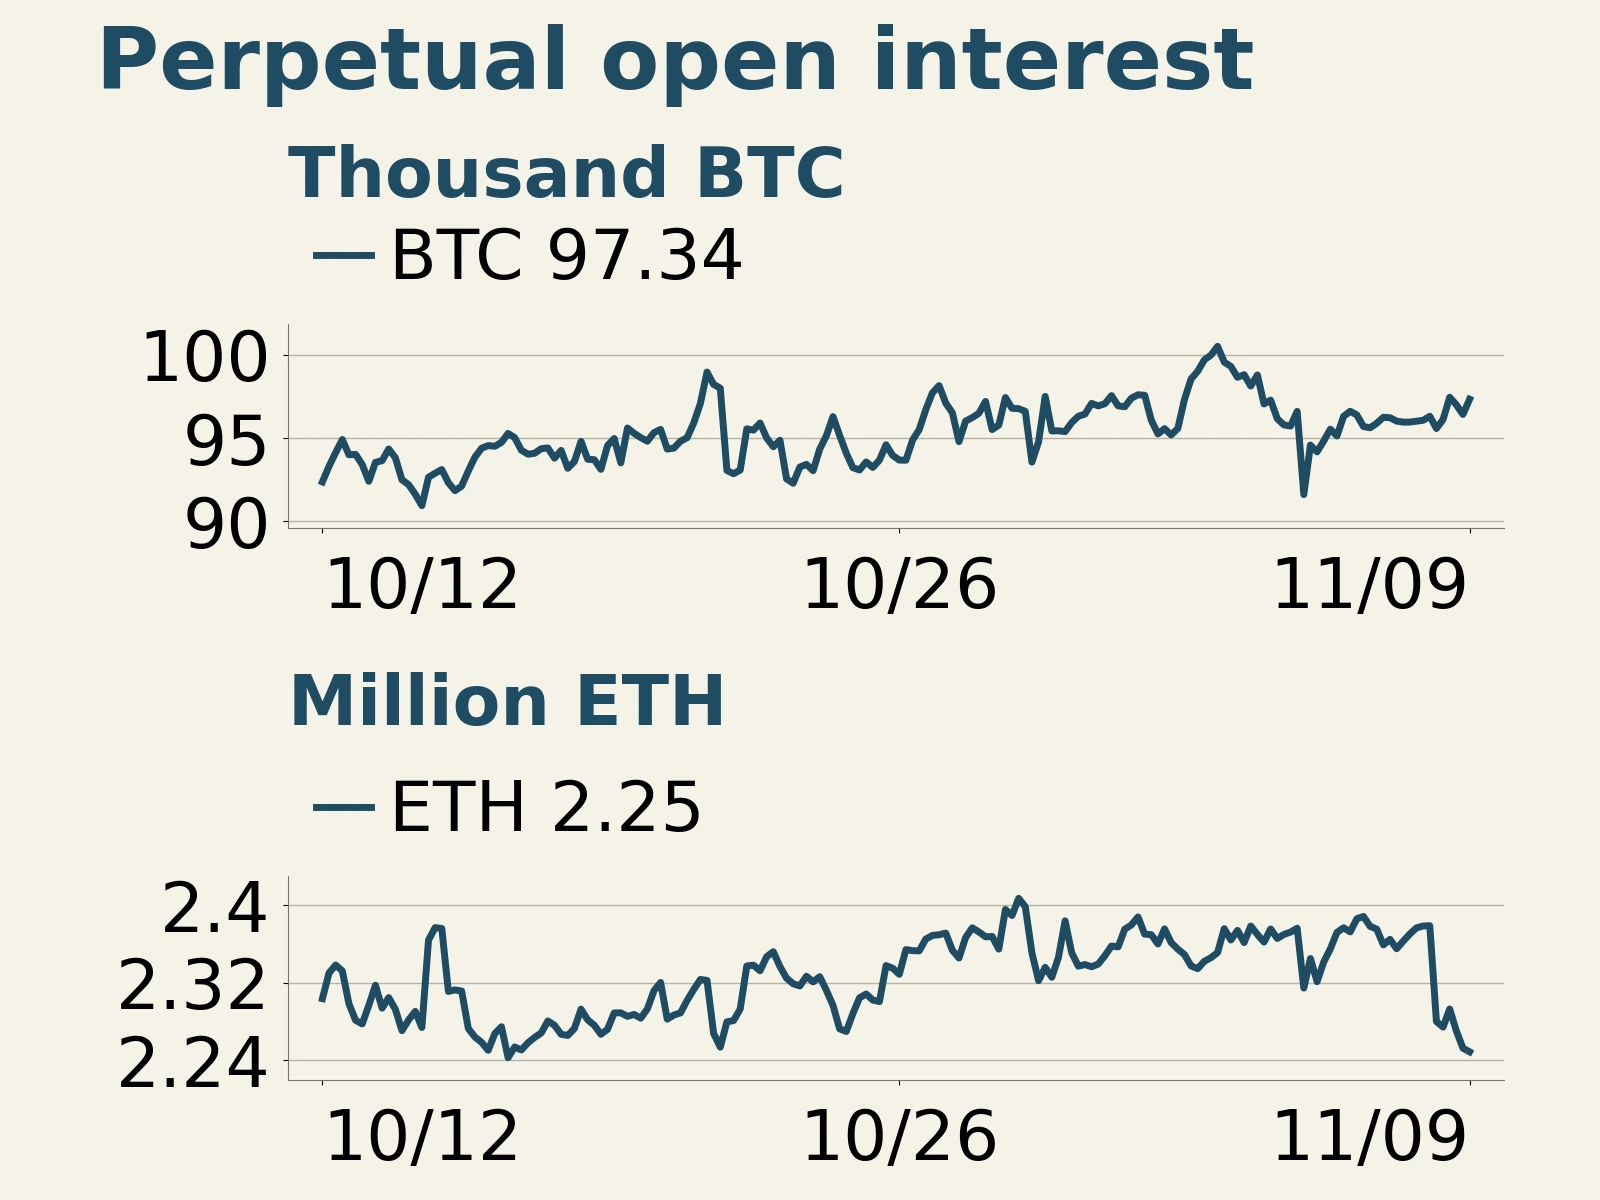
Comparable snapshots of Binance USD-M perpetuals between 00:00 and 20:00 UTC on November 9 show Bitcoin open interest rising 1.84%, from 95,581 to 97,336 BTC. Notional open interest increased 1.92%, from 7.149 billion to 7.286 billion USDT. The rise in both coin-denominated and notional open interest shows that more contracts were outstanding and that price changes alone cannot explain the increase.
Over the same interval, Ethereum open interest fell 1.37%, from 2.2798 million to 2.2485 million ETH. Notional open interest declined 1.27%, from 4.847 billion to 4.785 billion USDT. ETH open interest continued to shrink during this window, while BTC open interest turned higher. Open interest covers both sides of each contract, so funding rates and risk pricing help put the changes in context.
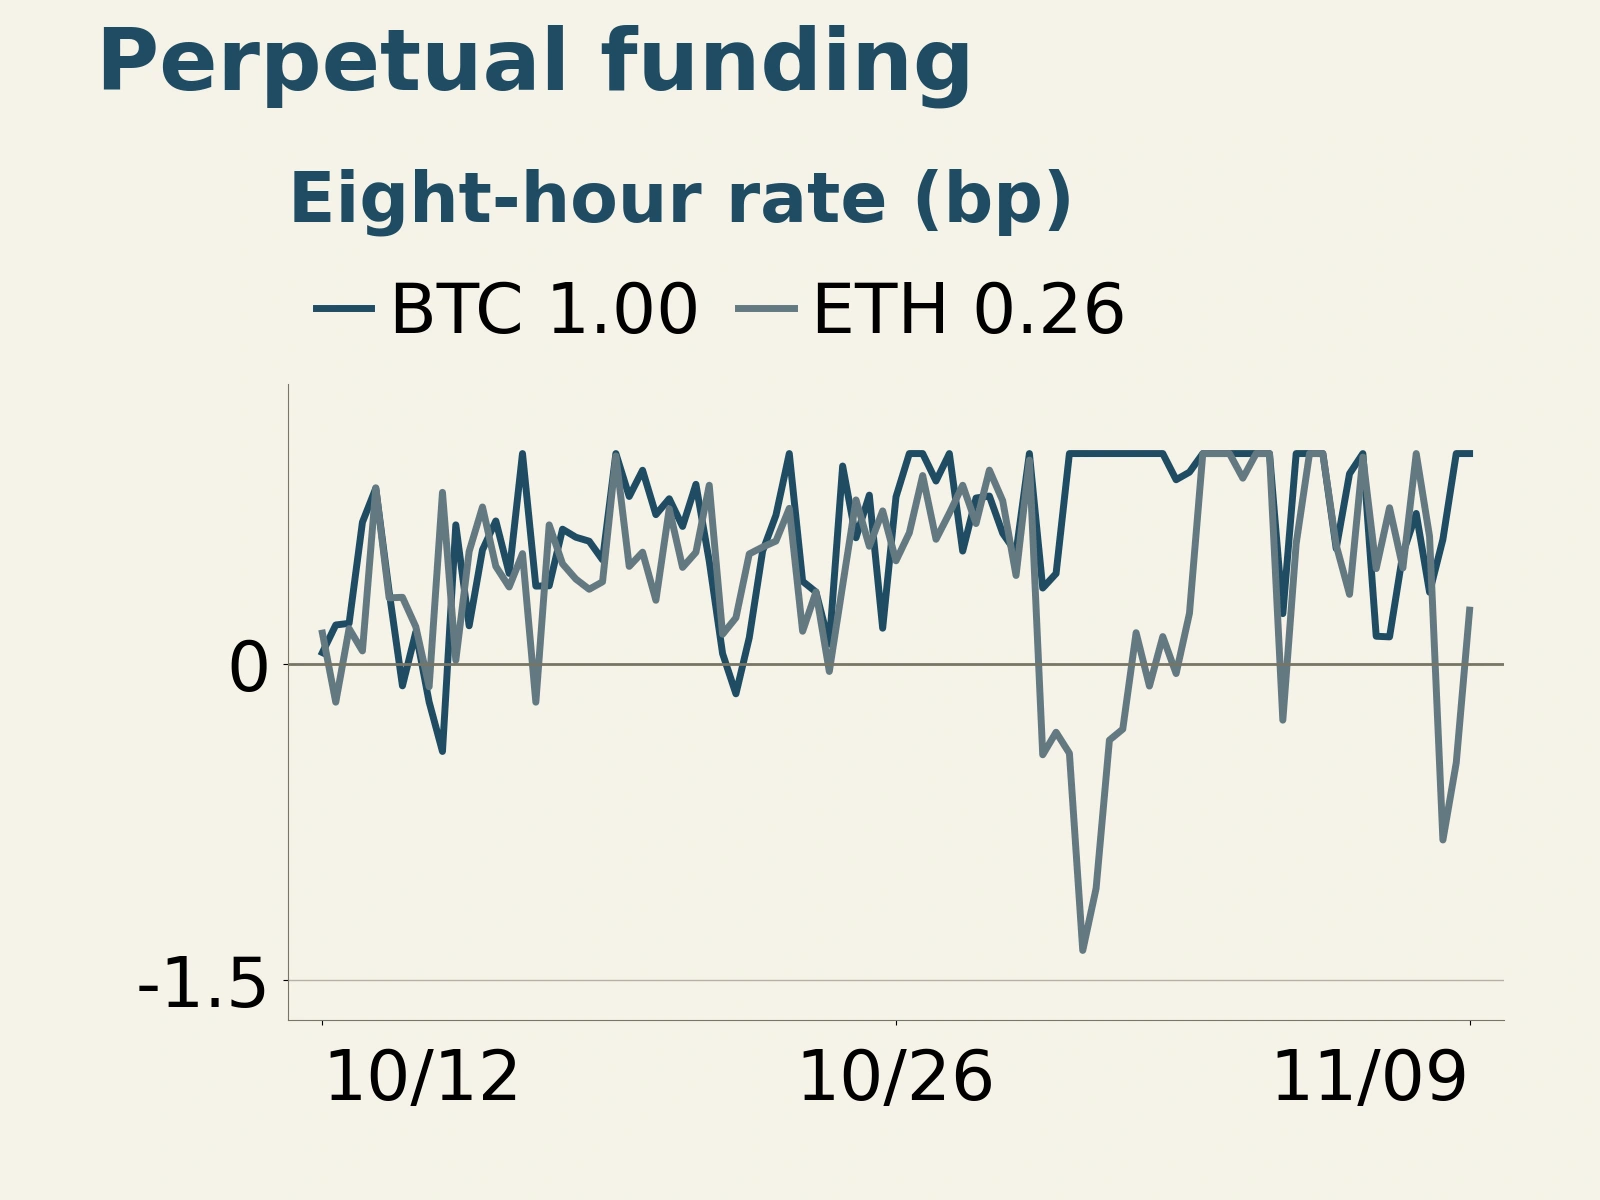
Funding rates show how the cost of holding positions differed. At the three eight-hour settlements at 00:00, 08:00 and 16:00 UTC, Bitcoin funding was 0.00593%, 0.01000% and 0.01000%, respectively, with longs paying shorts throughout. Ethereum funding was -0.008336%, -0.004676% and 0.002570%, respectively. Shorts paid at the first two settlements, and longs paid a small amount at 16:00 UTC. Demand to short or hedge ETH was stronger earlier in the day and then eased, while the cost of holding BTC longs rose again.
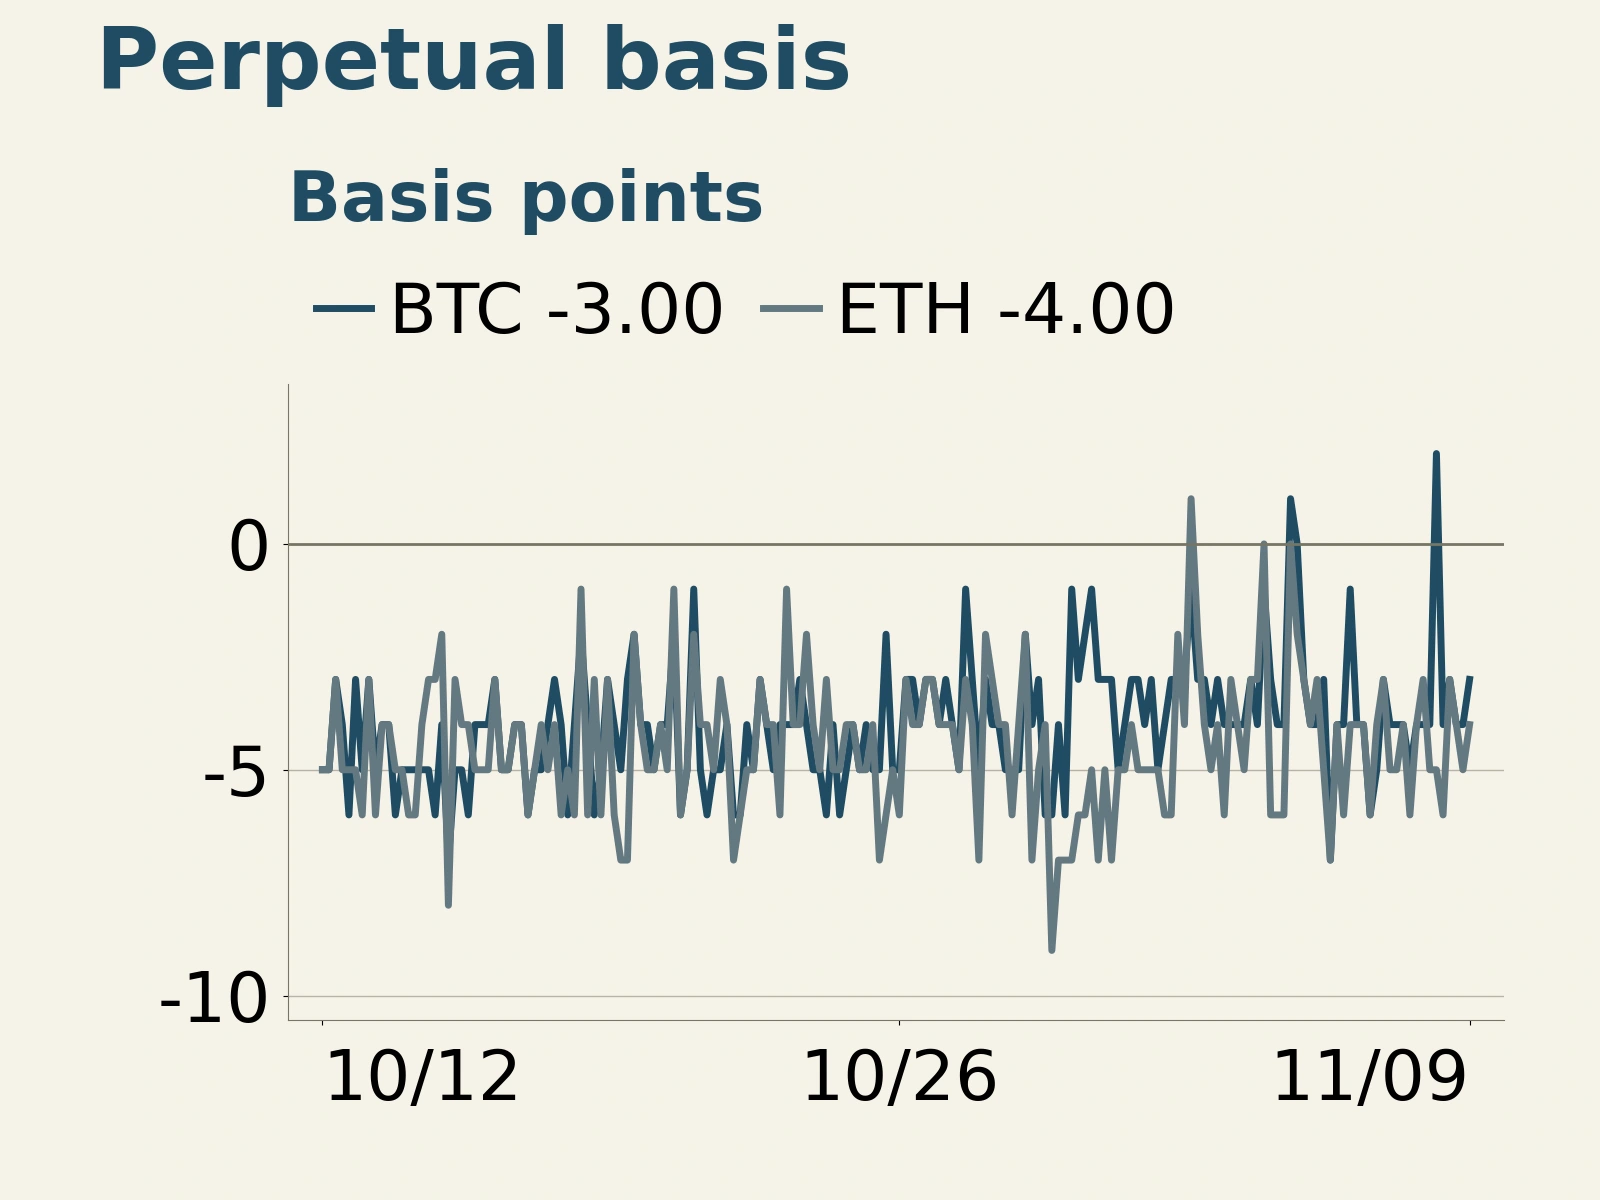
At 20:00 UTC on November 9, the basis on Binance BTC and ETH perpetuals was about -0.03% and -0.04%, respectively. Both traded at small discounts to their indexes. Funding measures the cost of holding a position over the settlement period, whereas the basis measures the price gap at a point in time. Positive funding can therefore coexist with a slight discount. BTC open interest had recovered, but its perpetuals had yet to regain a premium to the index.
ETH liquidations reach about $498 million over 24 hours as DVOL eases
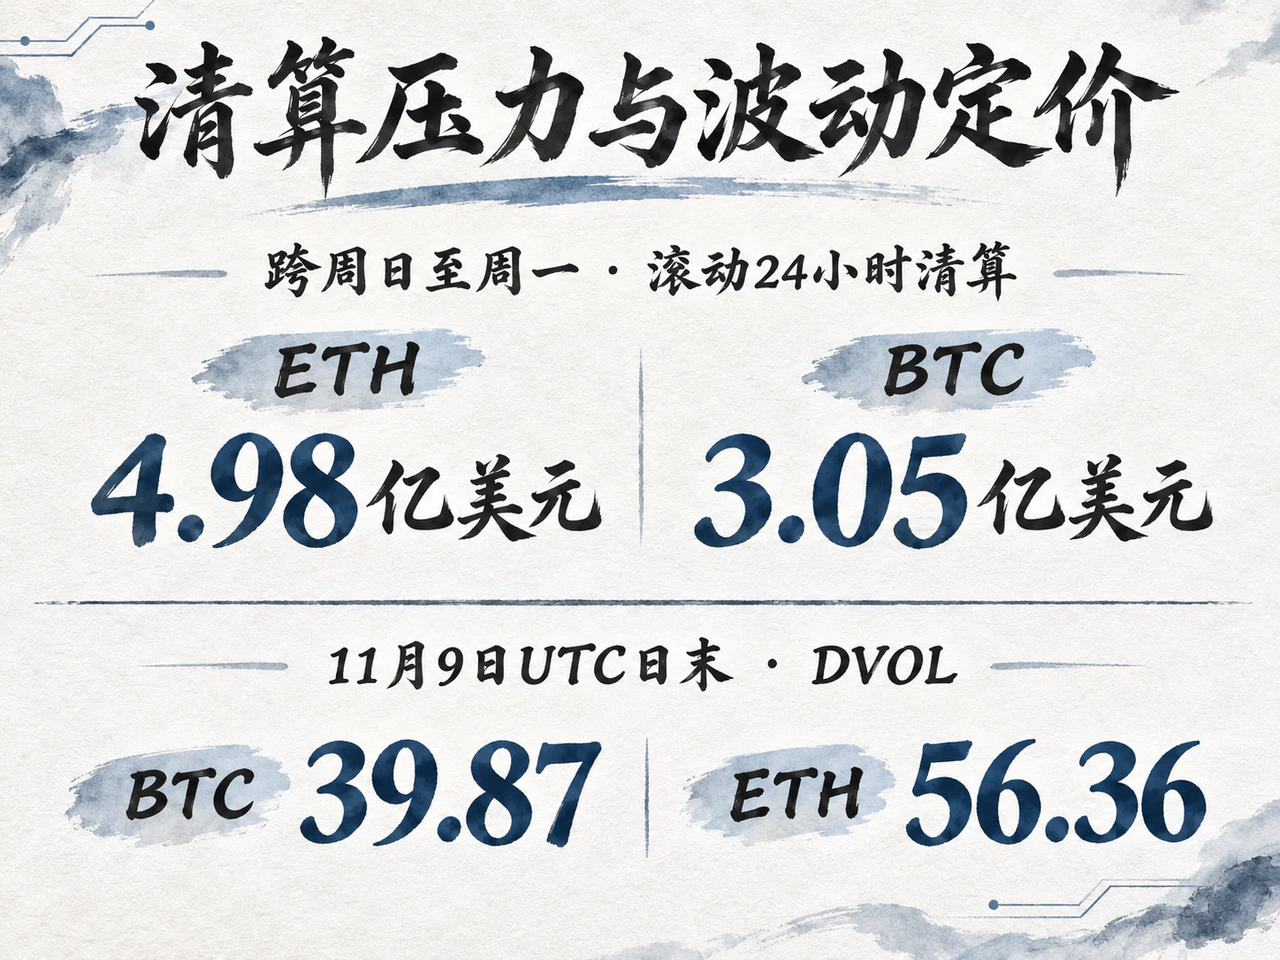
Liquidations were heavier in Ethereum. In an early-morning market report on November 9, Eastern Time, CoinDesk put rolling 24-hour liquidations at about $498 million for ETH and $305 million for BTC. The period spans Sunday and Monday, capturing forced position closures from the weekend shock into early Monday. It differs from the window used for the Binance open interest snapshots above.
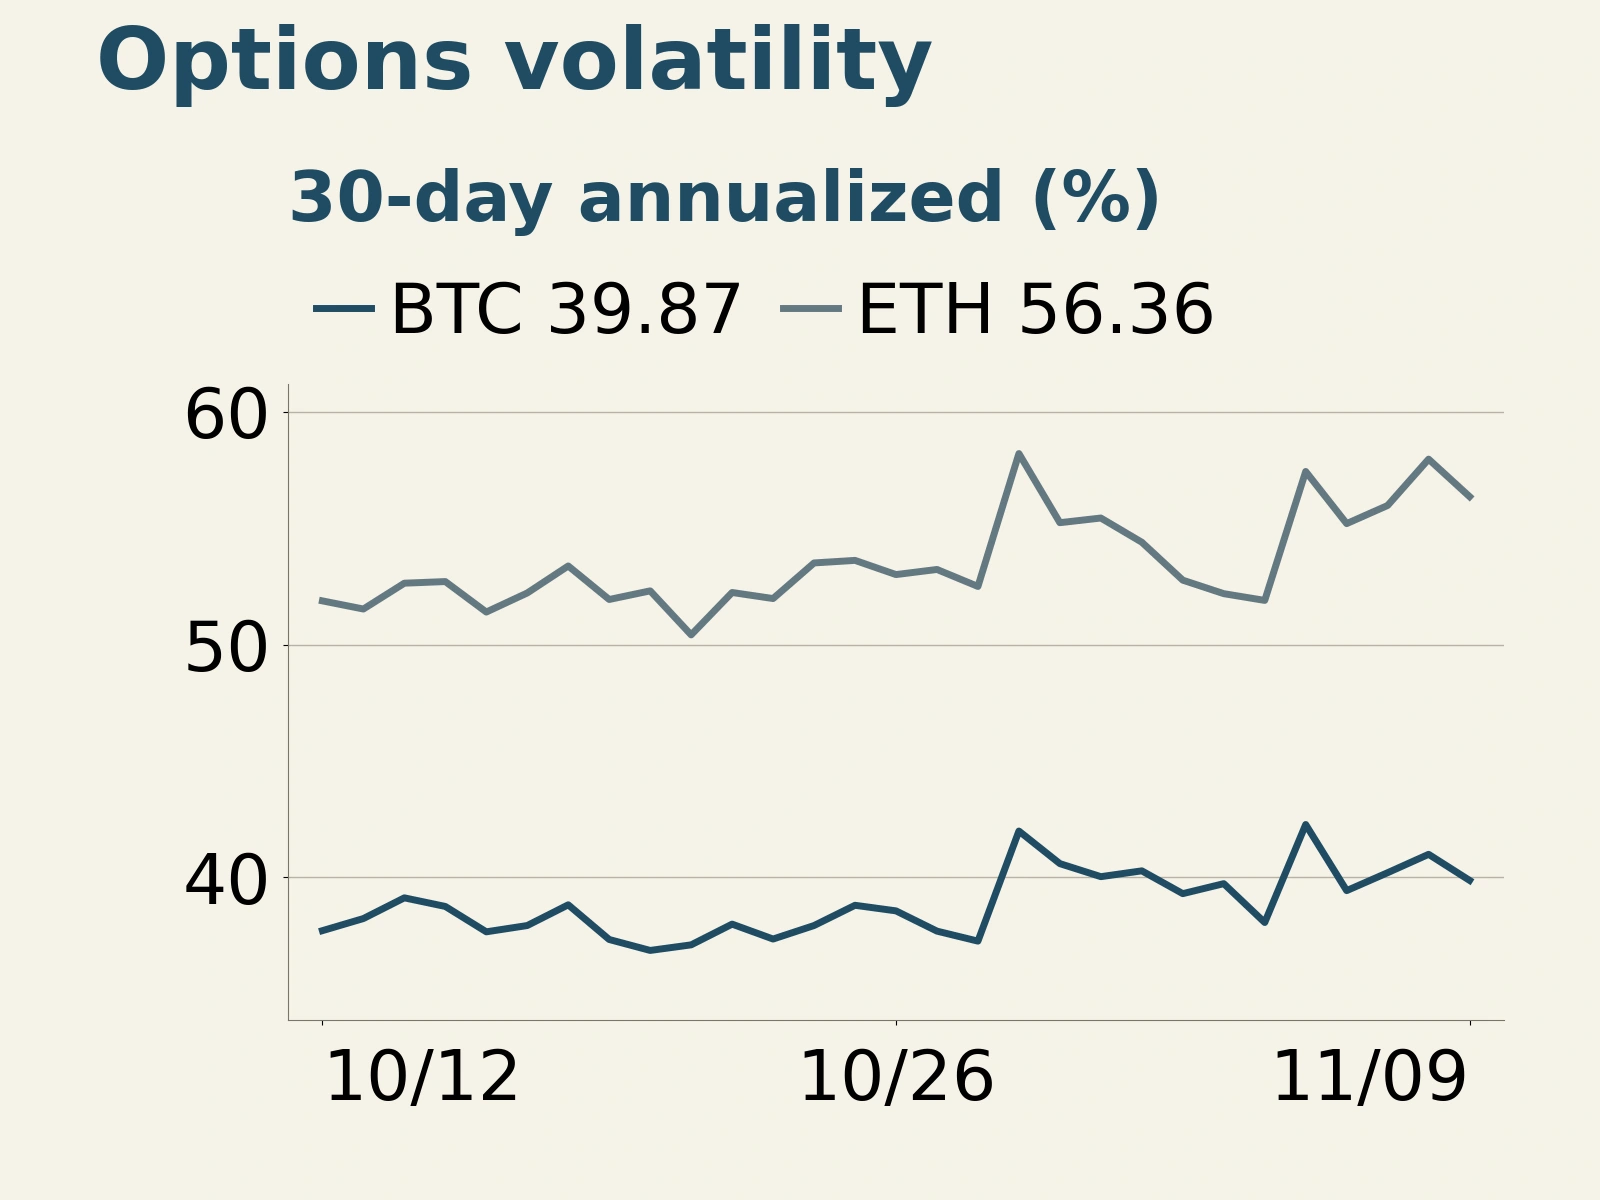
Options markets priced in somewhat less volatility. At the end of the UTC day on November 9, Deribit’s 30-day constant-maturity implied volatility index, DVOL, fell from 40.99 to 39.87 for BTC and from 57.97 to 56.36 for ETH. Those were declines of 1.12 and 1.61 percentage points, respectively, from the previous day. ETH implied volatility remained markedly higher than BTC implied volatility, and the gap in risk premia persisted.
Spot ETFs saw net outflows last week as stablecoin supply kept shrinking
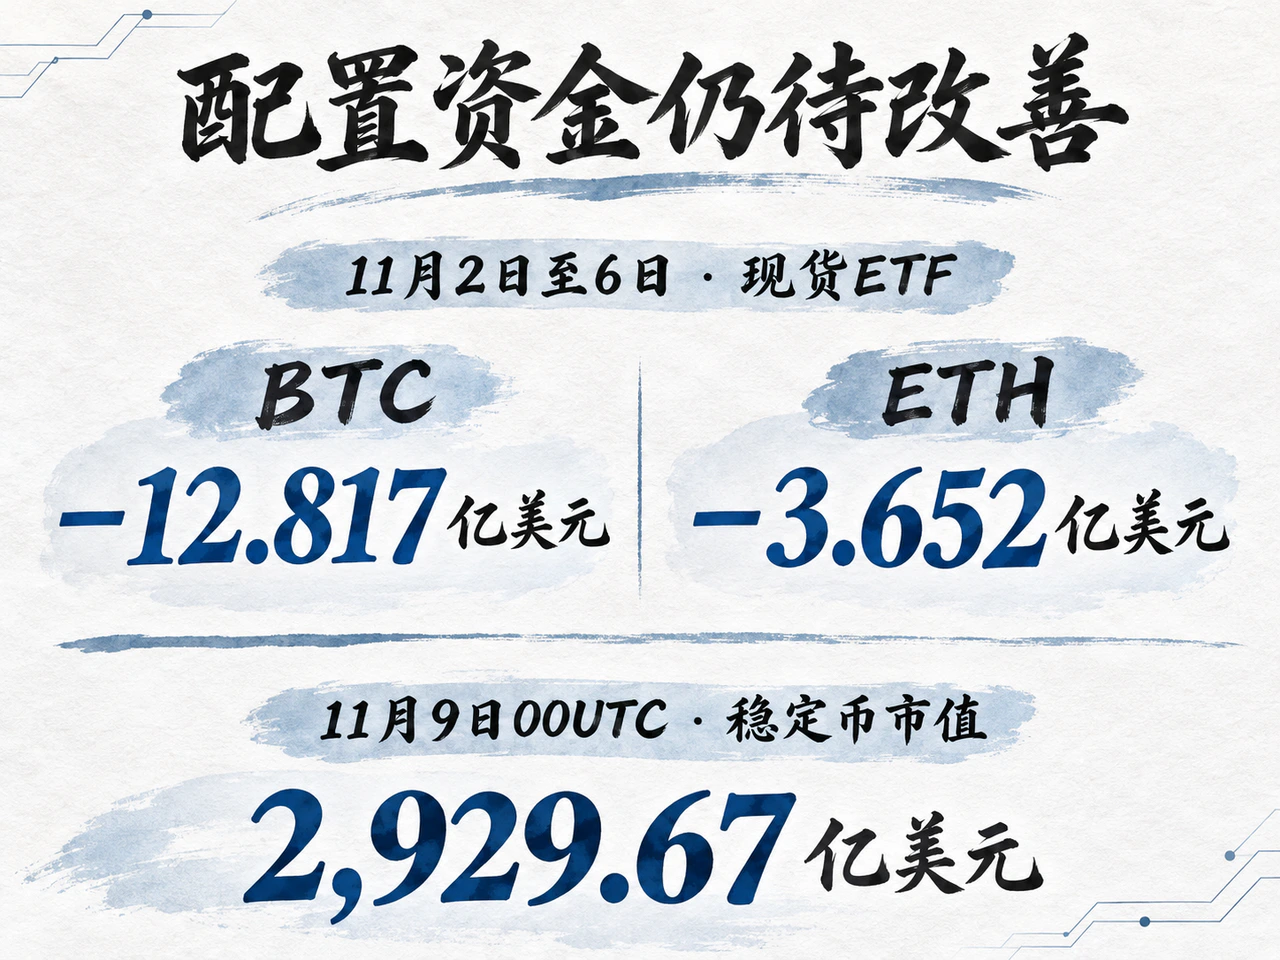
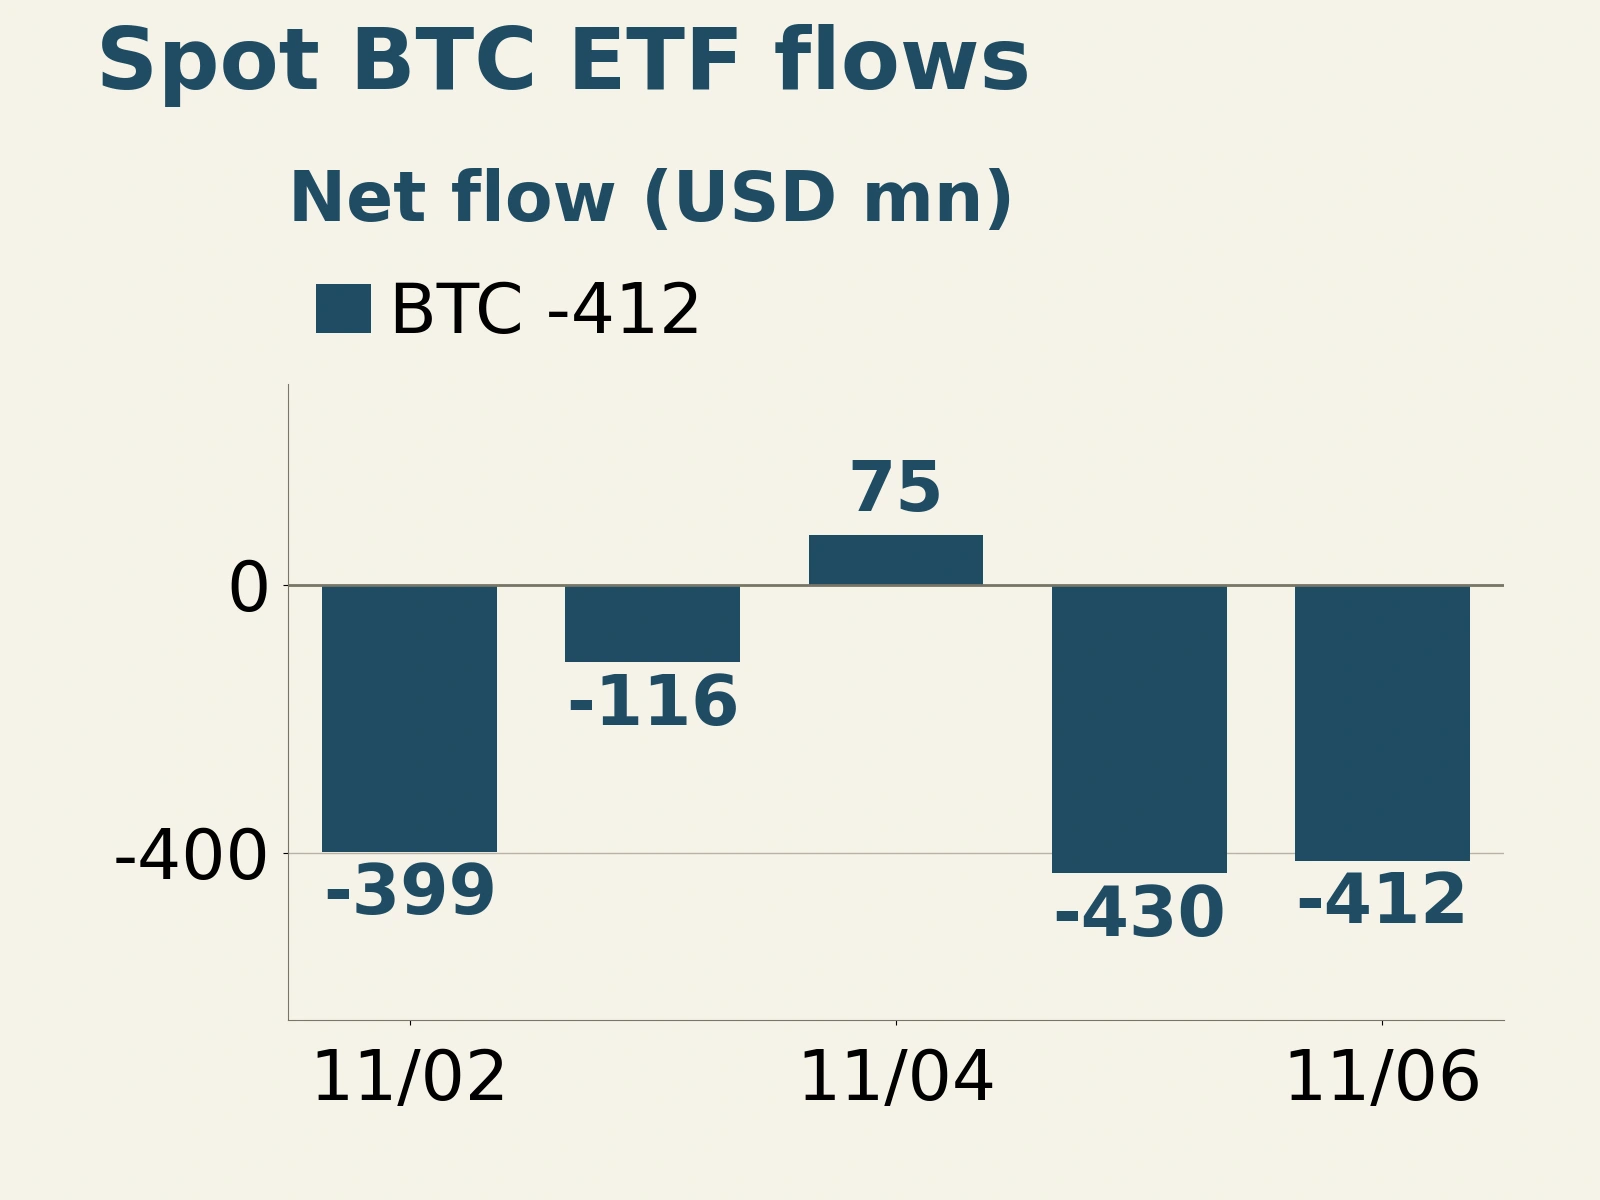
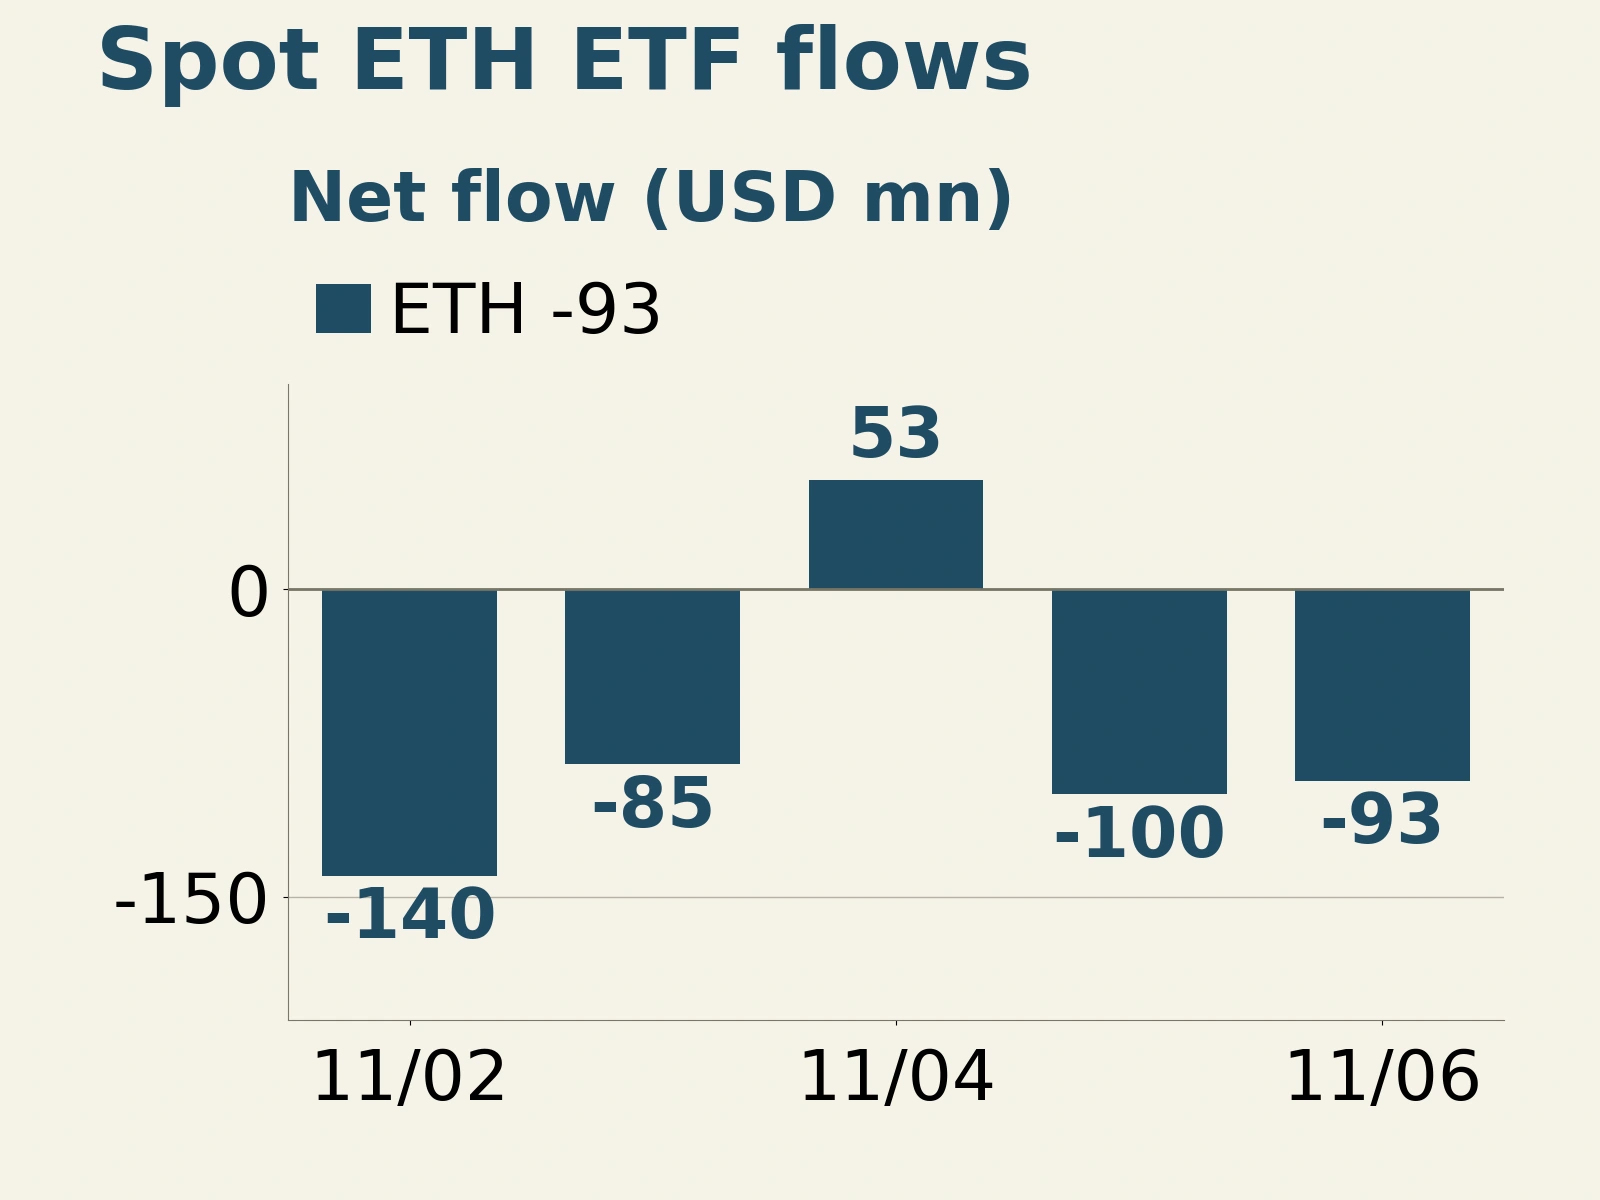
ETF flows offer another way to assess changes in leveraged positioning. Farside published complete figures for all five U.S. trading days from November 2 to 6. Spot BTC ETFs recorded combined net outflows of $1.2817 billion, and spot ETH ETFs saw $365.2 million in net outflows. Both groups recorded net inflows only on November 4, with outflows resuming over the next two trading days. The previous week’s persistent redemptions set the backdrop for the rebuilding of positions in the new week.
Stablecoin supply provides another measure of the available capital. DefiLlama put the circulating market capitalization of dollar-pegged stablecoins at $292.967 billion at 00:00 UTC on November 9, down $270 million from the same time on November 8 and $13.037 billion from October 10. The snapshot shows that the recent contraction was still under way at the start of Monday.
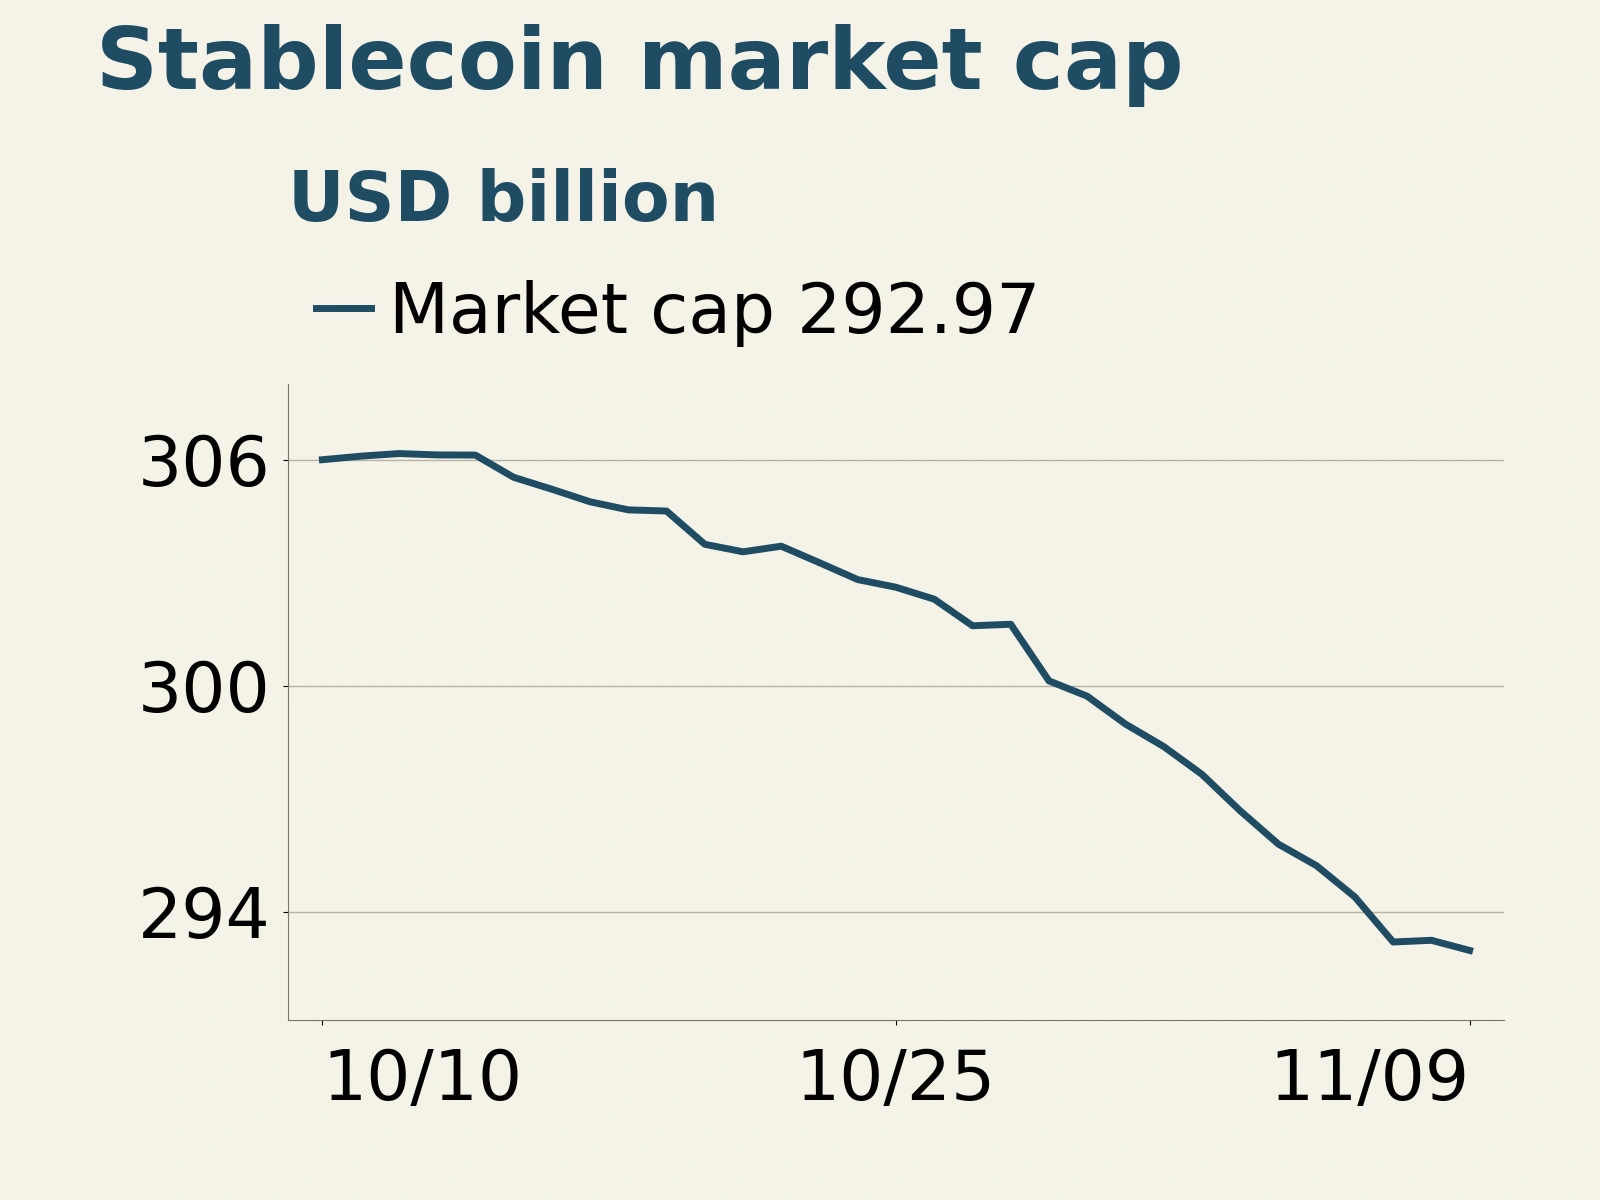
Issuance, redemptions and valuation all affect stablecoin market capitalization. Stablecoins are used for exchange margin, on-chain payments and holding balances. The contraction shows that the pool available for these uses has yet to expand. The rise in BTC open interest is therefore more consistent with existing capital taking on risk again. A return of investor capital would need confirmation from sustained net ETF subscriptions and a recovery in stablecoin supply. For ETH, the shift to positive funding and the decline in implied volatility point to easing pressure, even as open interest continued to fall.
On November 9, BTC open interest began to recover while trading pressure in ETH began to ease. For both assets, the data had yet to show investor capital and demand for leverage expanding together. Whether the price recovery can continue depends on fresh buying taking over from position adjustments. Lower volatility alone offers limited support.
Click through to the original article for the full details.