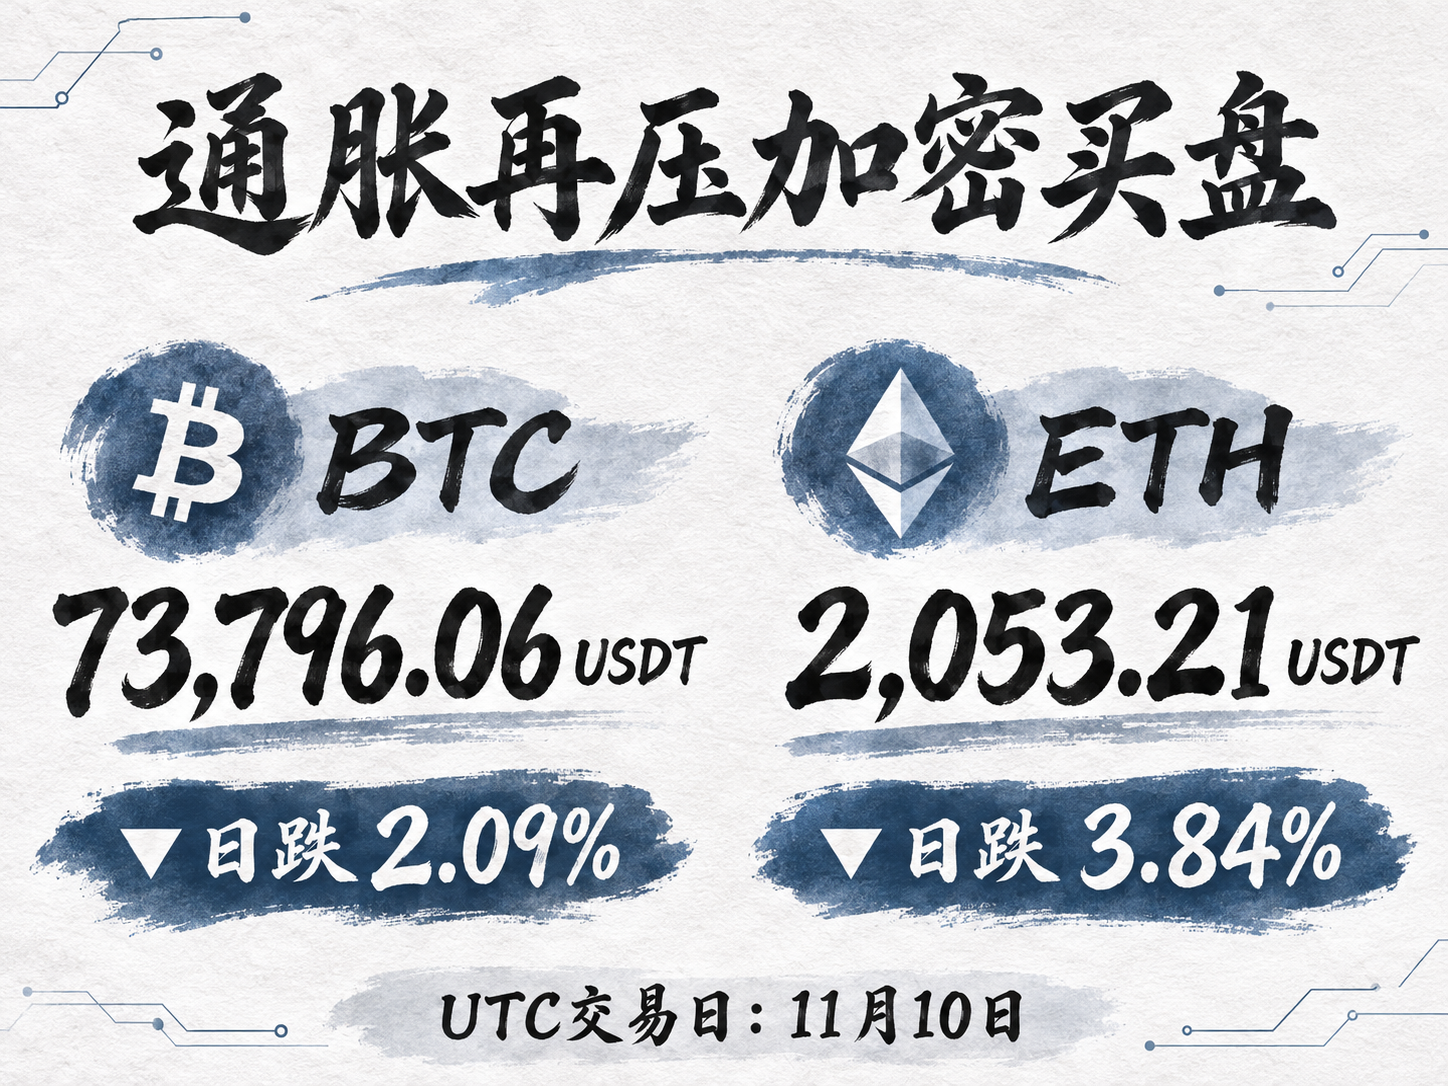
On November 10, 2026, U.S. inflation figures for October came in above market expectations, extending the cryptocurrency market's existing decline. On a Binance spot, USDT-quoted, UTC daily-candle basis, at the close corresponding to 8 a.m. Beijing time on November 11, Bitcoin stood at 73,796.06 USDT, down 2.09% from the previous daily close; Ethereum stood at 2,053.21 USDT, down 3.84%. All six assets in the sample of highly liquid major cryptocurrencies closed lower. Ethereum and most of the major coins underperformed Bitcoin, combining interest-rate pressure with relative weakness within the crypto market.
Core CPI rises 0.3% month on month; 10-year Treasury yield breaks above 5% intraday

According to the U.S. Bureau of Labor Statistics, the seasonally adjusted Consumer Price Index (CPI) rose 0.4% month on month in October, below September's 0.6% but above the market expectation of 0.3%. Core CPI, which excludes food and energy, rose 0.3% month on month, matching the preceding two months and exceeding the expected 0.2%. Headline inflation slowed, but by less than expected, while sticky core prices weakened the case for a near-term shift toward monetary easing.
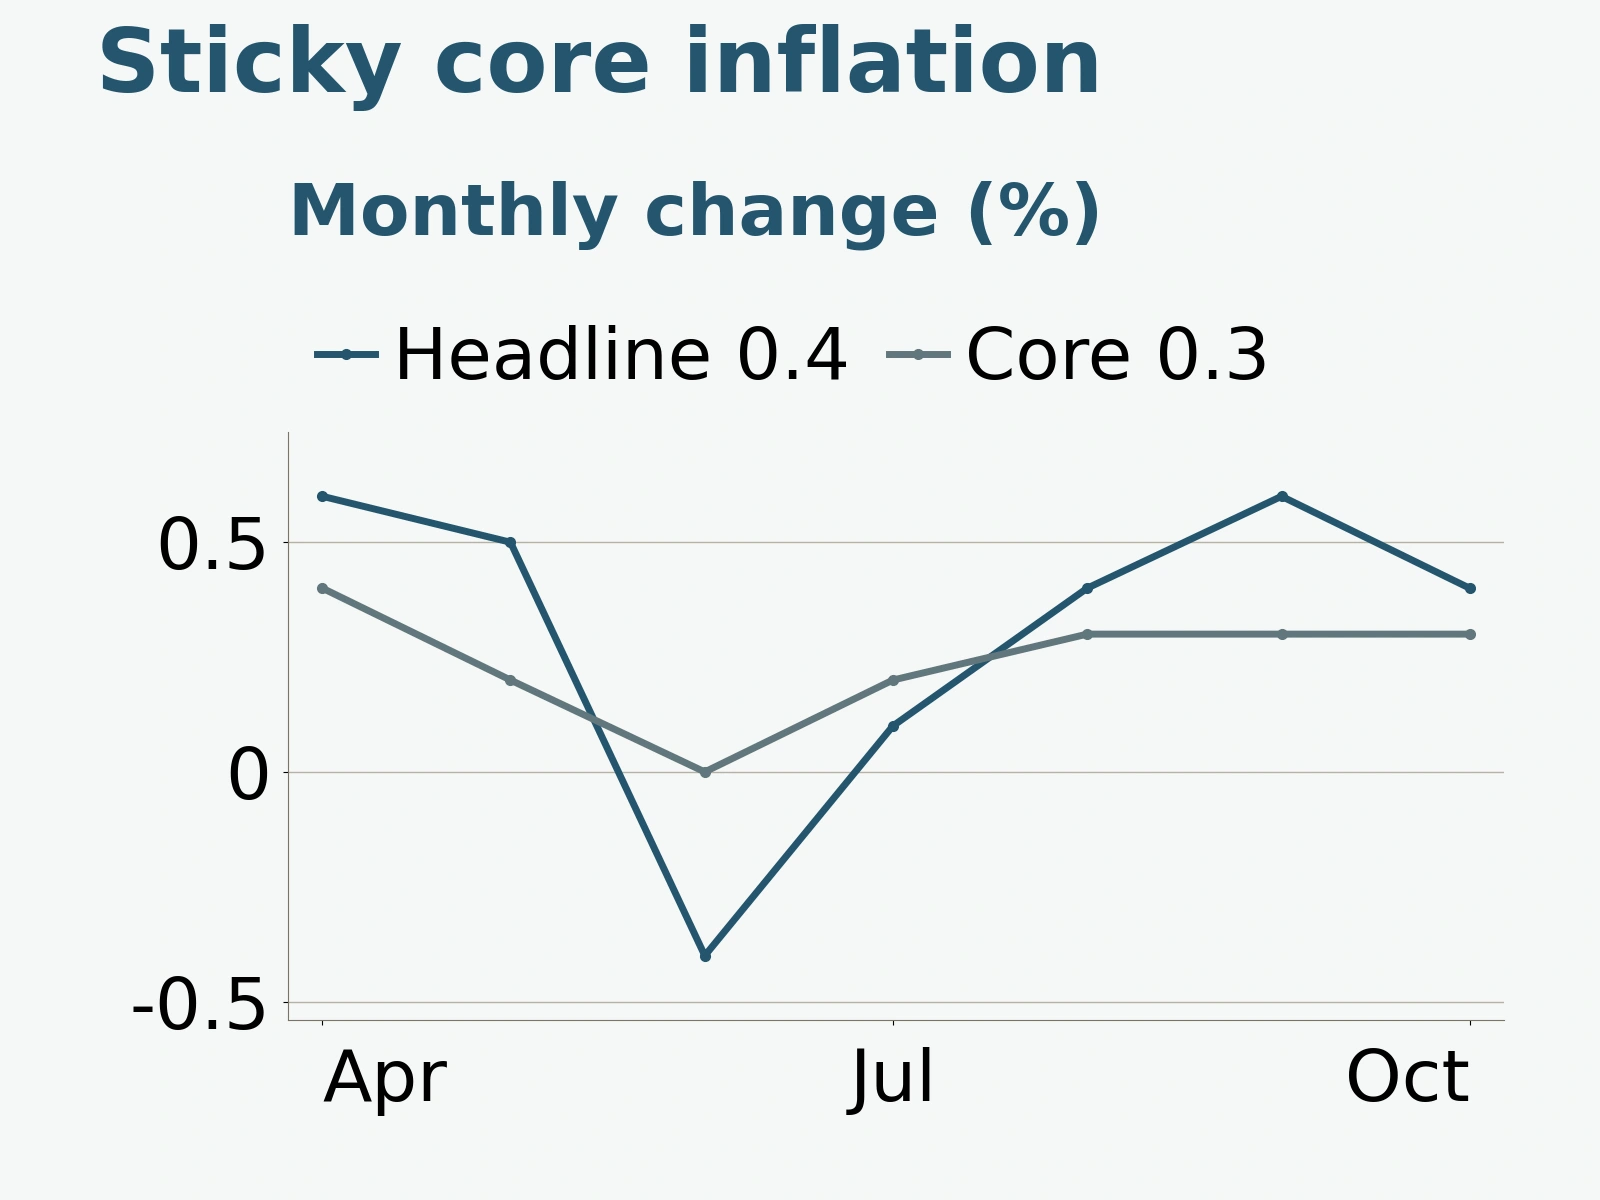
The composition of inflation helps explain the gap. Monthly energy-price growth slowed from 5.2% in September to 0.7%, easing pressure on the headline index. Food prices rose 0.5% month on month and shelter prices rose 0.3%, with shelter accounting for more than 30% of the month's overall increase. As a fading energy shock coincided with continuing increases in other prices, markets focused more closely on whether core inflation could keep slowing.
The bond market's reaction was more immediate. CNBC reported that day that the 10-year U.S. Treasury yield moved back above 5% intraday before retreating. Federal Reserve Governor Waller had previously said that a 50-basis-point rate increase in December should be considered if inflation exceeded expectations. Lindsay Rosner, head of multi-sector investing in fixed income at Goldman Sachs Asset Management, suggested that persistently strong inflation could extend rate increases into 2027. These policy comments and institutional assessments remain subject to subsequent meetings and data; traders nevertheless used them to reassess the cost of capital.
For crypto assets, higher risk-free yields raise the opportunity cost of holding highly volatile assets and increase the financing cost of leveraged positions. In its report after the data release, CoinDesk said Bitcoin extended its early-session decline to around $73,600. Binance's complete daily candle shows a high of 75,442.01 USDT and a low of 72,727.27 USDT. Although Bitcoin recovered from the lows by the close, it failed to regain the previous day's closing level.
This decline followed a drawdown already roughly a month old. Based on closing prices for the same trading pair, Bitcoin was down a cumulative 11.91% from its October 11 close, with the inflation surprise reinforcing existing pressure. Buying at the intraday lows showed that demand remained at lower prices. Recovering part of a single day's losses was still insufficient to reverse the monthly drawdown.
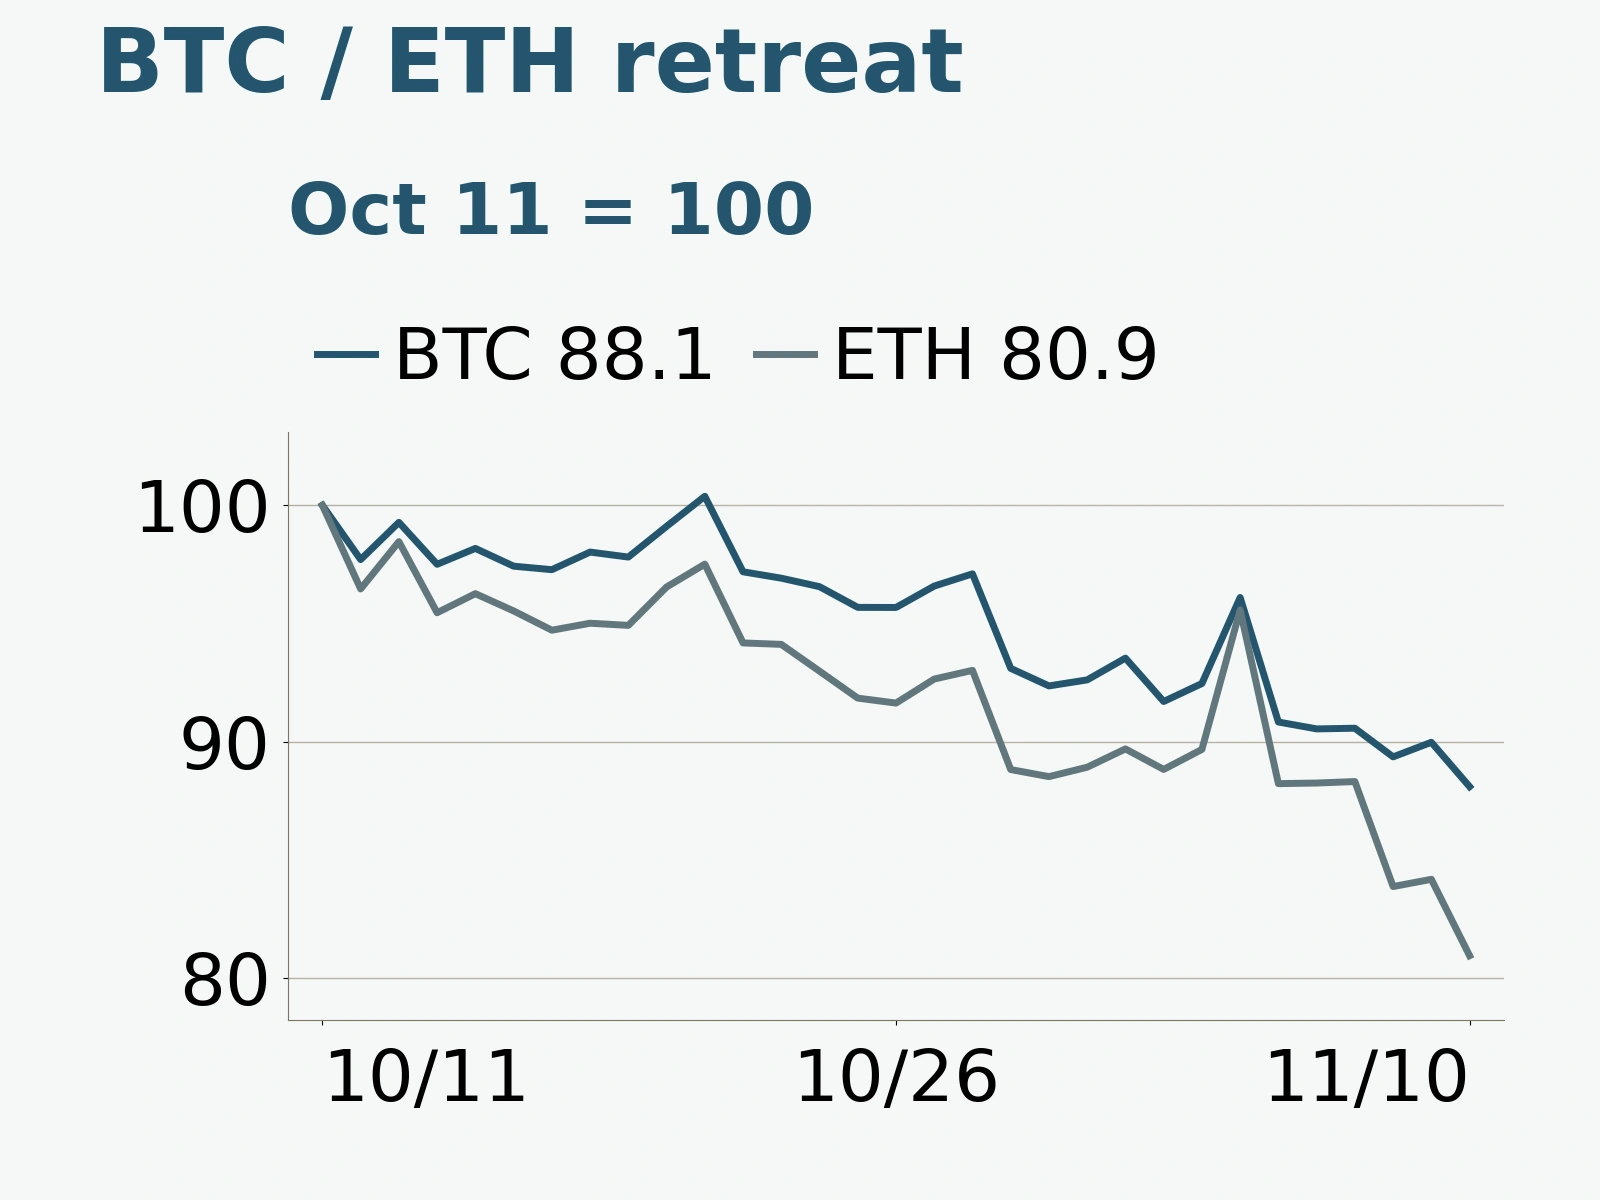
All six major coins fall; ETH/BTC drops to 0.027823
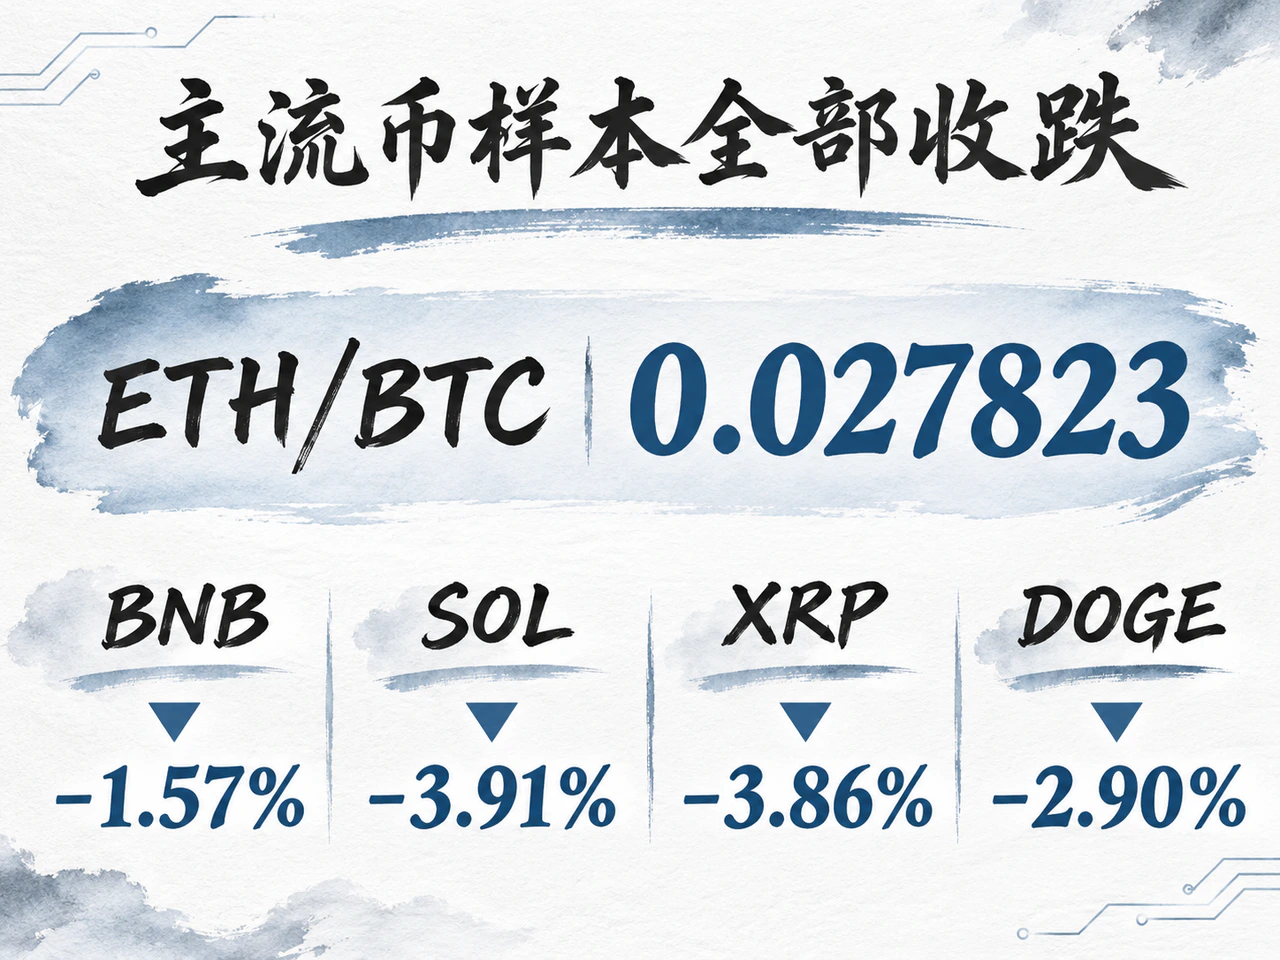
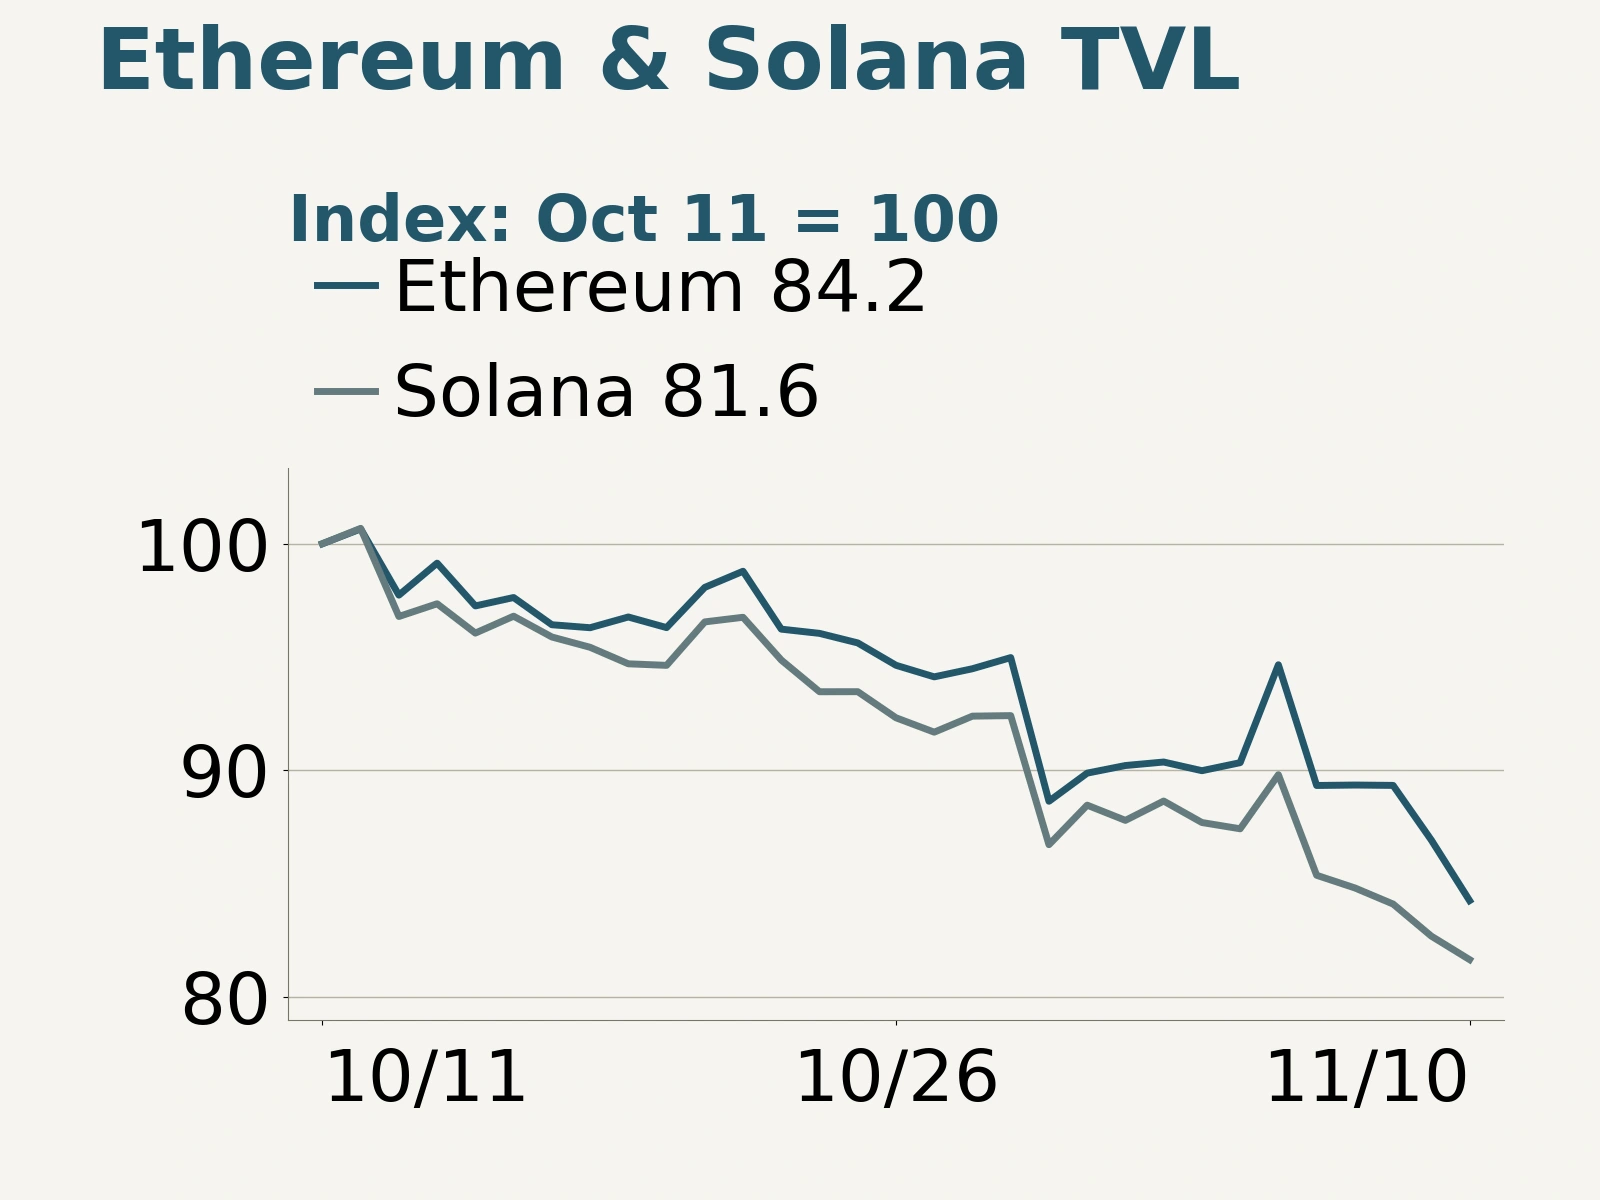
Ethereum was weaker, touching an intraday low of 2,006.00 USDT before closing at 2,053.21 USDT. Its decline exceeded Bitcoin's by about 1.76 percentage points. Calculated from their USDT closing prices at the same timestamp, ETH/BTC fell to 0.027823, below the previous day's 0.028331 and October 11's 0.030283. Ethereum lost a cumulative 19.07% over the past 30 days, showing that its underperformance relative to Bitcoin also extended across the monthly window.
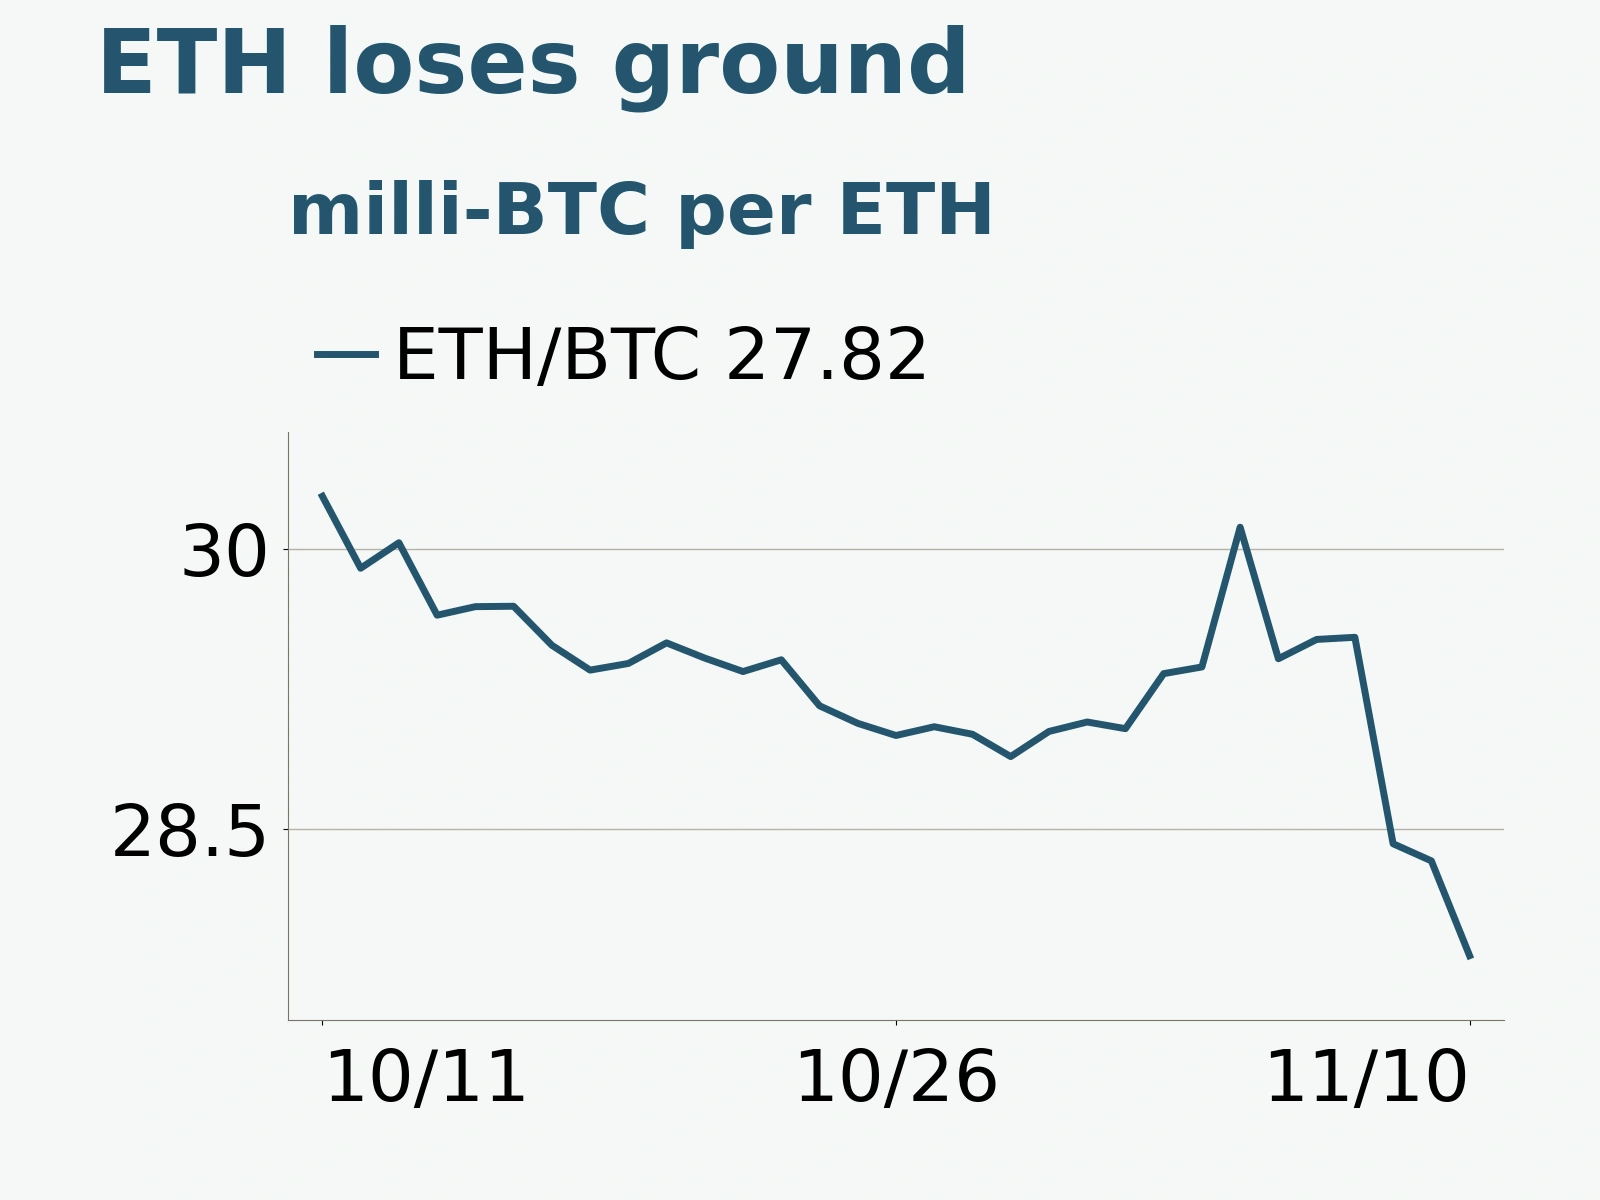
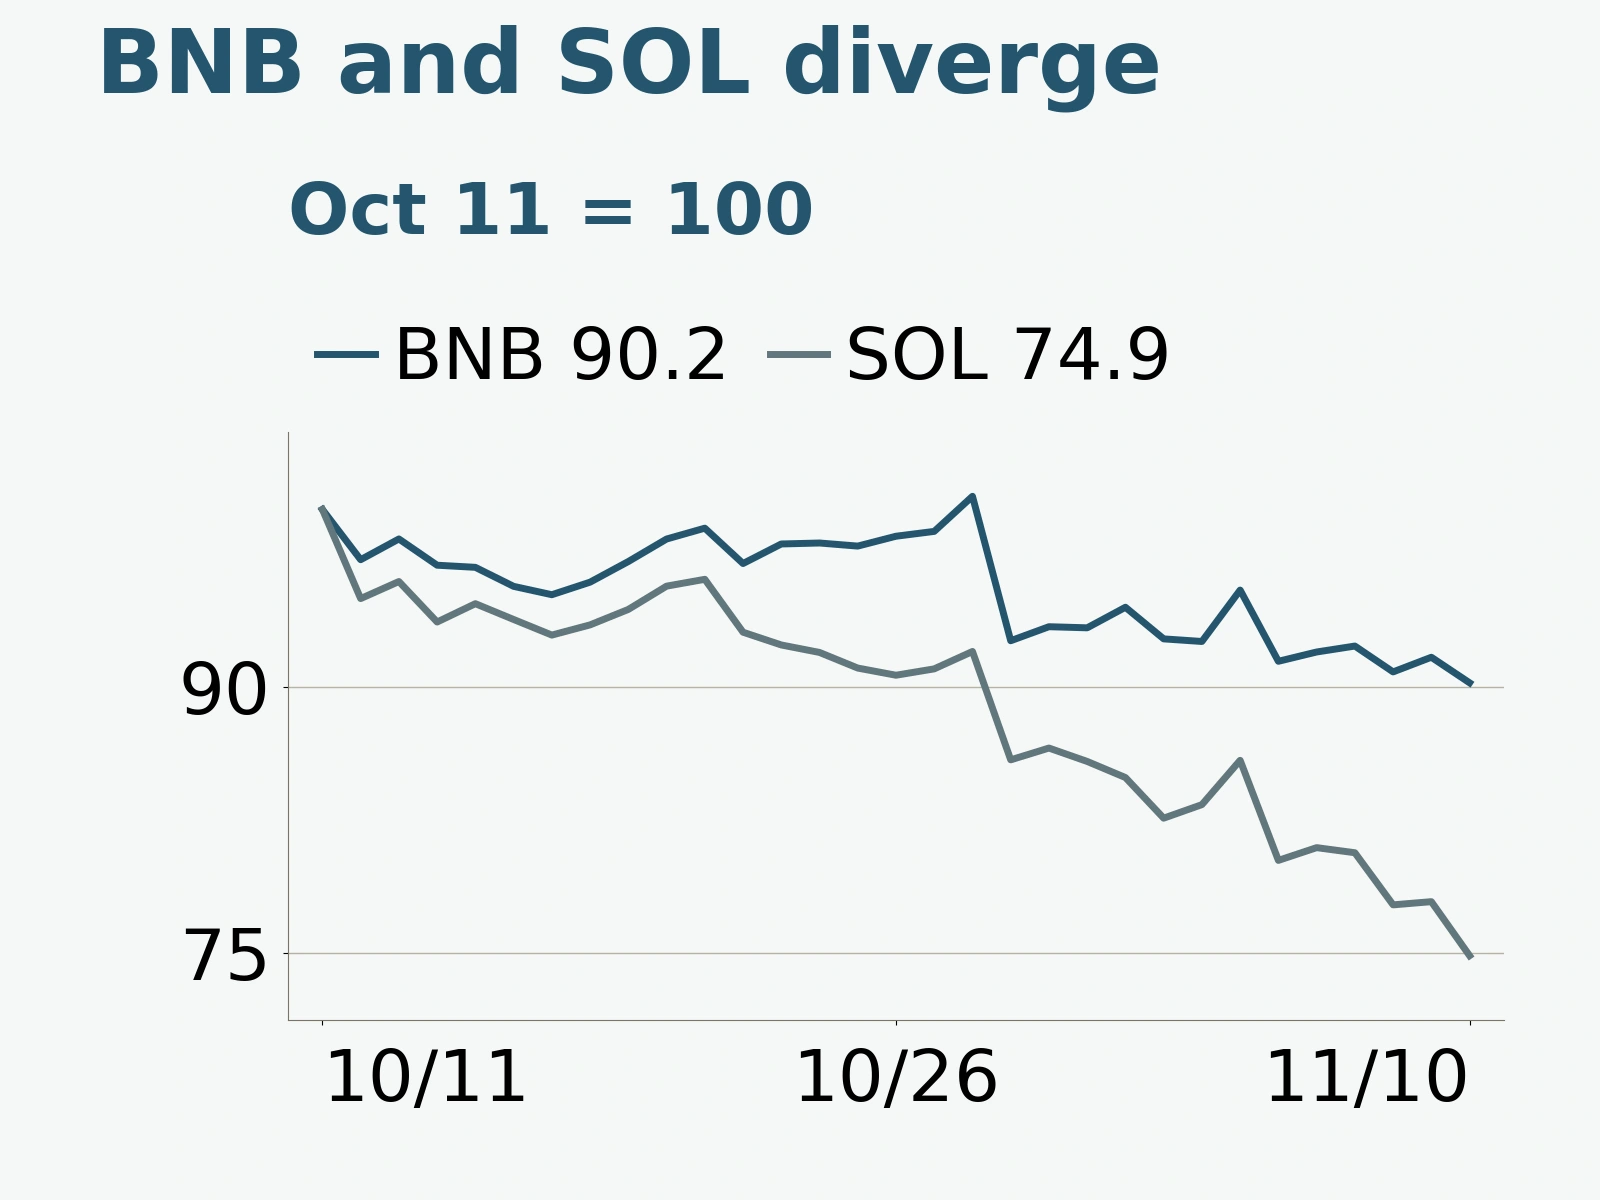
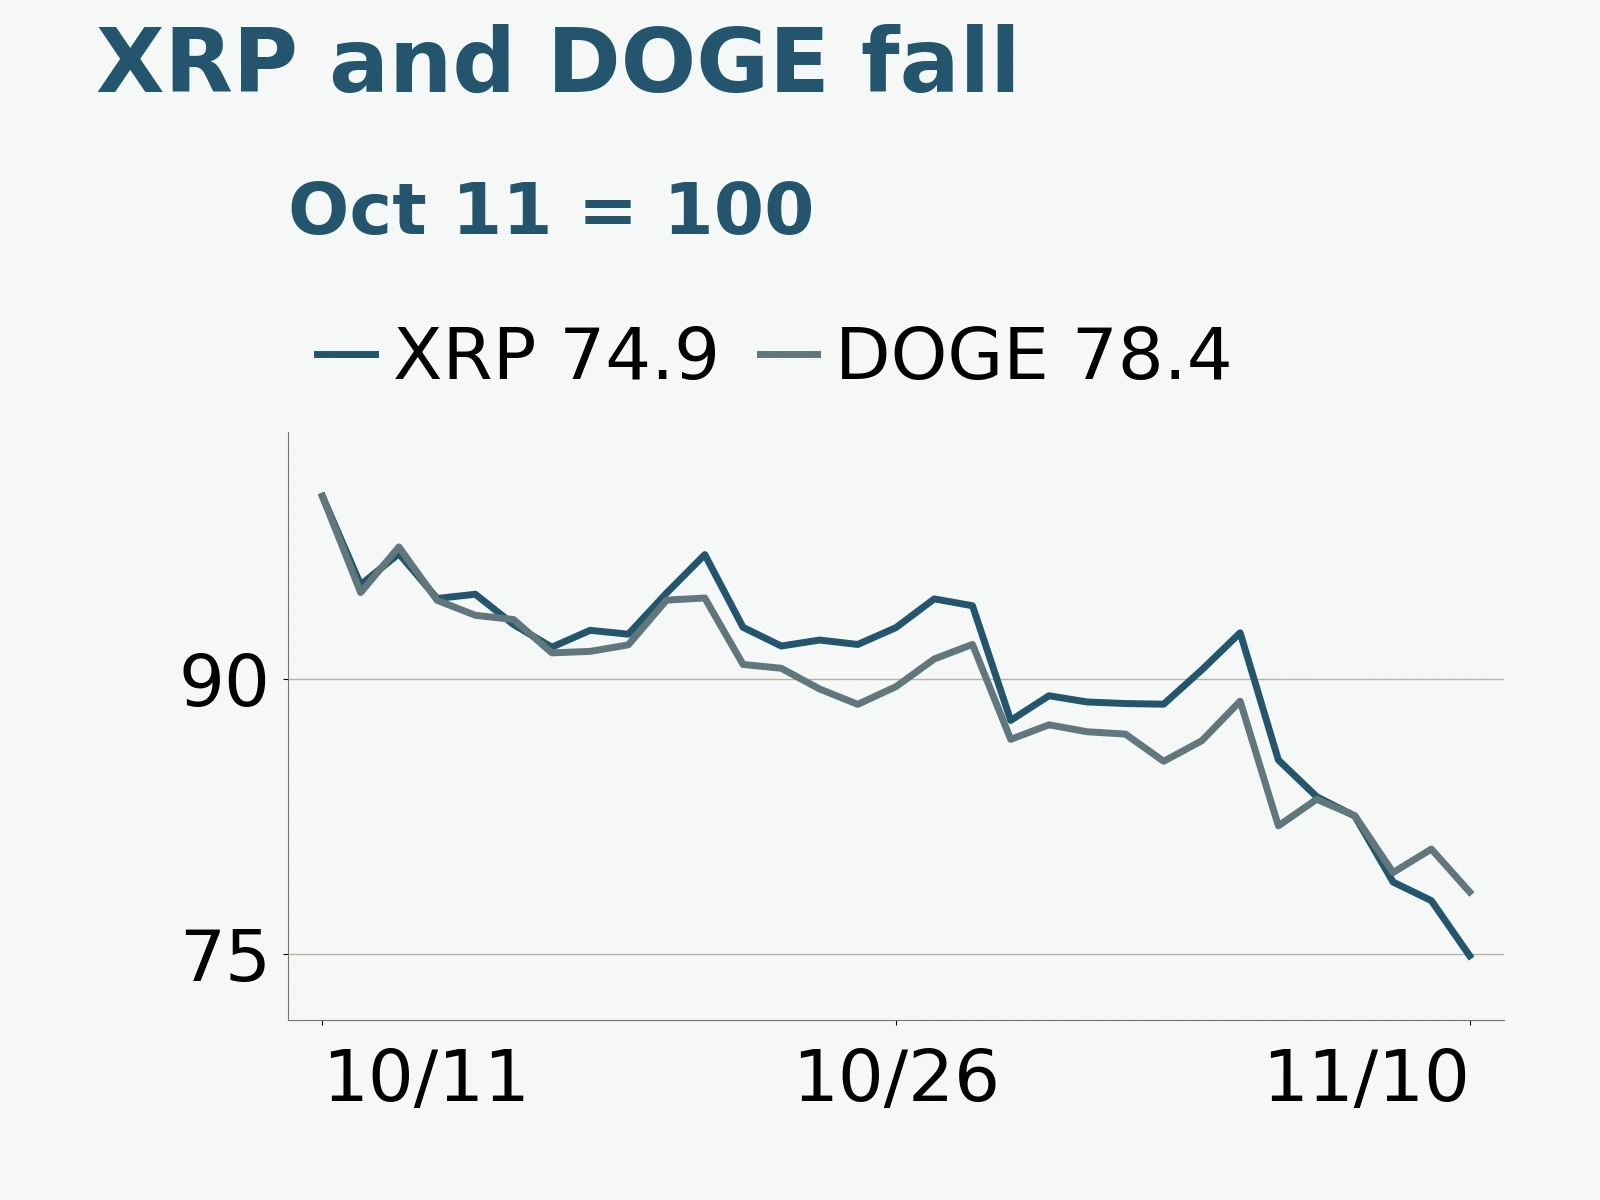
Within the predetermined sample of highly liquid Binance spot assets, BNB closed at 680.58 USDT, down 1.57%; SOL at 83.35 USDT, down 3.91%; XRP at 1.0565 USDT, down 3.86%; and DOGE at 0.06804 USDT, down 2.90%. Including Bitcoin and Ethereum, all six sample assets closed lower. BNB was relatively resilient, while SOL and XRP faced more pronounced pressure; a broad recovery had yet to emerge within the sample.
Near the end of the trading day, CoinGecko data put Bitcoin's share of total cryptocurrency market capitalization, including stablecoins, at about 59.8%. Its large weight keeps Bitcoin an important reference for the overall direction of the crypto market, while ETH/BTC provides a more direct signal of relative strength between the two assets.
Turnover exceeds its 30-day average; a rebound still needs sustained spot demand
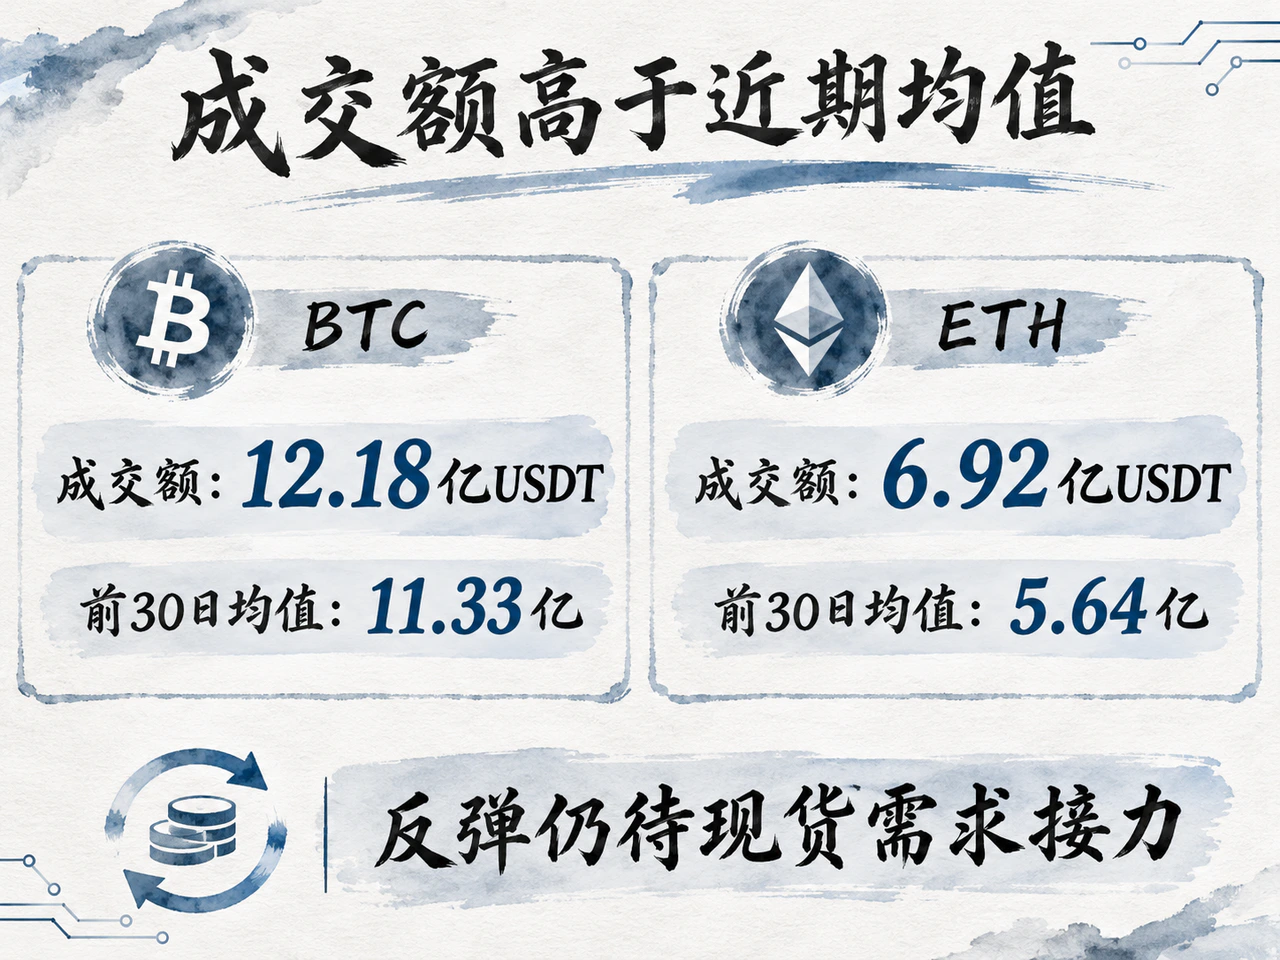
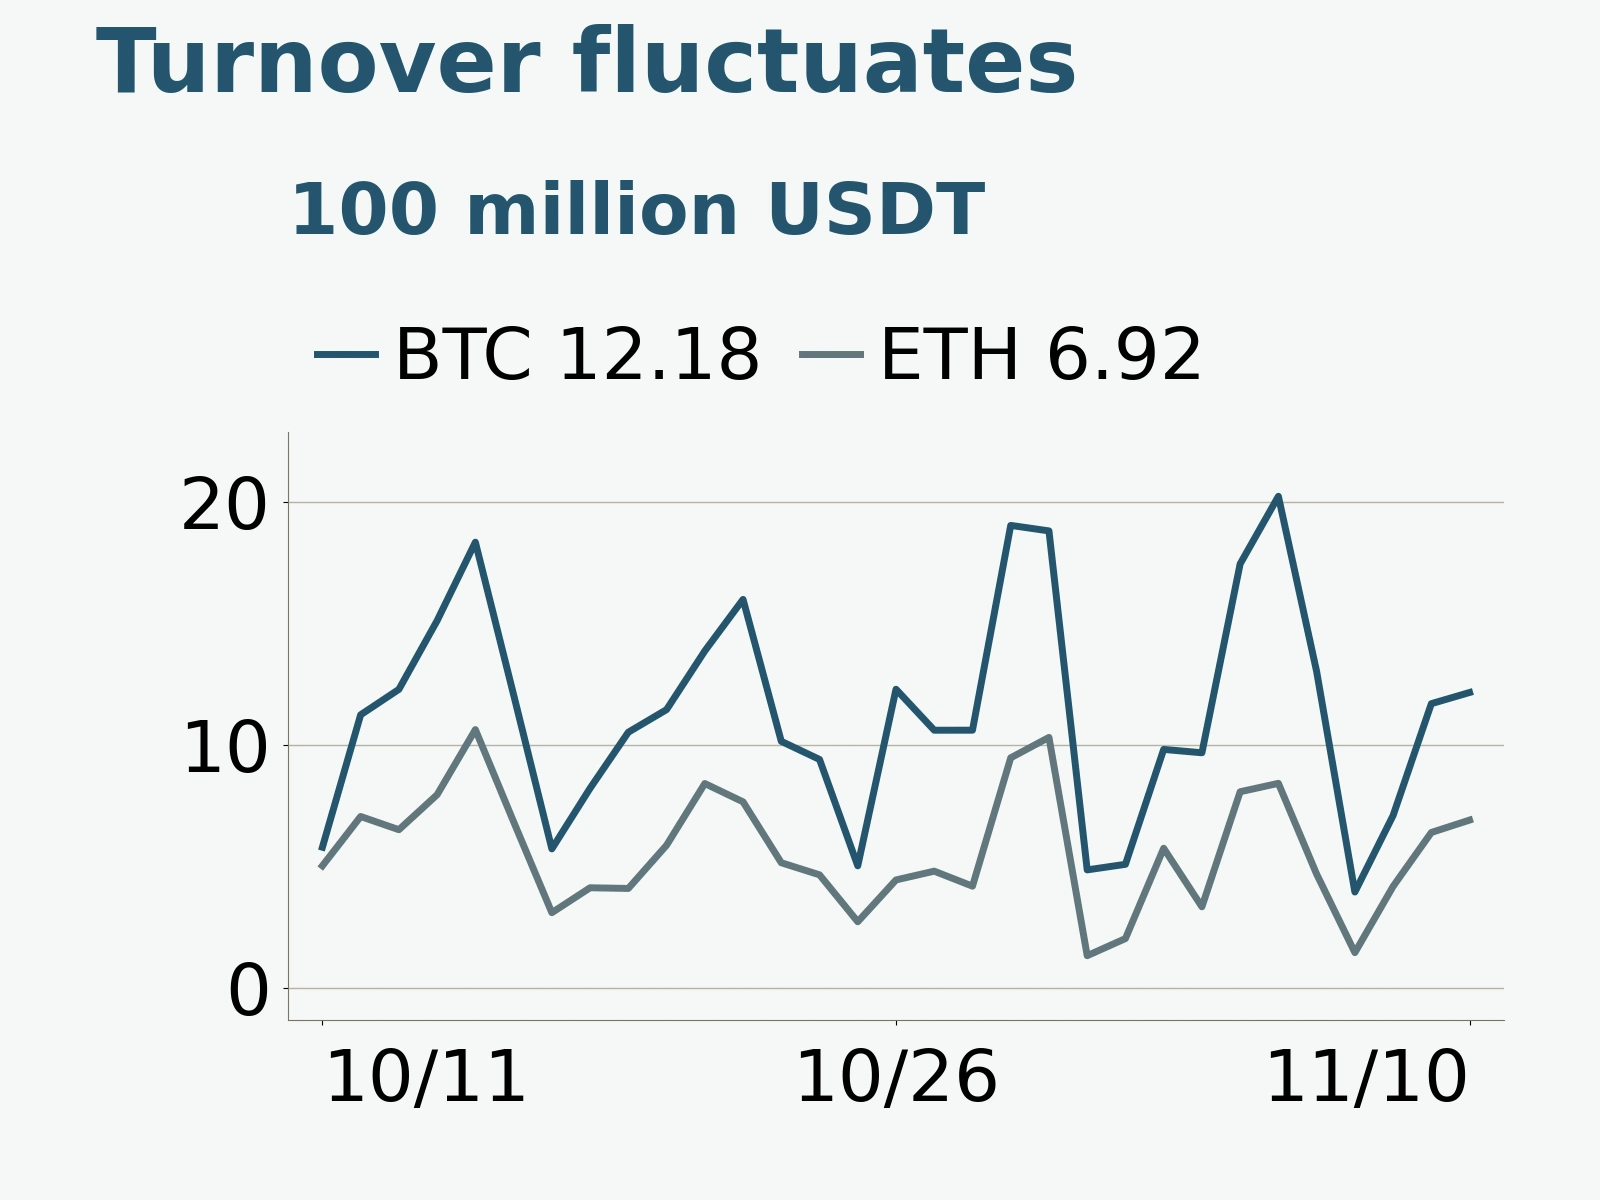
Binance BTCUSDT turnover totaled 1.218 billion USDT that day, slightly above the 1.133 billion USDT average for the preceding 30 complete trading days. ETHUSDT turnover was 692 million USDT, above its corresponding average of 564 million USDT. The decline came with turnover above recent averages, indicating that this adjustment was not confined to exceptionally quiet trading. Turnover includes both buyers and sellers; whether buying support can persist must still be assessed alongside price stabilization and an improvement in relative strength.
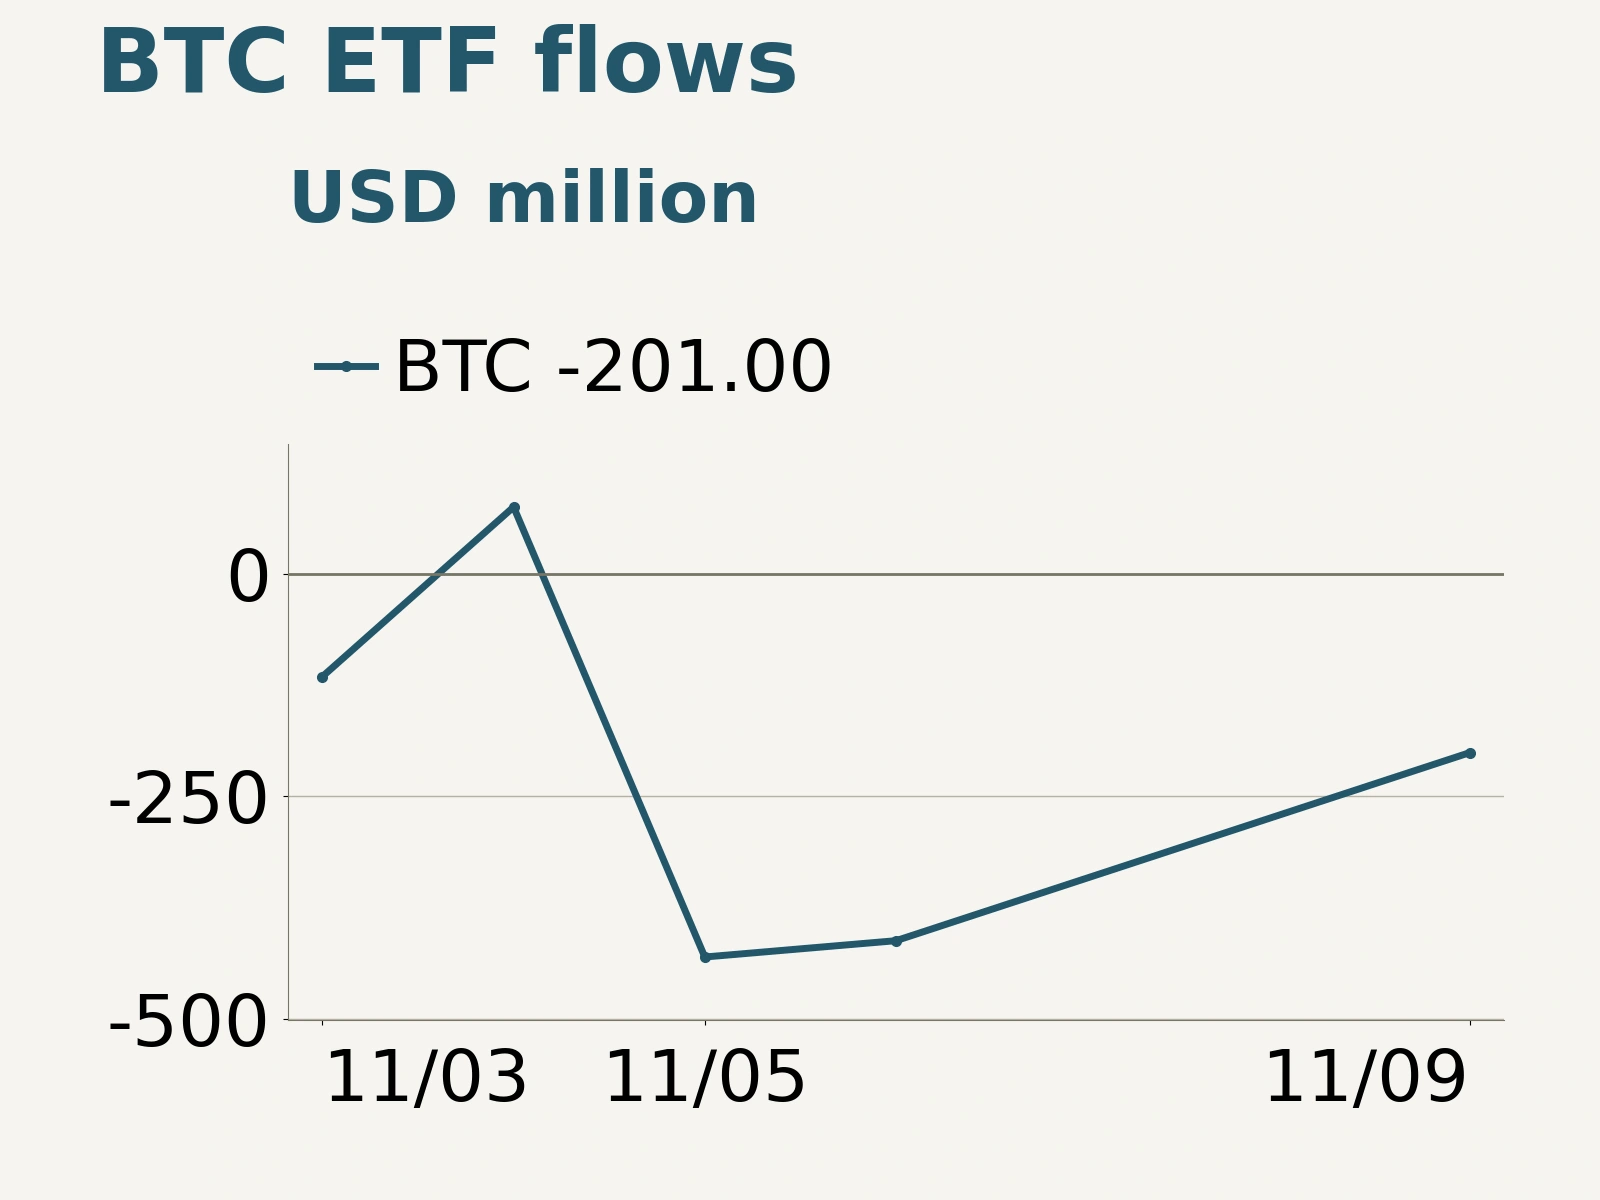
Institutional commentary also focused on the durability of buying. Analysts at BRN and Bitget Wallet interviewed by CoinDesk before the inflation release both argued that milder inflation would provide, at most, a brief respite; a sustained recovery would require stronger spot demand and ETF flows. This view places the conditions for a rebound on the demand side: disappointed expectations for monetary easing can depress valuations, while rebuilding buying interest after a decline also depends on incremental demand within the crypto market itself.
Debate in the Ethereum community points to a longer-term question of value capture. In a November 10 discussion on r/ethereum, some participants remained positive about the technical roadmap and the network's long-term applications, while others questioned how much value progress in applications would ultimately deliver to ETH holders. Community views do not represent investors as a whole, but they raise a question relevant to relative price weakness: how does greater network use translate into sustained demand for the token? Answering it requires examining fees, supply and actual demand to hold ETH together. Technical progress alone cannot explain the token's investment returns.
Taken together, the market faces two layers of pressure: inflation limits the room for interest rates to fall, while differences in returns across coins encourage more cautious allocation of risk exposure. A firmer foundation for a rebound would require Bitcoin to stop falling, ETH/BTC to stabilize at the same time, and sustained spot demand to emerge. If intraday recoveries occur while relative weakness persists, the market will remain primarily in the process of absorbing its drawdown, without an established broad uptrend.
Click through to the original article for further details.