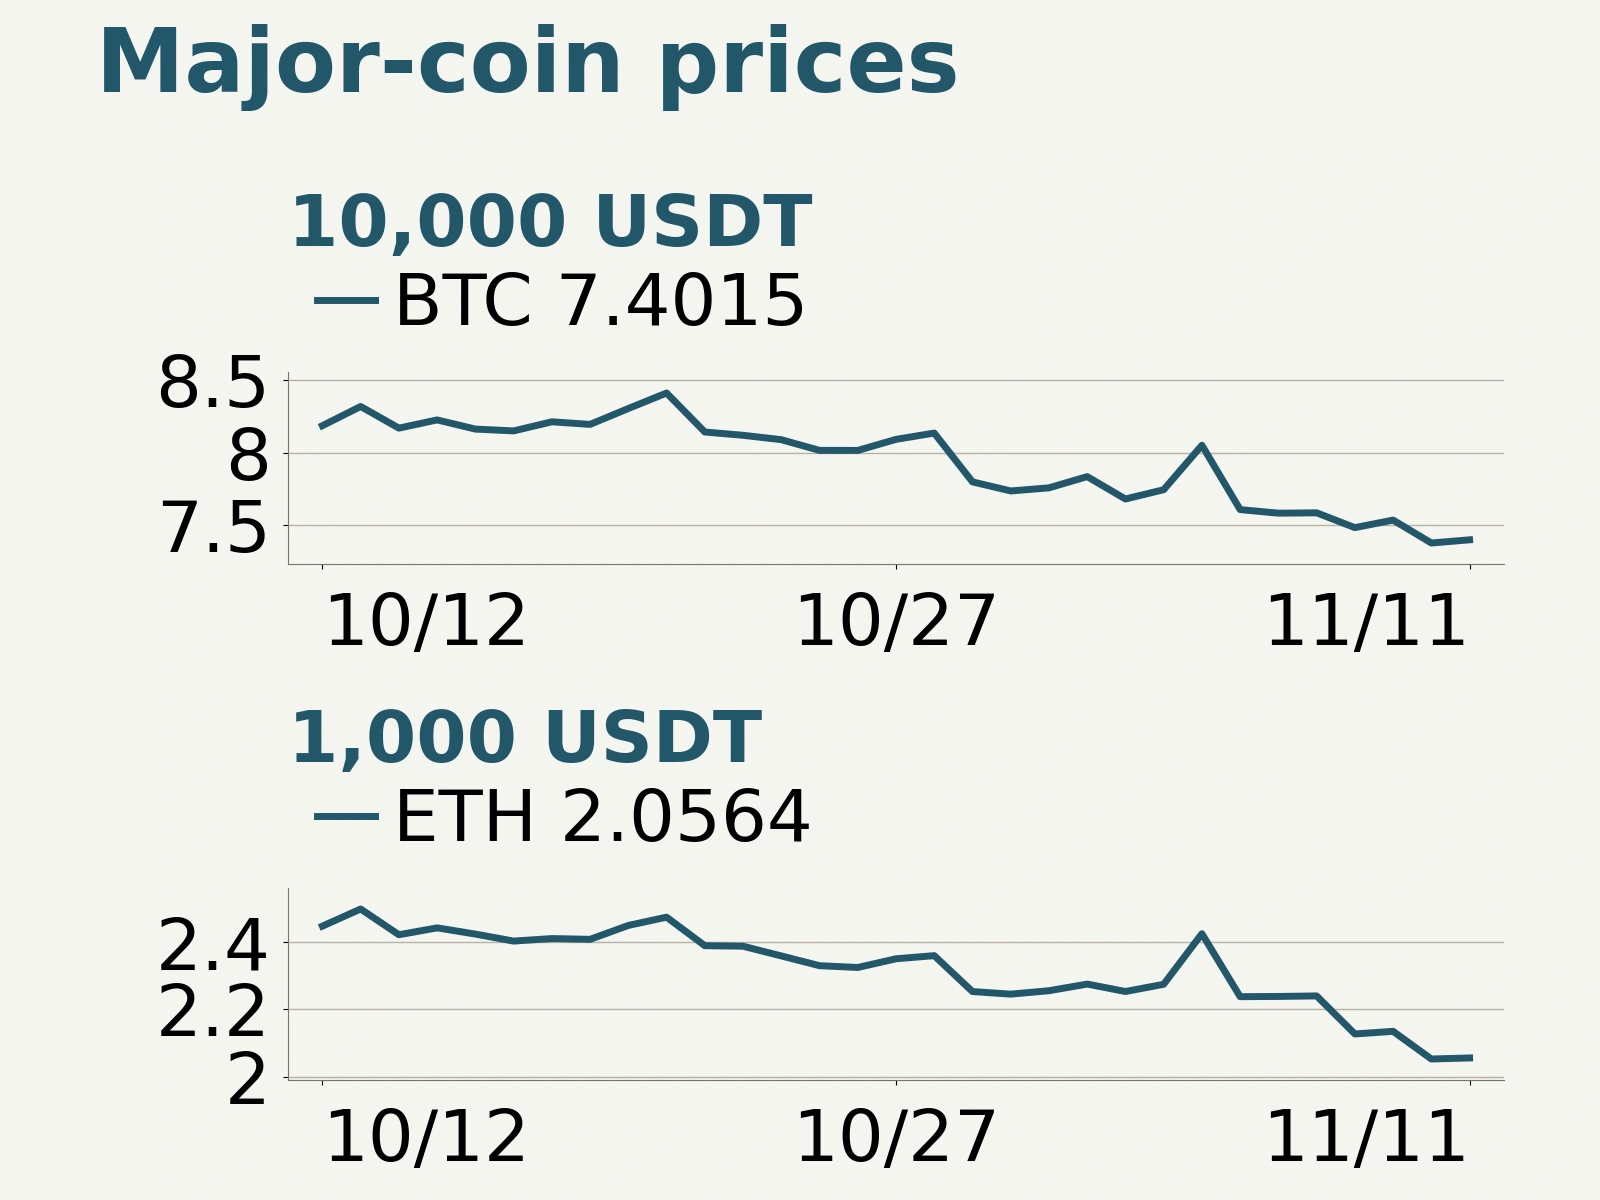
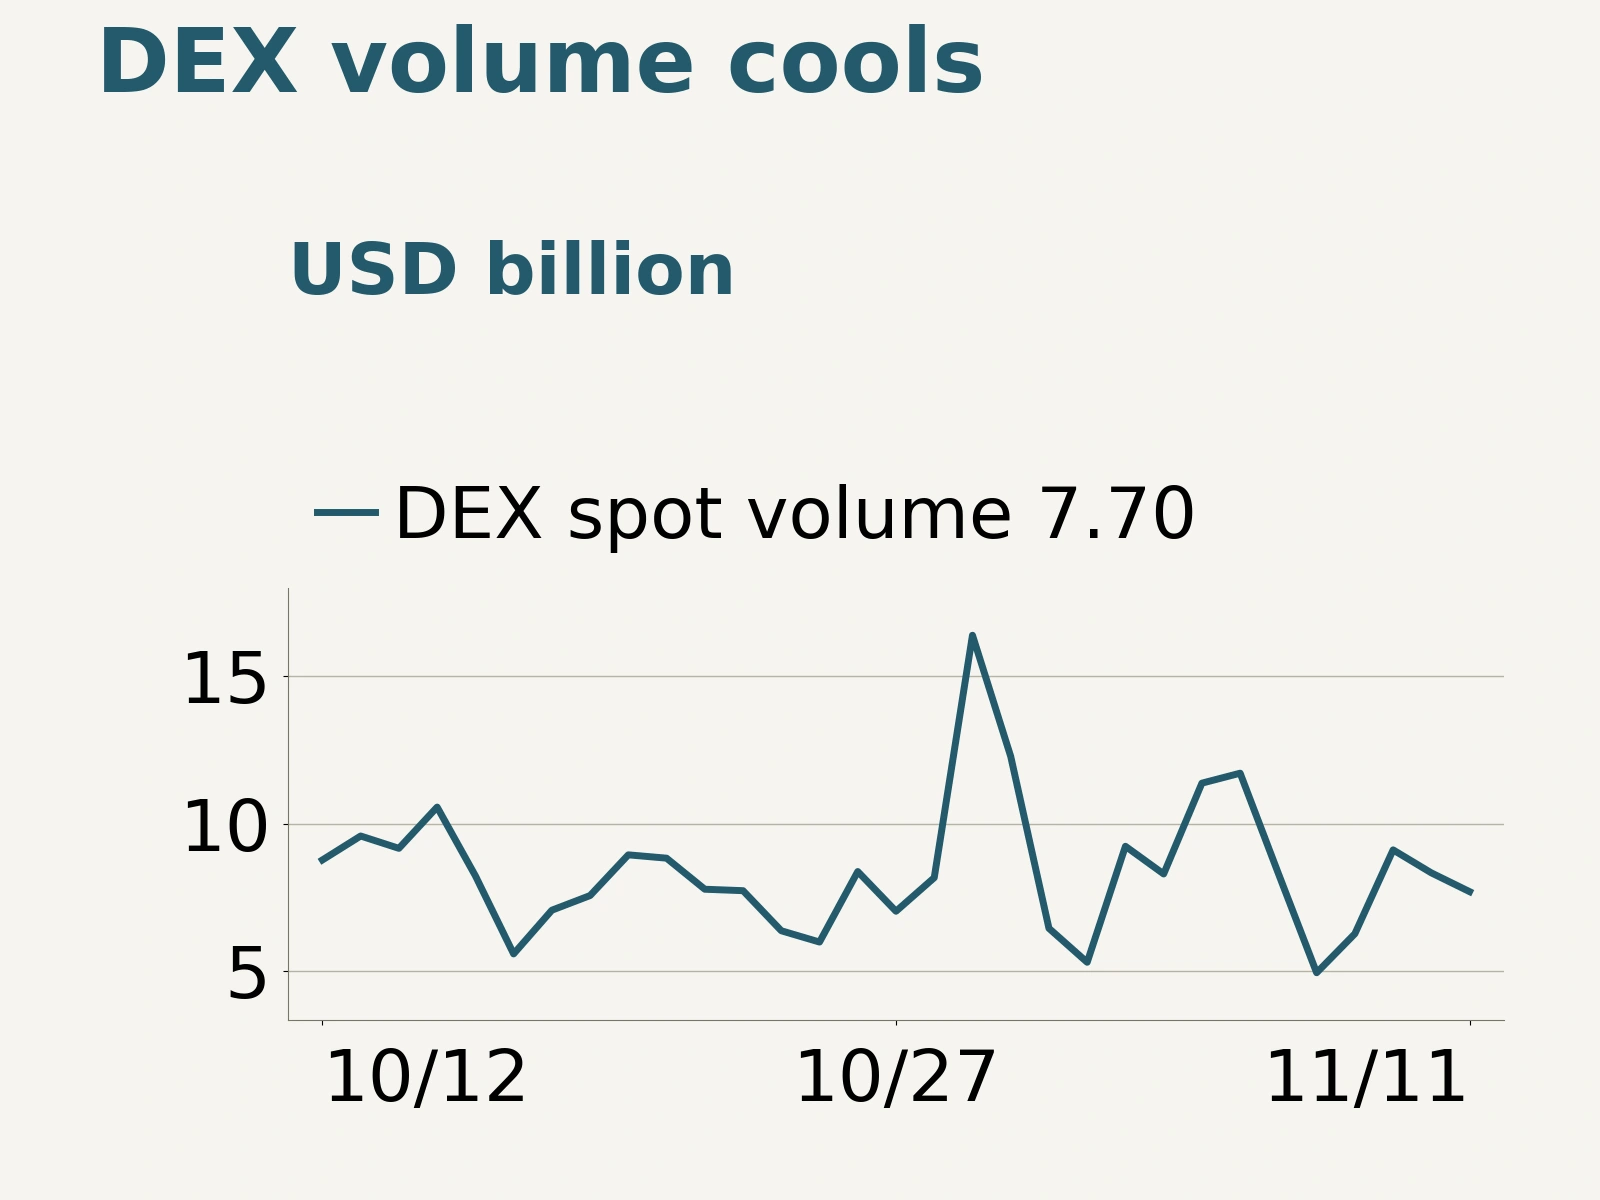
On November 11, 2026, Glassnode said in its weekly report that Bitcoin's main constraint remained a shortage of fresh capital: stablecoin supply was contracting, US spot ETFs continued to face redemptions, and US spot buying had yet to recover meaningfully. At the same time, daily ETF outflows were shrinking, while derivatives traders were repositioning after liquidations. Easing selling pressure creates conditions for prices to stabilize, but sustained support for a rebound still depends on capital flows turning from withdrawals to inflows.
Four consecutive days of ETF outflows; stablecoin market capitalization falls 4.72% in 30 days
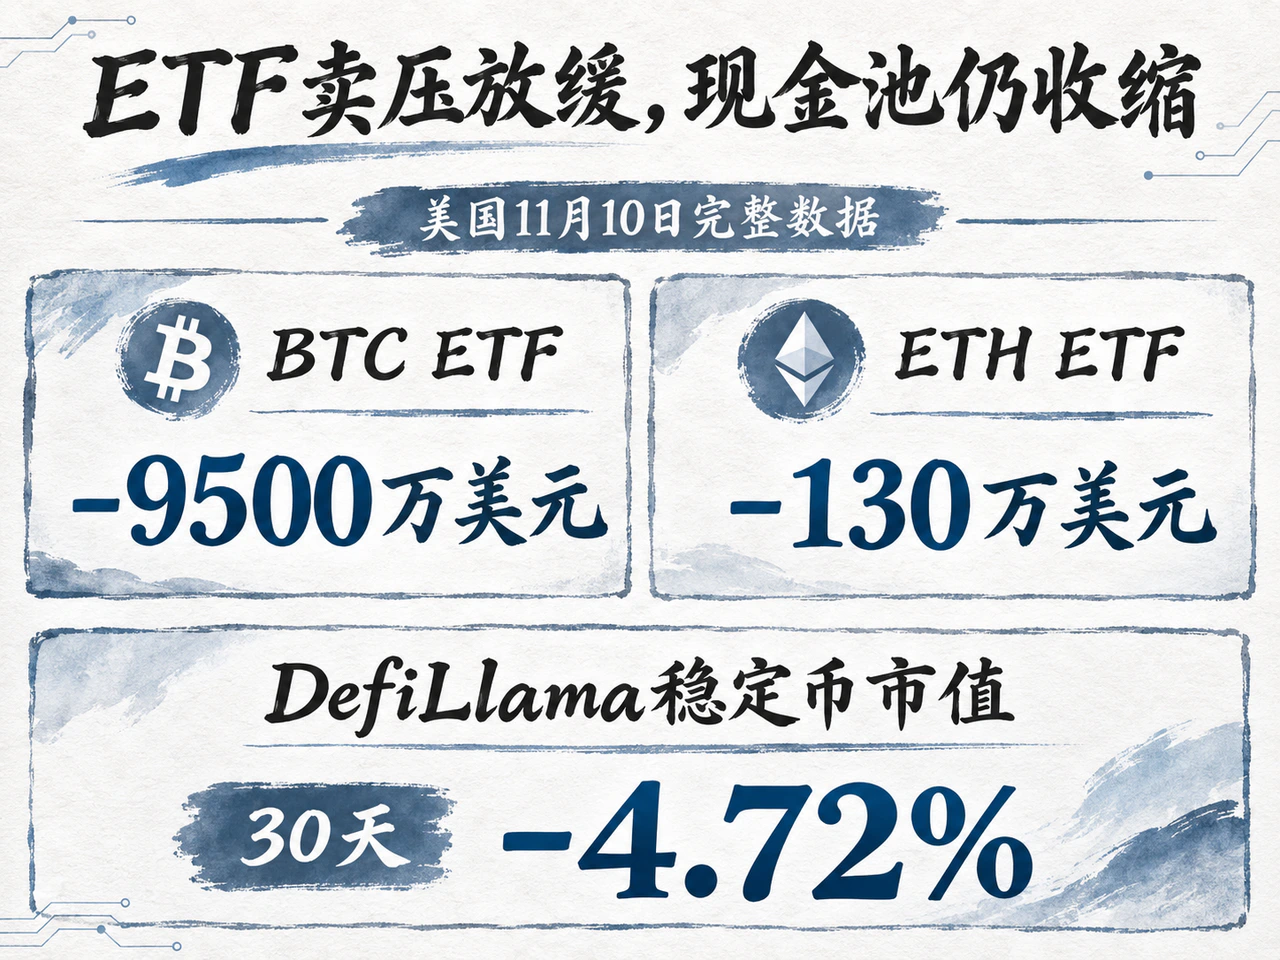
Farside's fully reported US trading-day data show that US spot Bitcoin ETFs recorded net outflows of $95 million on November 10, their fourth consecutive trading day of redemptions, although the daily outflow continued to narrow. Net outflows on November 5, 6 and 9 were $430.2 million, $411.9 million and $201 million, respectively, bringing the four-day total to $1.1381 billion. Capital was still leaving, but at a slower pace.
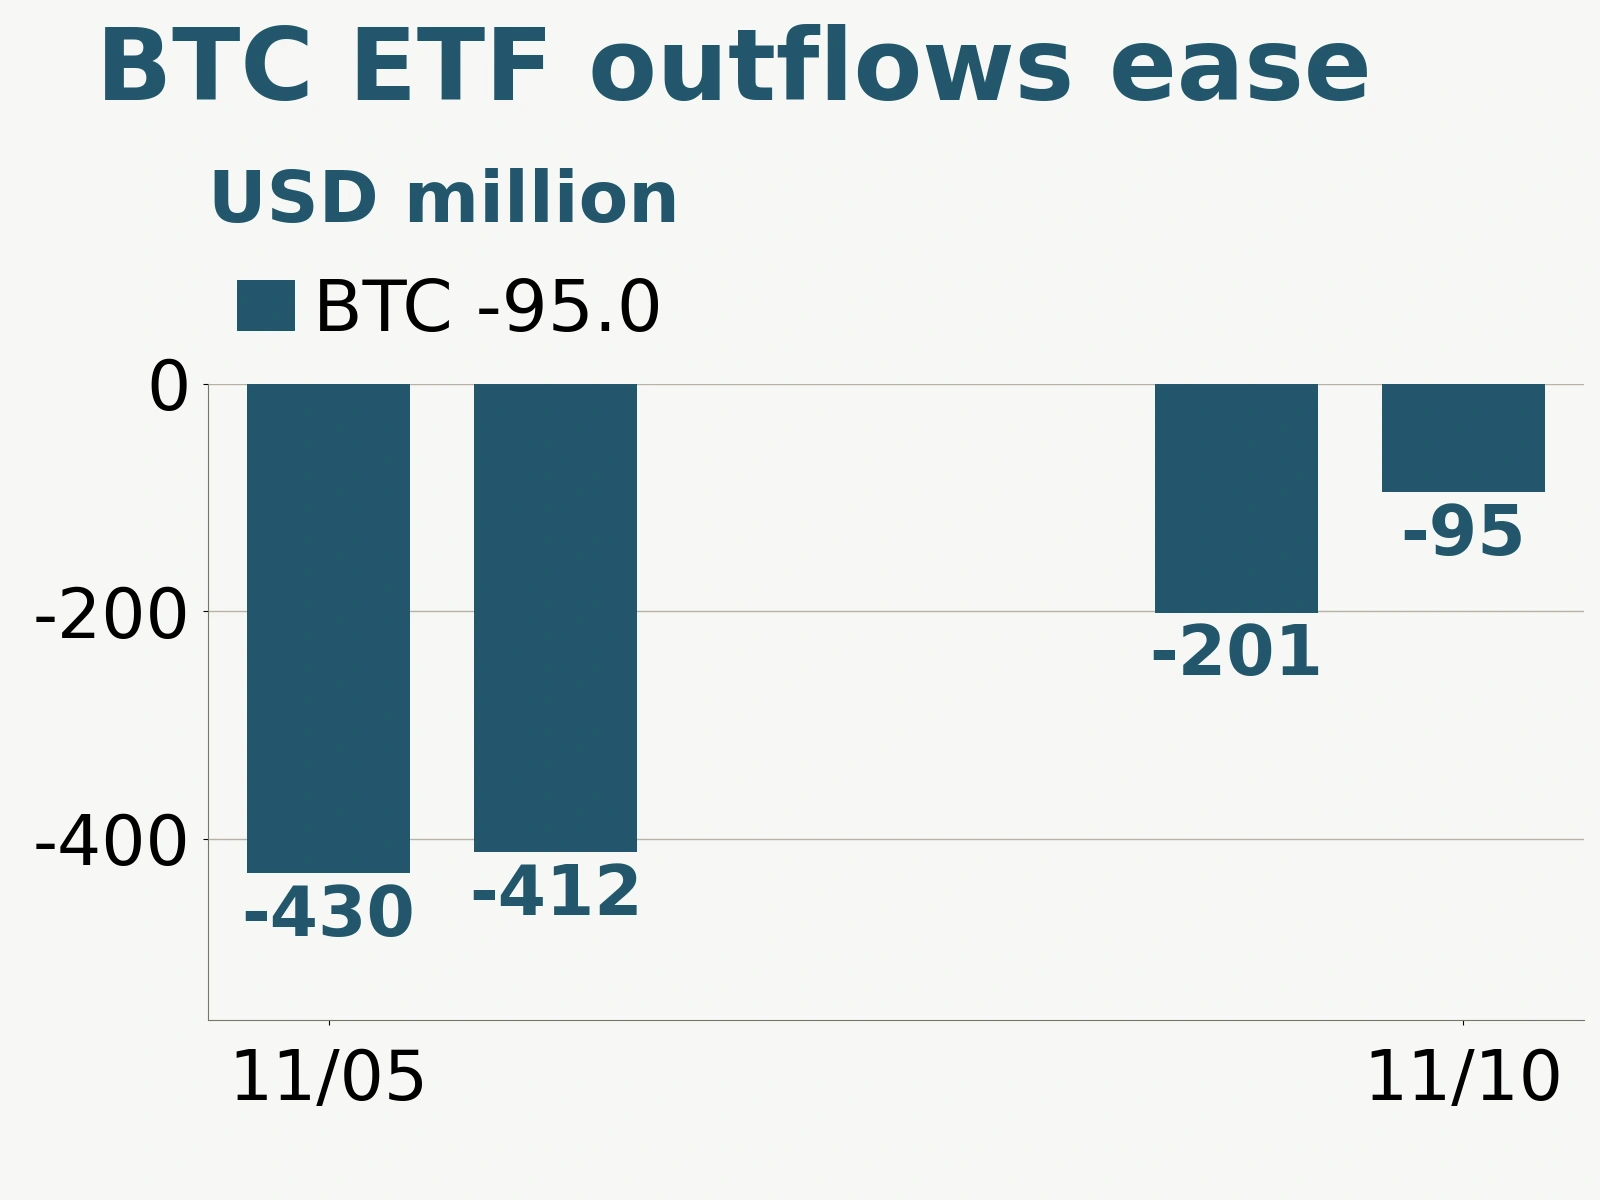
Smaller redemptions ease marginal selling pressure in the spot market, making prices easier to sustain even with limited fresh buy orders; a continuing rally would still require subscriptions to resume. Product-level differences were also clear on November 10: IBIT and FBTC saw net outflows of $78.2 million and $36.8 million, respectively, while MSBT attracted $20 million in net inflows, offsetting part of the redemptions. Inflows into individual products have yet to reverse net outflows across the channel.
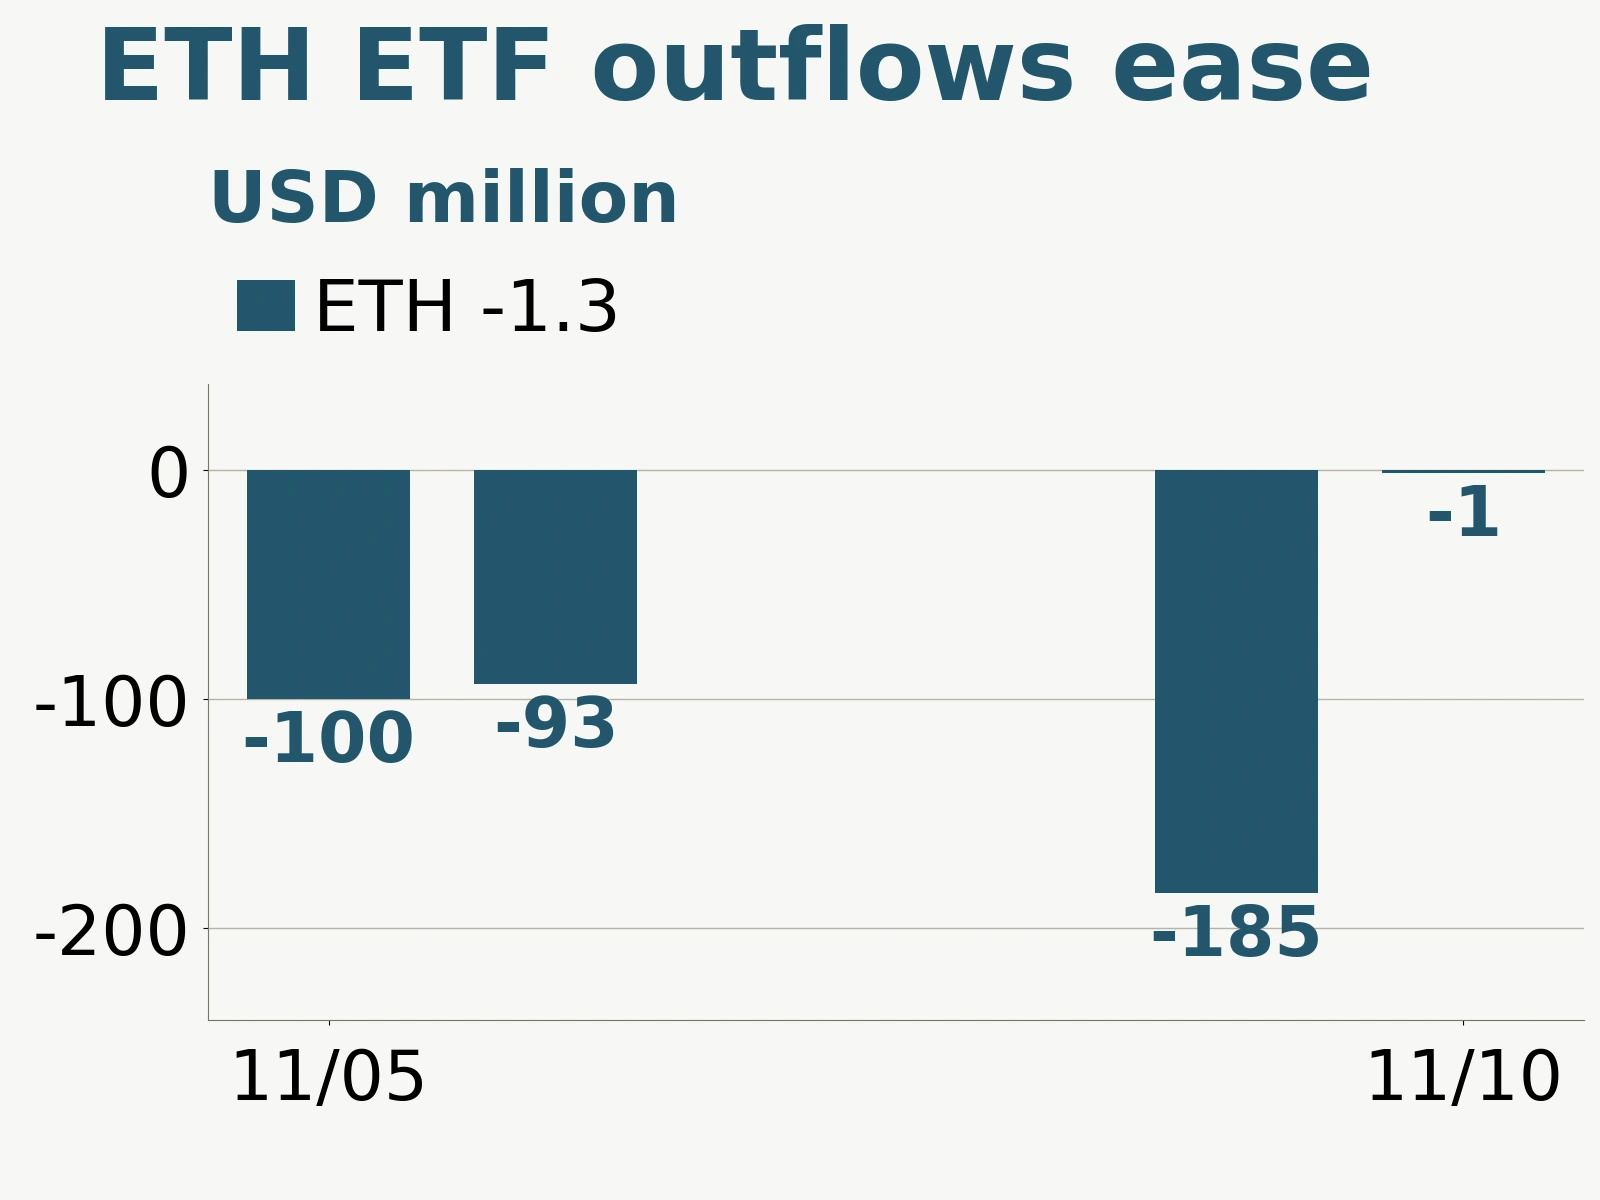
The marginal improvement in spot Ether ETFs was more pronounced: net outflows were $1.3 million on November 10, far below the $184.6 million recorded on November 9. Cumulative net outflows over the four trading days from November 5 to 10 were $379.1 million. Daily flows were approaching balance; the next question is whether that improvement can persist over several trading days and extend across more major products.
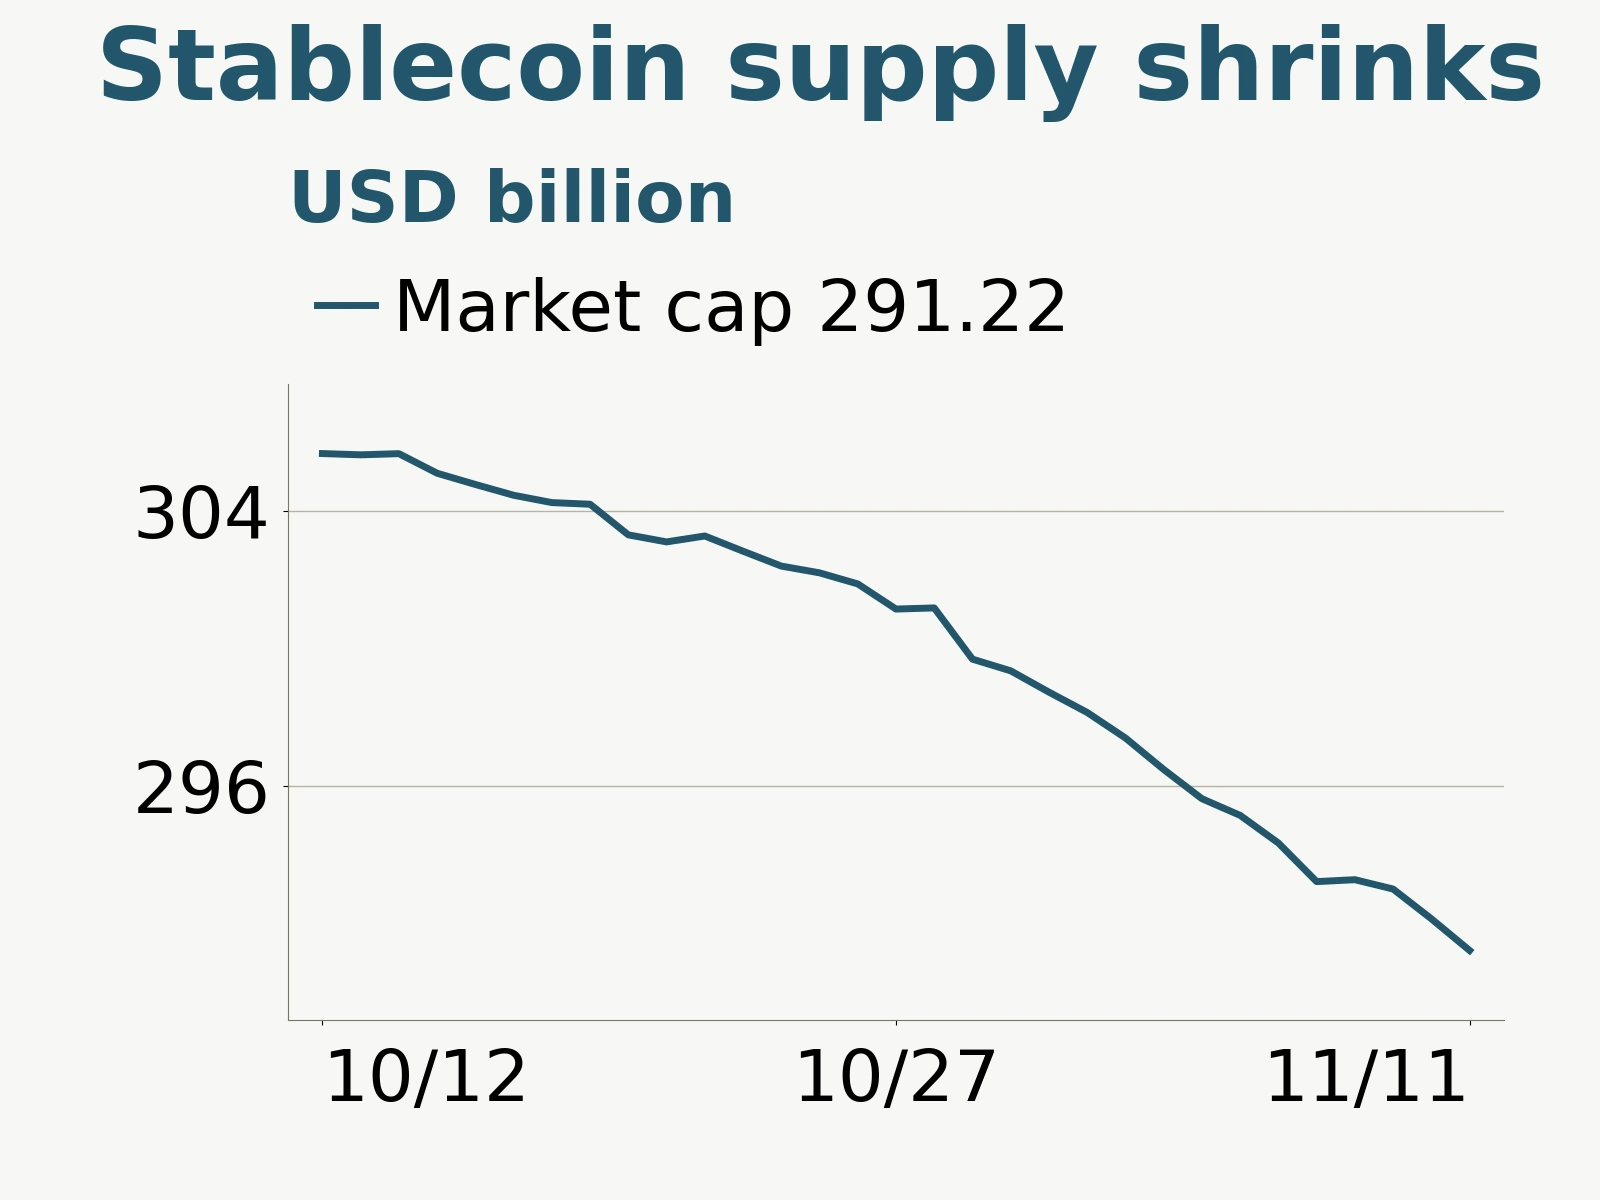
Stablecoin supply has yet to turn around. DefiLlama's aggregate dollar circulating market capitalization across all tracked peg currencies stood at approximately $291.22 billion in the daily observation at 00:00 UTC on November 11, down $14.44 billion, or 4.72%, from 30 days earlier. This measure reflects changes in stablecoin supply and valuation rather than net deposits into exchanges. A smaller supply base thins the capital buffer available for trading, collateral and settlement, leaving a price rebound more dependent on faster turnover of existing funds or renewed inflows of external capital.
Using its own coverage, Glassnode reported that stablecoin supply had fallen by $14.2 billion over the 30 days through November 9, consistent in direction with the figures above. The report also noted that the 30-day average Coinbase premium remained negative after adjusting for USDT's deviation from $1. Together, contracting stablecoin supply and relatively weak US spot pricing indicate that a recovery in active buying remains crucial even as ETF redemptions slow.
Bitcoin perpetual open interest falls 2.93%; demand for options protection persists
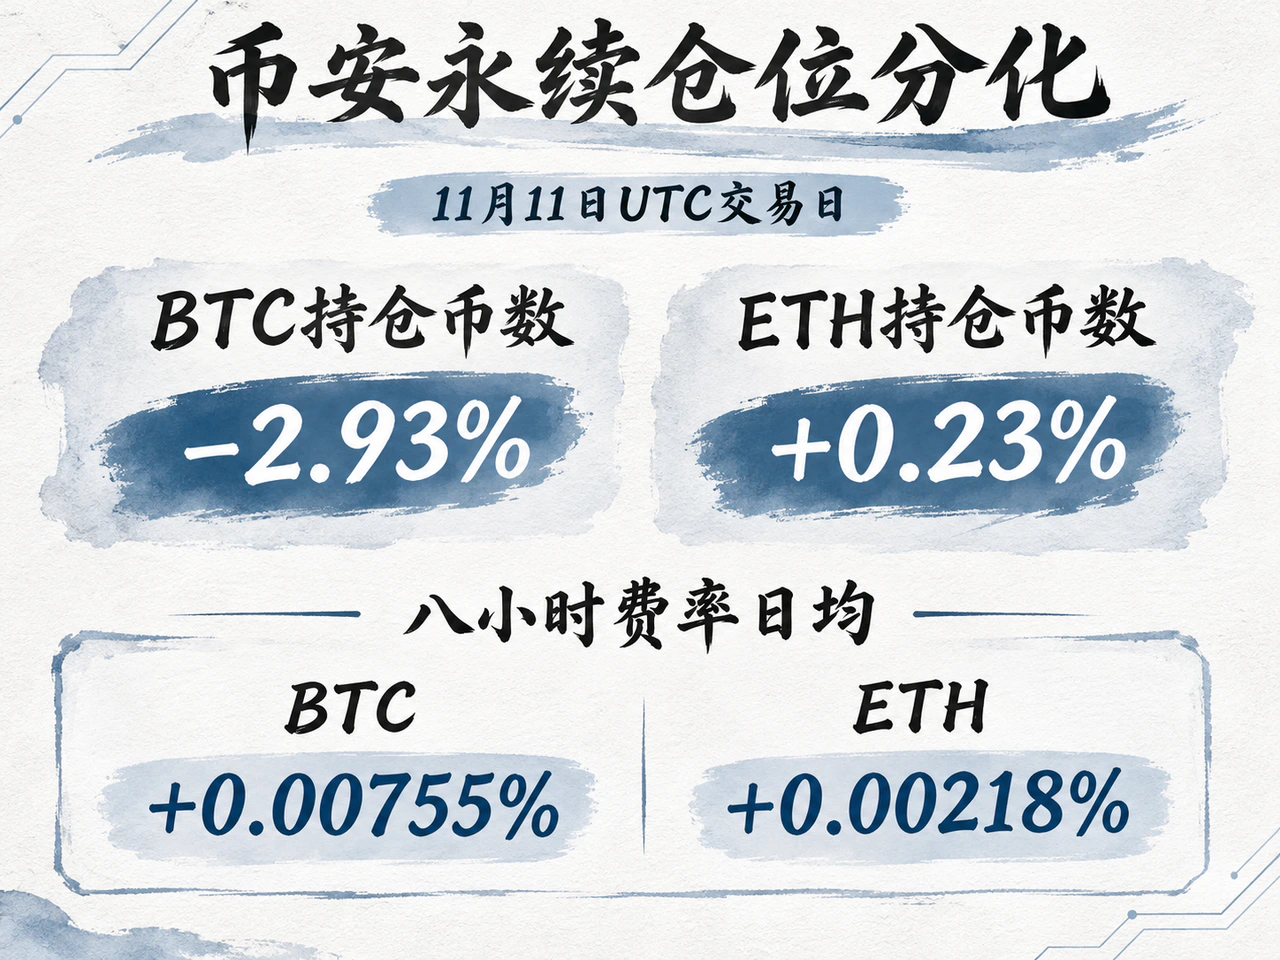
Derivatives markets are diverging. Daily boundary snapshots of Binance USD-margined perpetual contracts show that, between 00:00 UTC on November 11 and 00:00 UTC on November 12, the quantity of underlying coins represented by BTCUSDT open interest fell from approximately 99,545 BTC to 96,626 BTC, a decline of 2.93%. ETHUSDT rose from about 2.2769 million ETH to 2.2822 million ETH, an increase of 0.23%. Measuring open interest in coin quantities avoids the effect of changing coin prices on its dollar value, making the reduction in Bitcoin positions clearer.
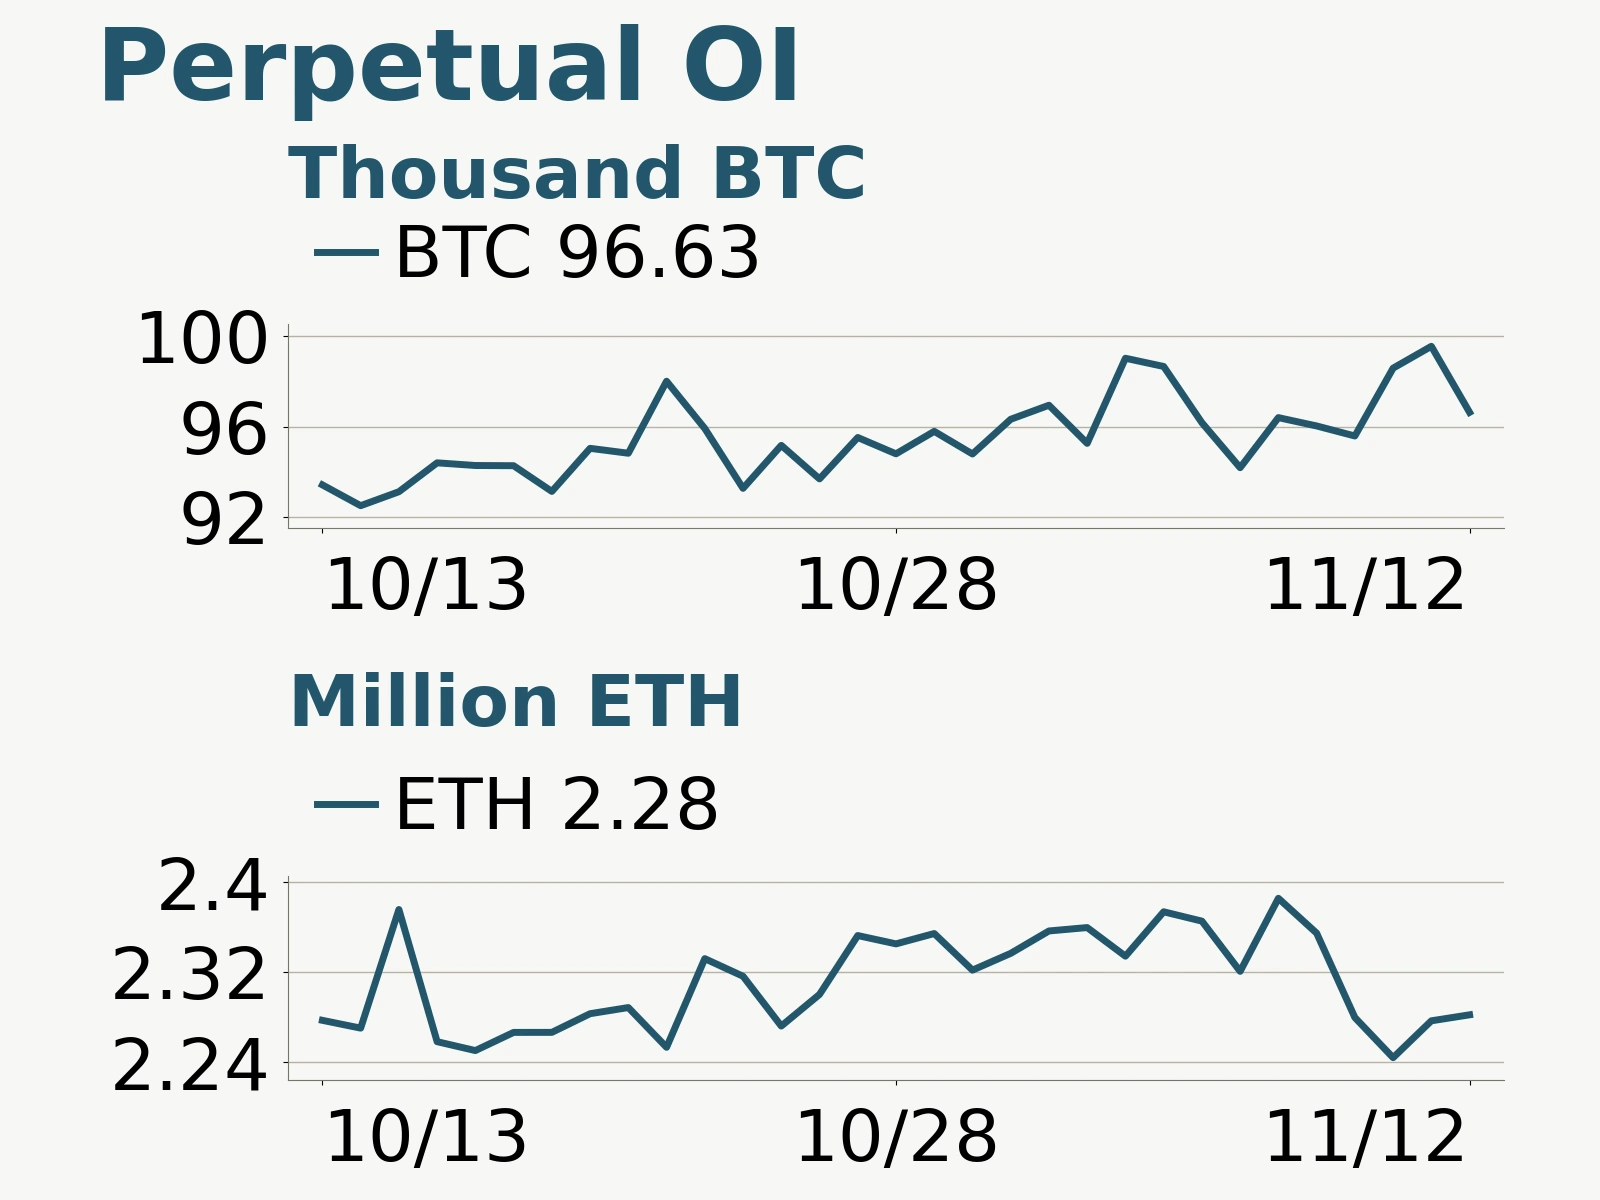
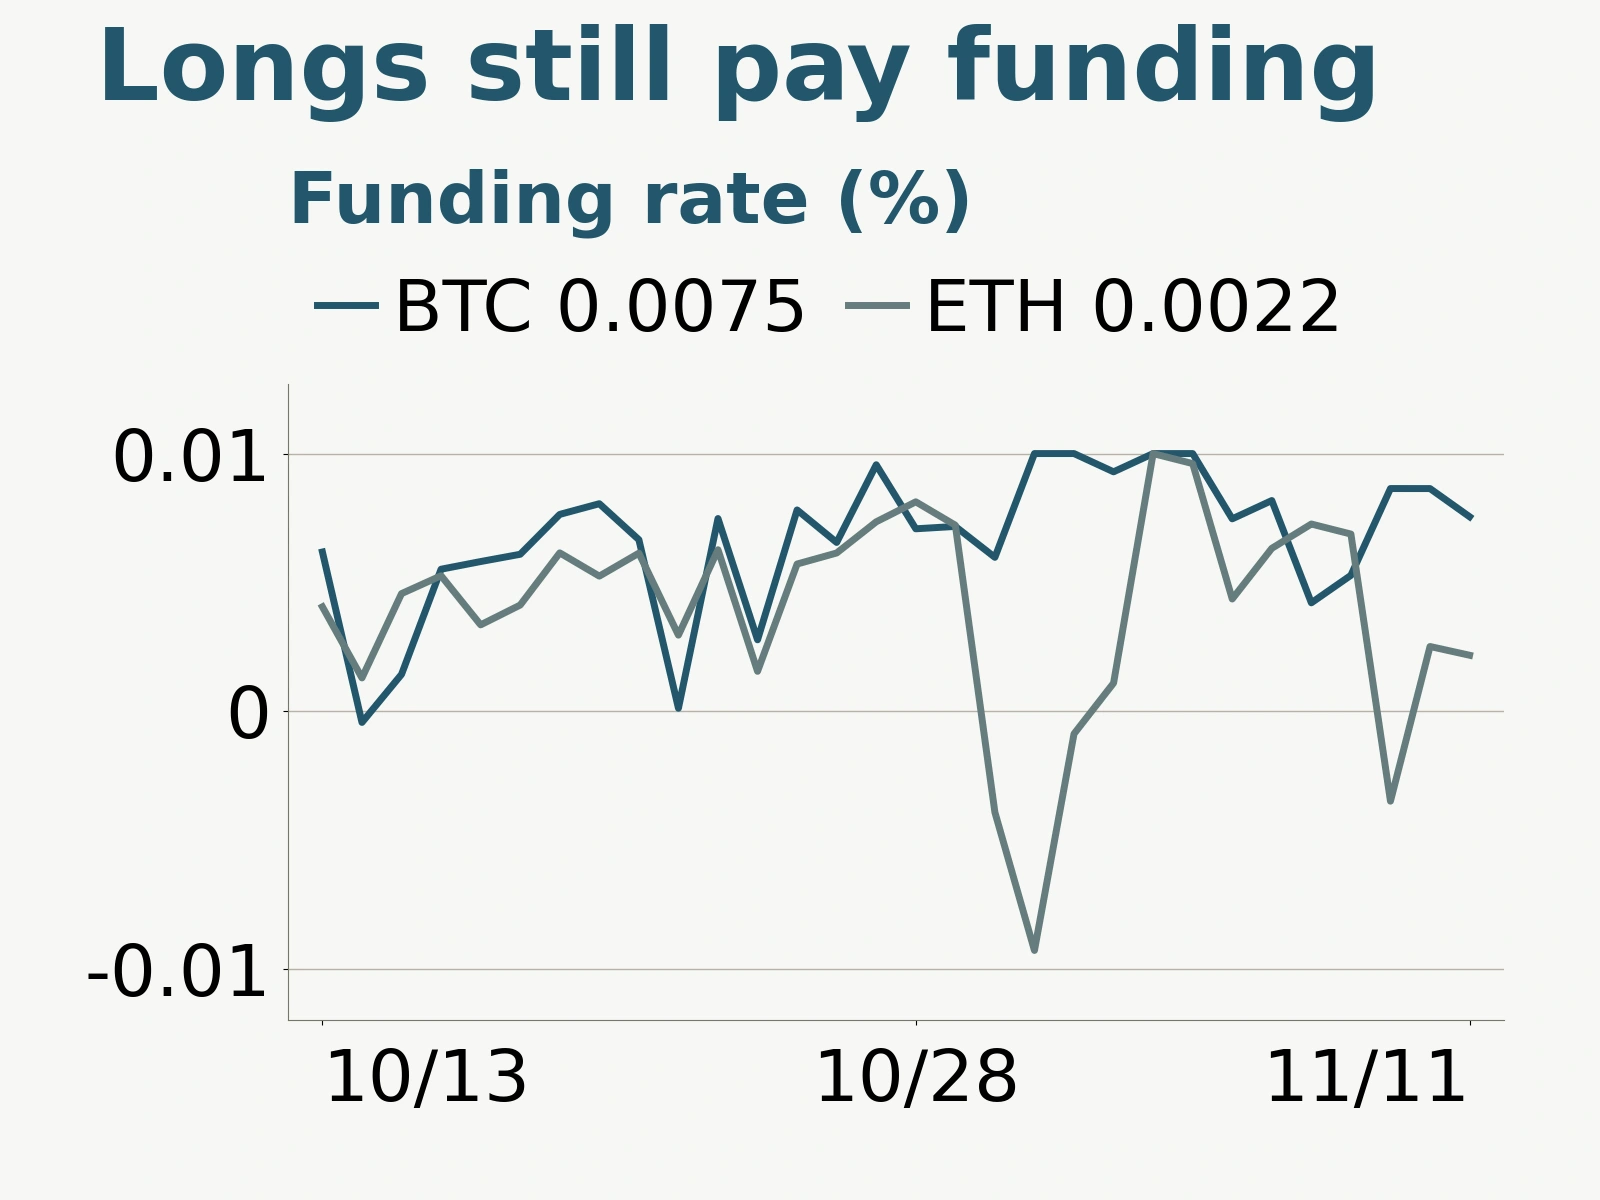
Funding rates show that longs still pay to hold positions, although positioning pressure differs between the two assets. On November 11, the arithmetic mean of BTCUSDT's three eight-hour settlement rates was 0.00755%, while ETHUSDT's was 0.00218%; both were positive. ETHUSDT's first settlement rate of the day was still negative, before turning positive at the next two settlements. Falling Bitcoin open interest alongside positive funding indicates that longs continued to pay to maintain positions after the adjustment. Ether open interest rose slightly with a lower average funding rate, showing that the pricing of leverage was not moving in step with Bitcoin.
Options traders continue to buy downside protection. Citing Deribit trading activity on November 11, CoinDesk reported that eight of the ten most actively traded Bitcoin contracts expiring no later than November 27 were puts with strikes of $69,000 to $74,000 and implied volatility of approximately 36% to 38%. Active trading in protective contracts without a corresponding surge in implied volatility indicates that investors were still hedging downside risk, but had yet to broadly increase the price they would pay for extreme volatility.
Glassnode's analysis of liquidation distributions suggested that the preceding decline had already cleared a substantial share of the liquidation levels for leveraged longs near the current price, while some larger wallets had begun accumulating. The resulting reduction in potential forced selling helps the market absorb redemptions and explains why prices may temporarily stabilize despite weak capital flows. More lasting improvement requires ETF outflows to give way to sustained net subscriptions, stablecoin supply to recover, and US spot buying to strengthen. Contract markets can complete their adjustment first; the recovery in capital supply determines how far a rally can run.
Click “Read Original” for the full details.