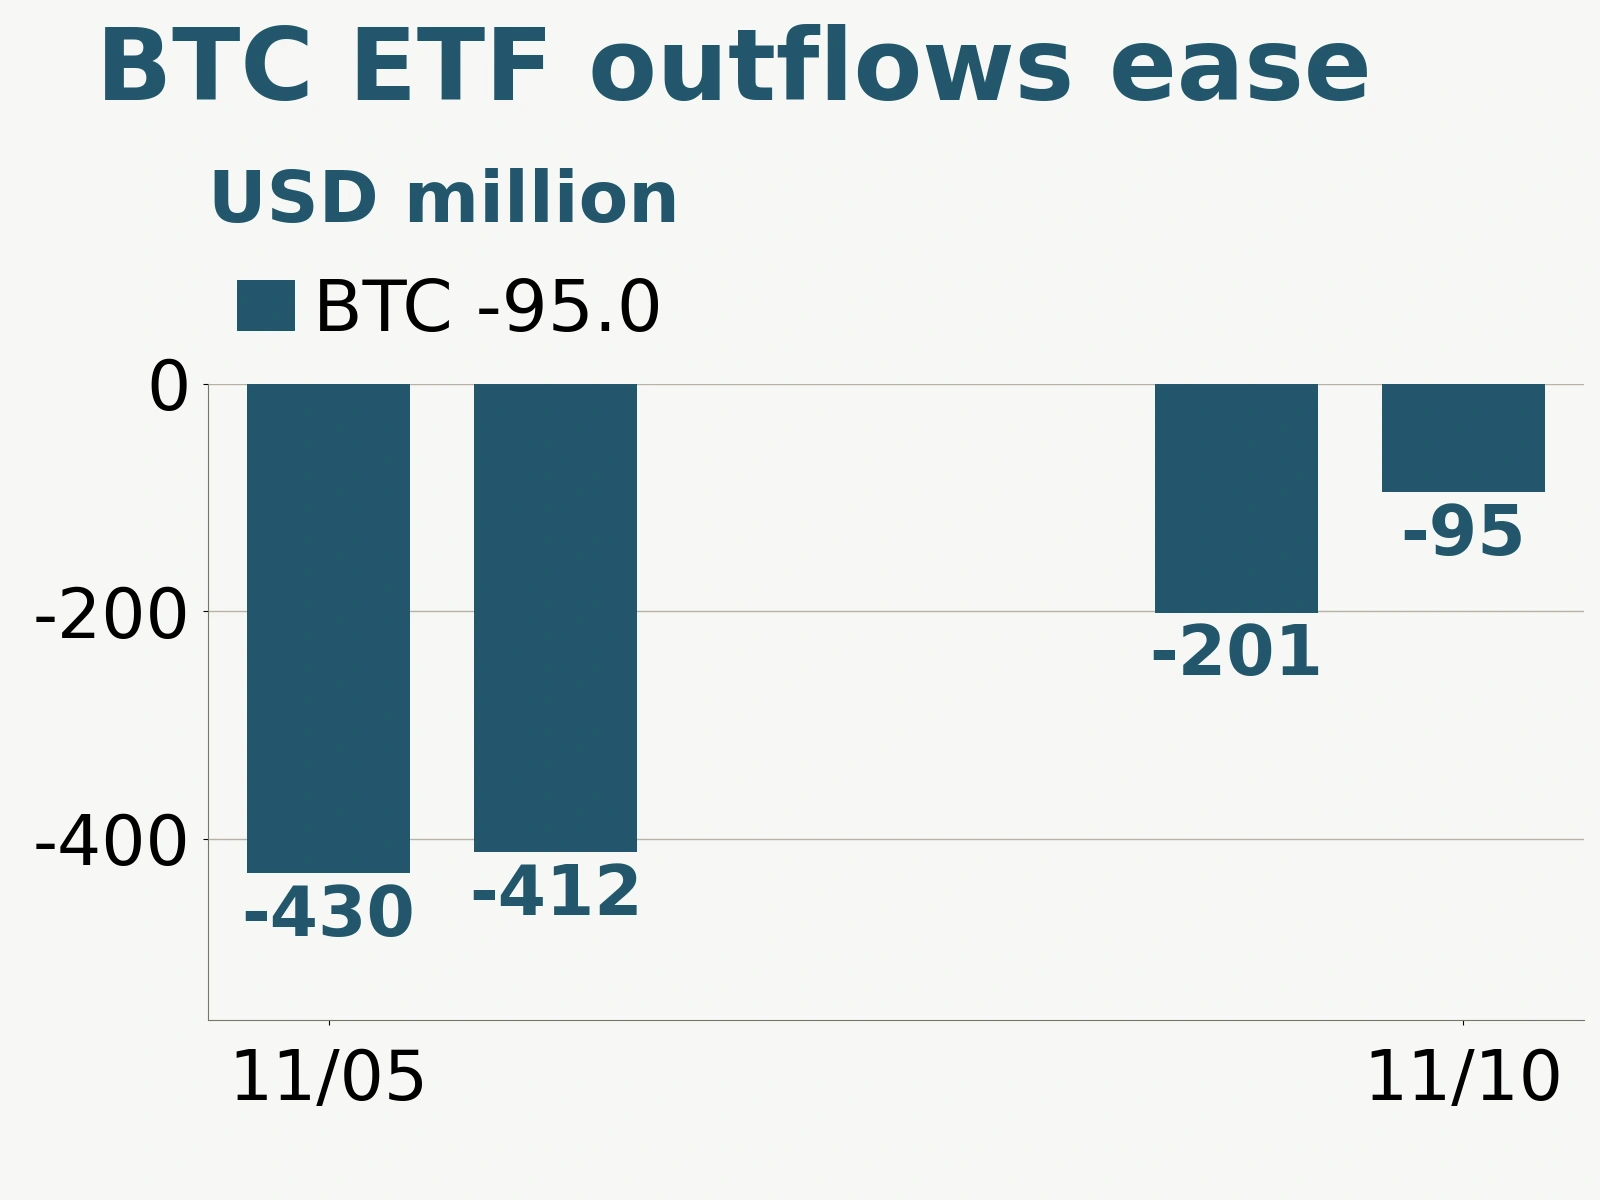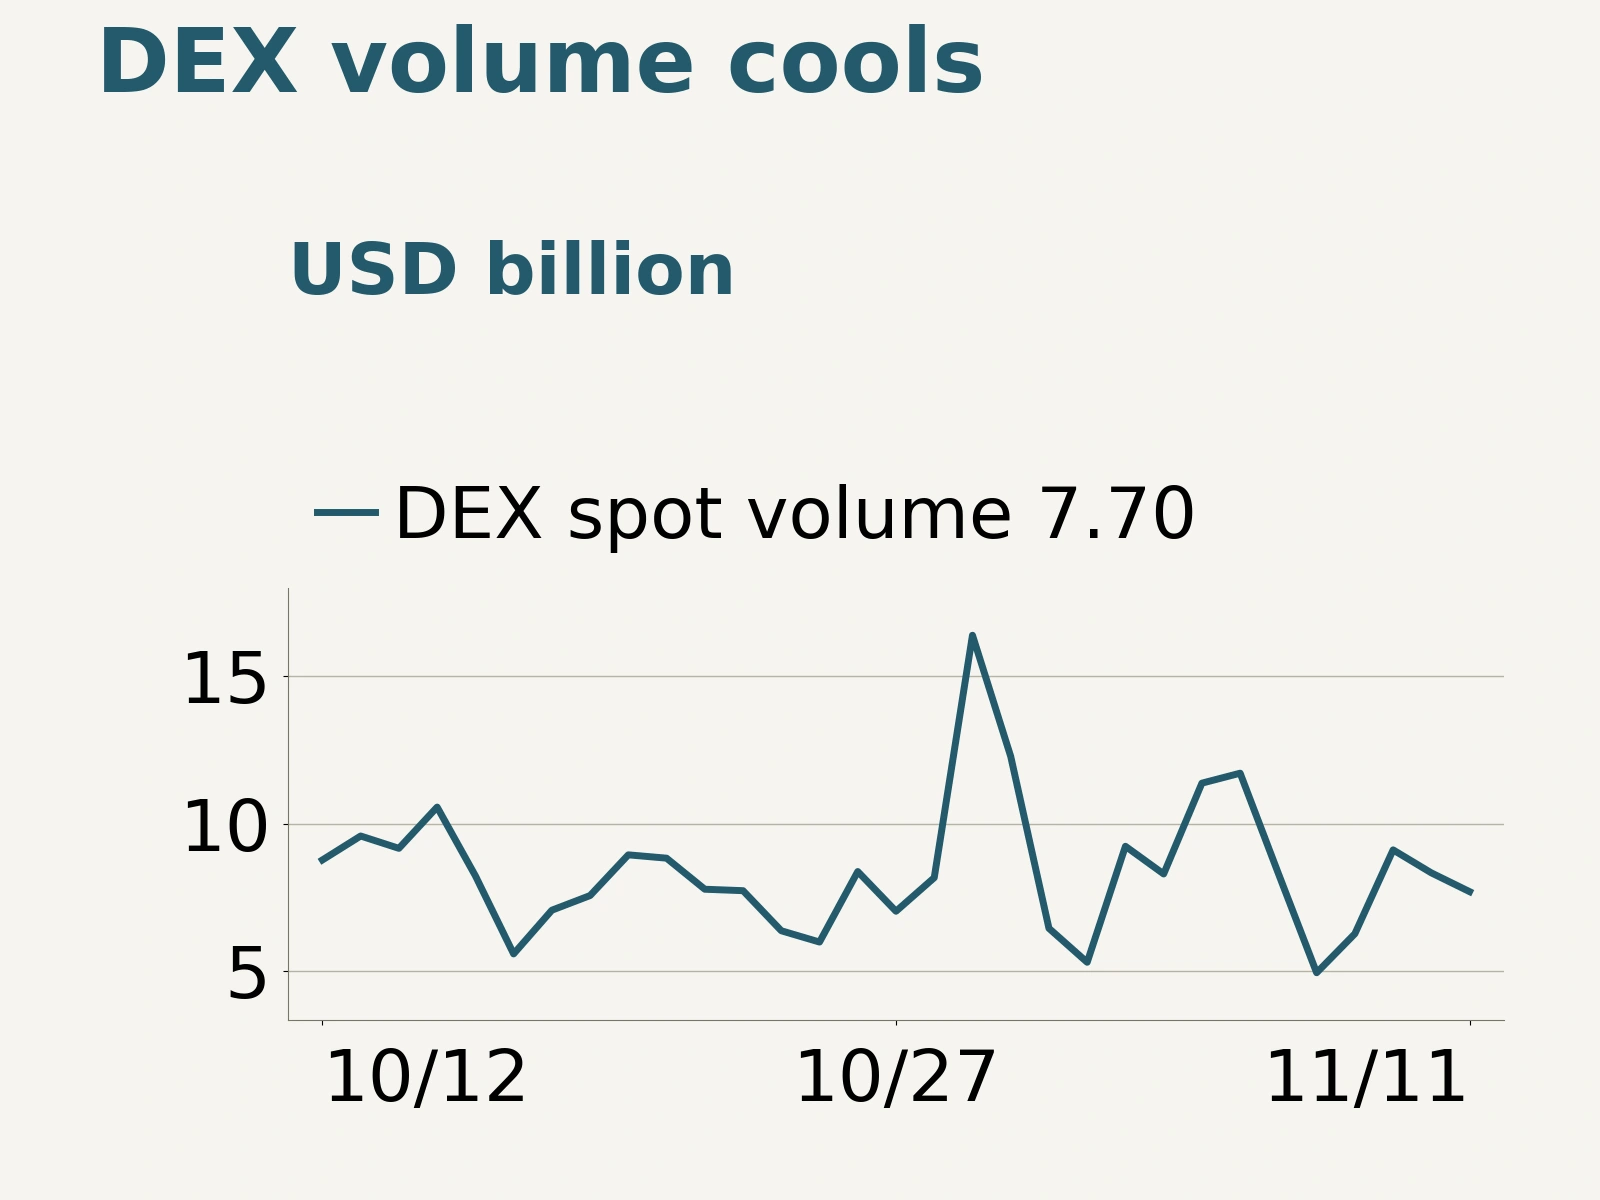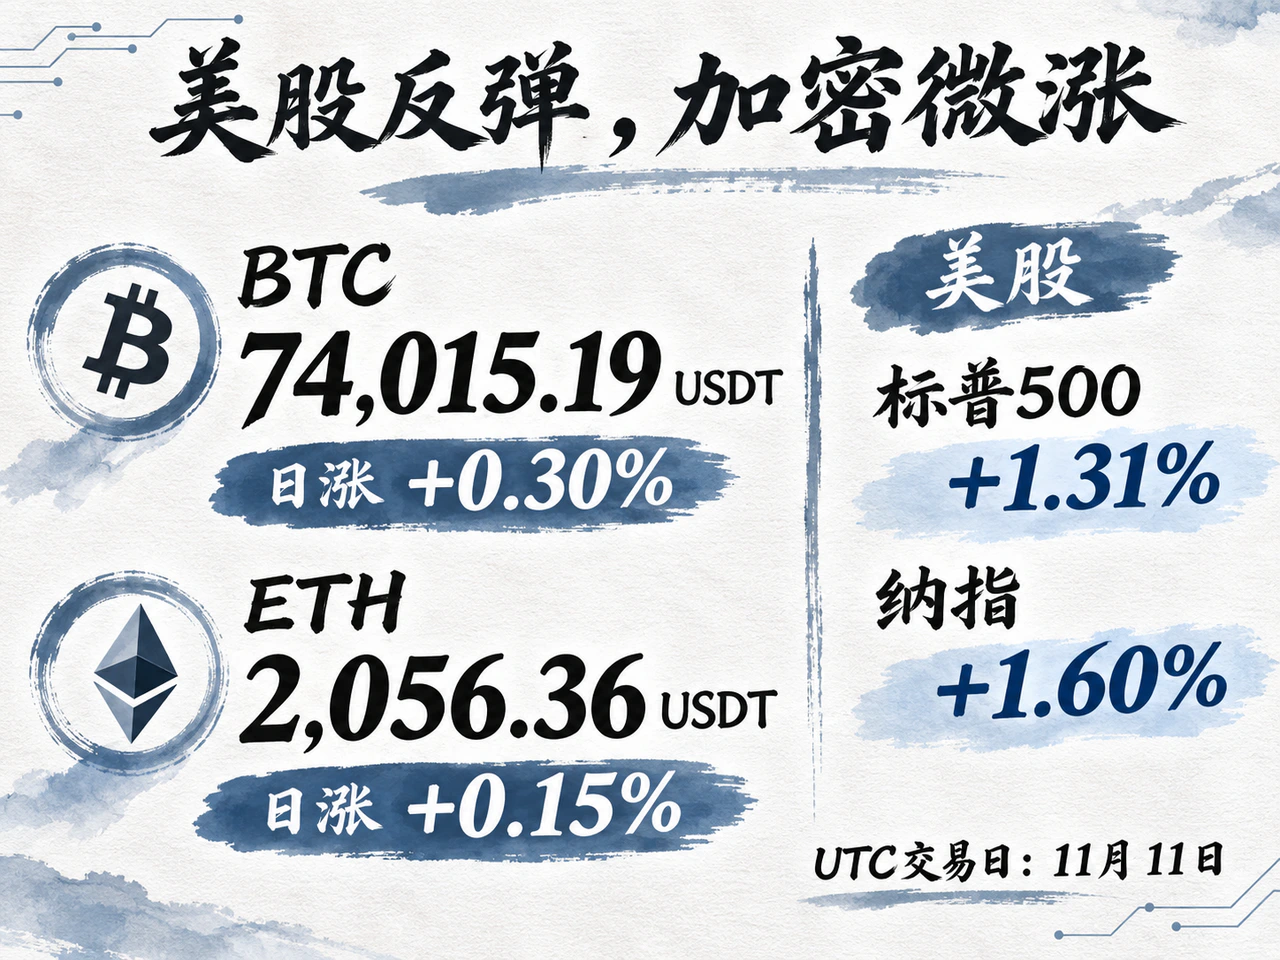
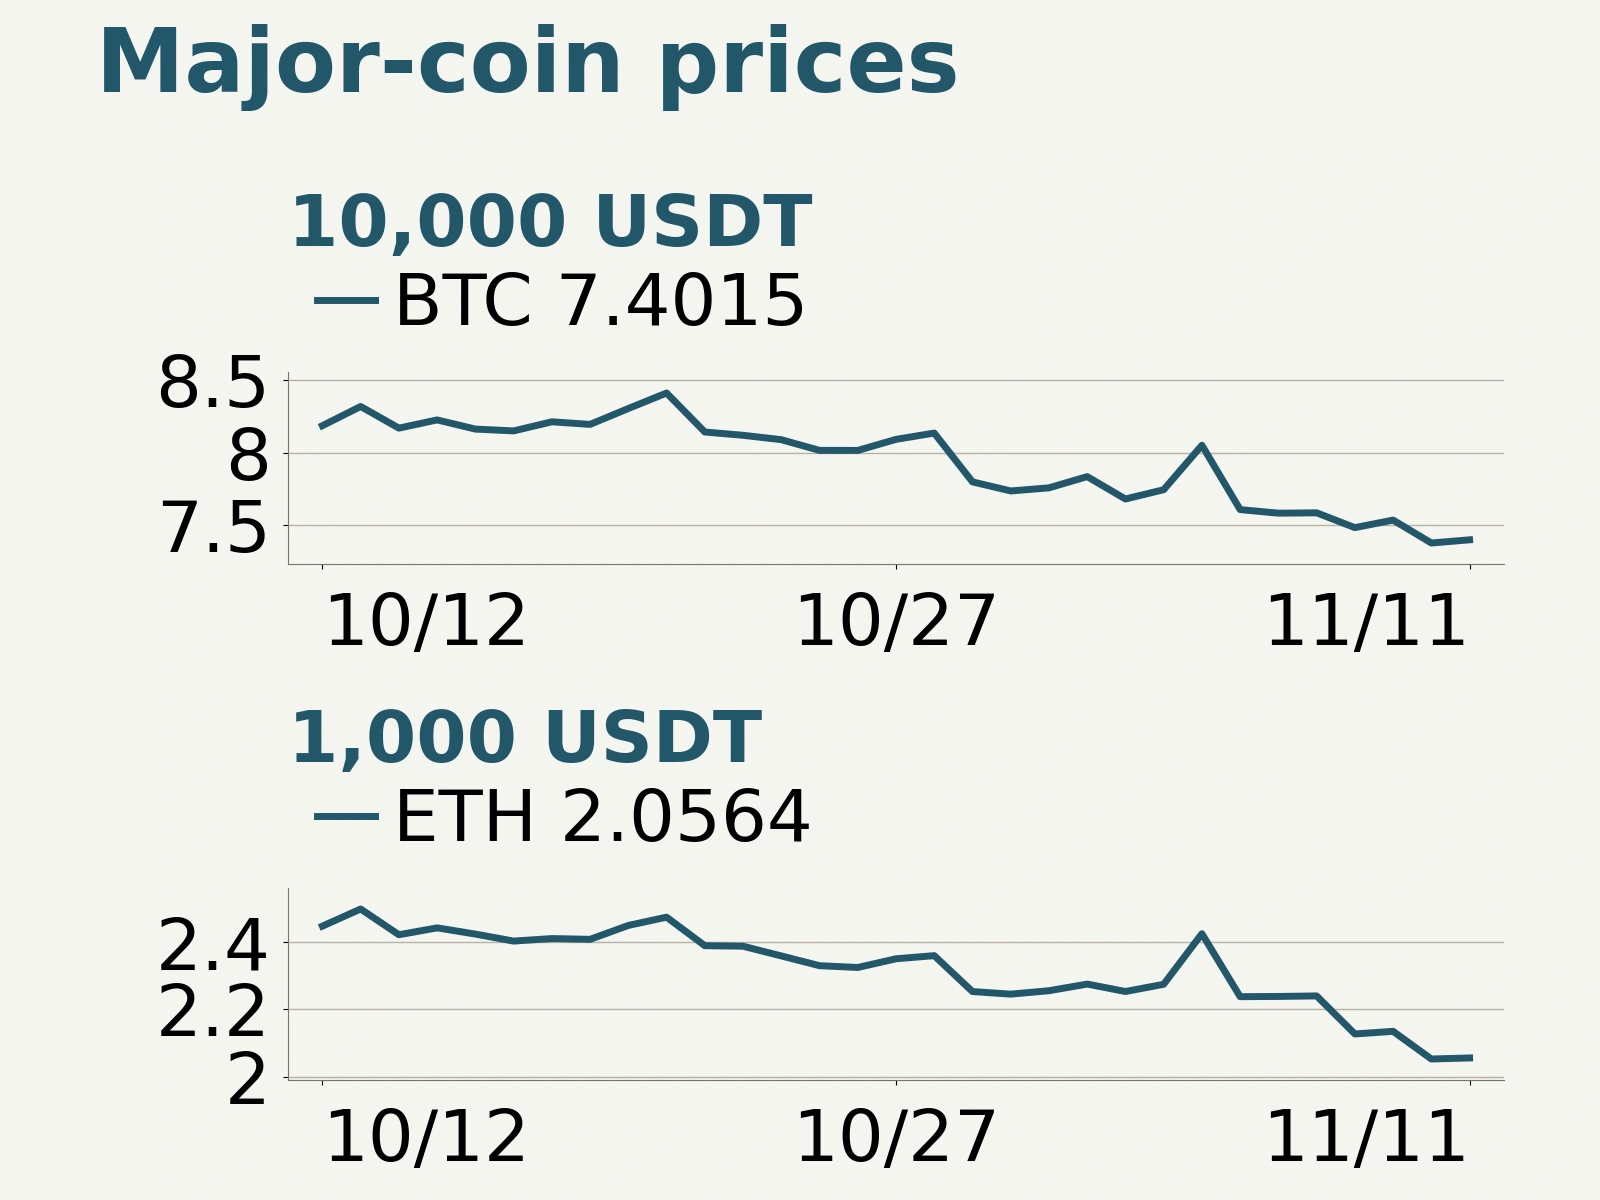
On November 11, 2026, Bitcoin edged higher after the shock from the previous day’s US inflation data, but significantly lagged US equities. On Binance’s USDT-denominated spot UTC daily candles, which closed at 8 a.m. Beijing time on November 12, BTC finished at 74,015.19 USDT, up 0.30%, and ETH at 2,056.36 USDT, up 0.15%. The S&P 500 rose 1.31% that day, while the Nasdaq Composite gained 1.60%.
Prices have stopped falling for now, but demand has not improved alongside them. AI company earnings and profit expectations supported the equity rebound; crypto assets still face capital withdrawals, expectations of tight interest rates, and changing financing conditions for listed companies that hold crypto.
ETH turnover falls 42.04%; only 4 of 10 sampled coins rise
BTC traded as low as 73,209.12 USDT and as high as 74,811.45 USDT, before closing near 74,000 USDT. ETH briefly reached 2,103.78 USDT but still closed near 2,050 USDT. Both recovered from their lows, although buying at higher prices showed limited staying power.
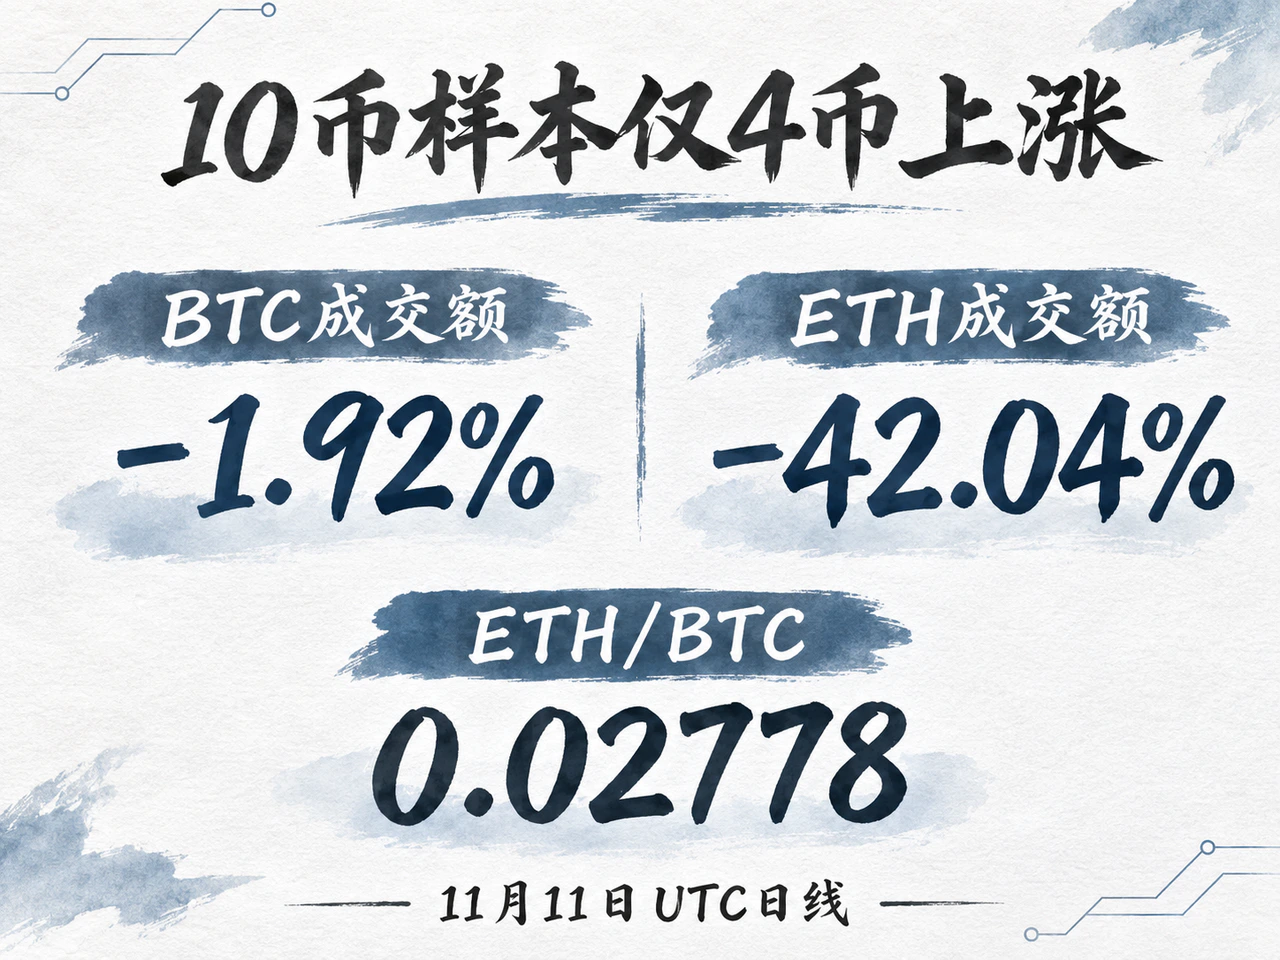
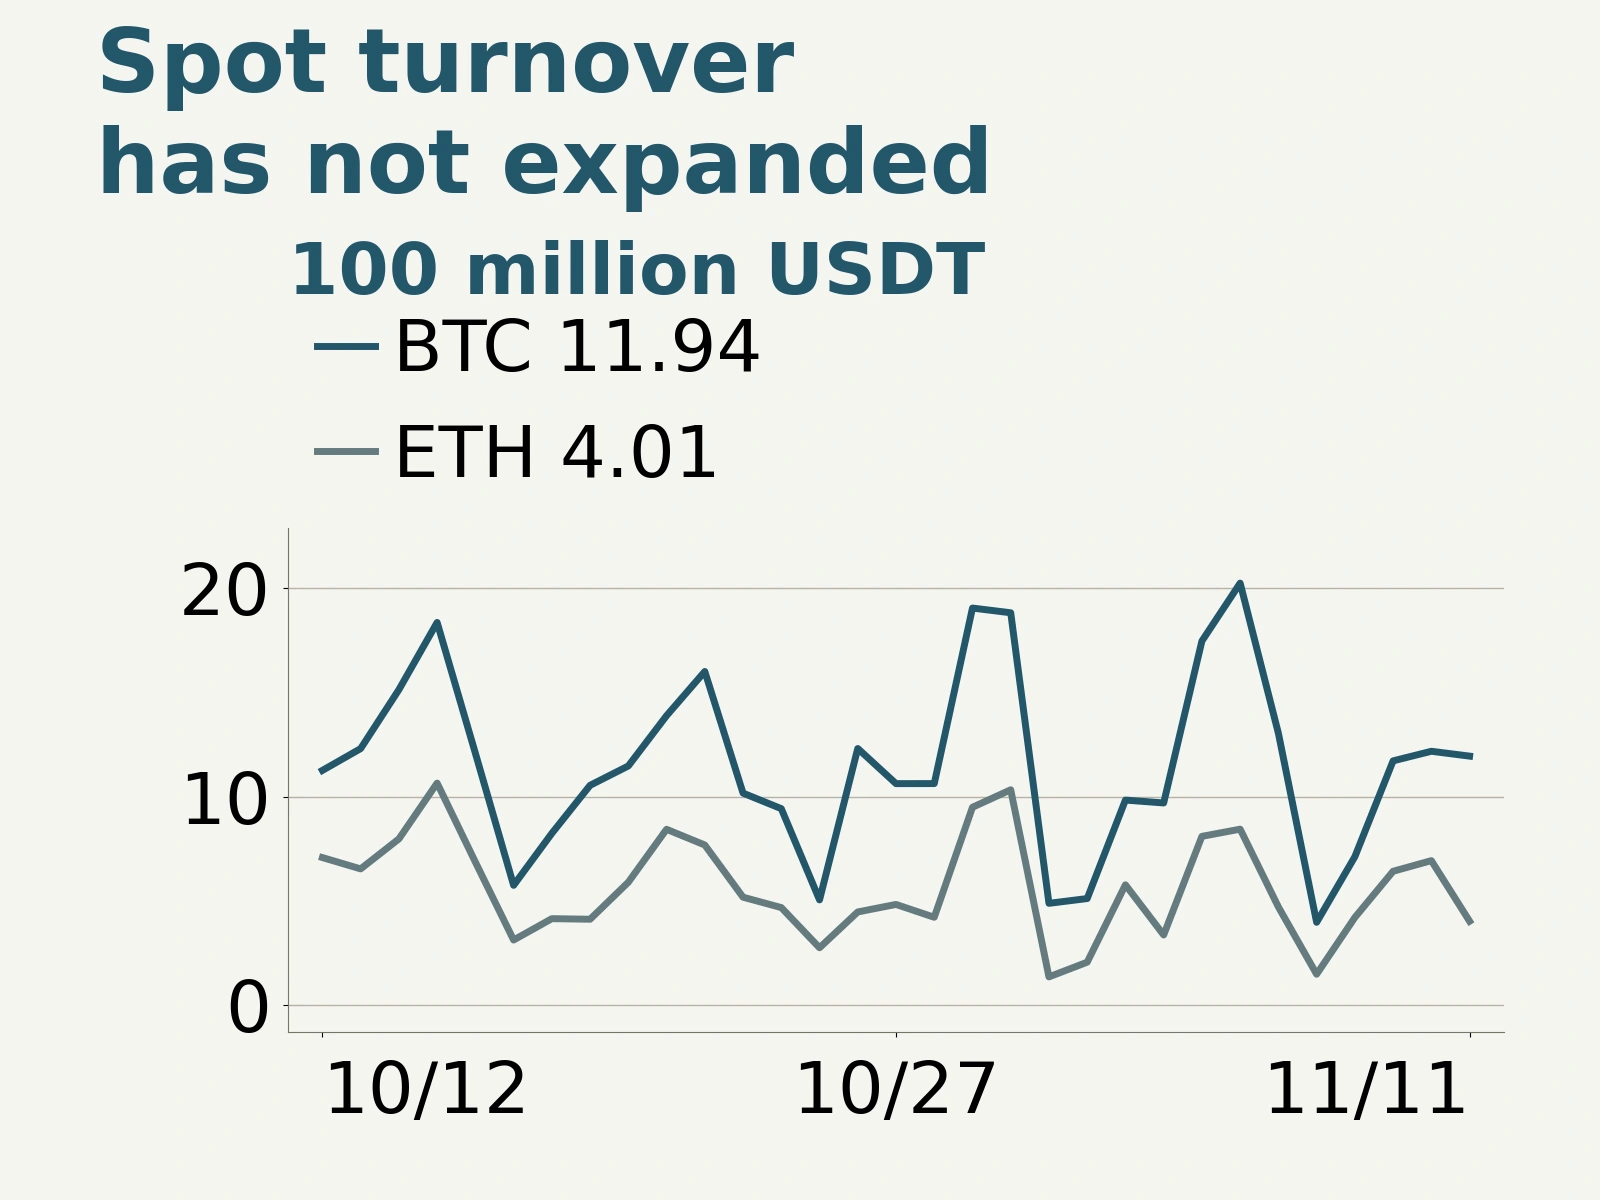
Turnover provides another measure of the rebound’s strength. Daily Binance BTC/USDT turnover was 1.194 billion USDT, down 1.92% from the previous day; ETH/USDT turnover was 401 million USDT, down 42.04%. ETH’s modest price gain coincided with a sharp contraction in turnover: active trading demand has yet to recover with prices.
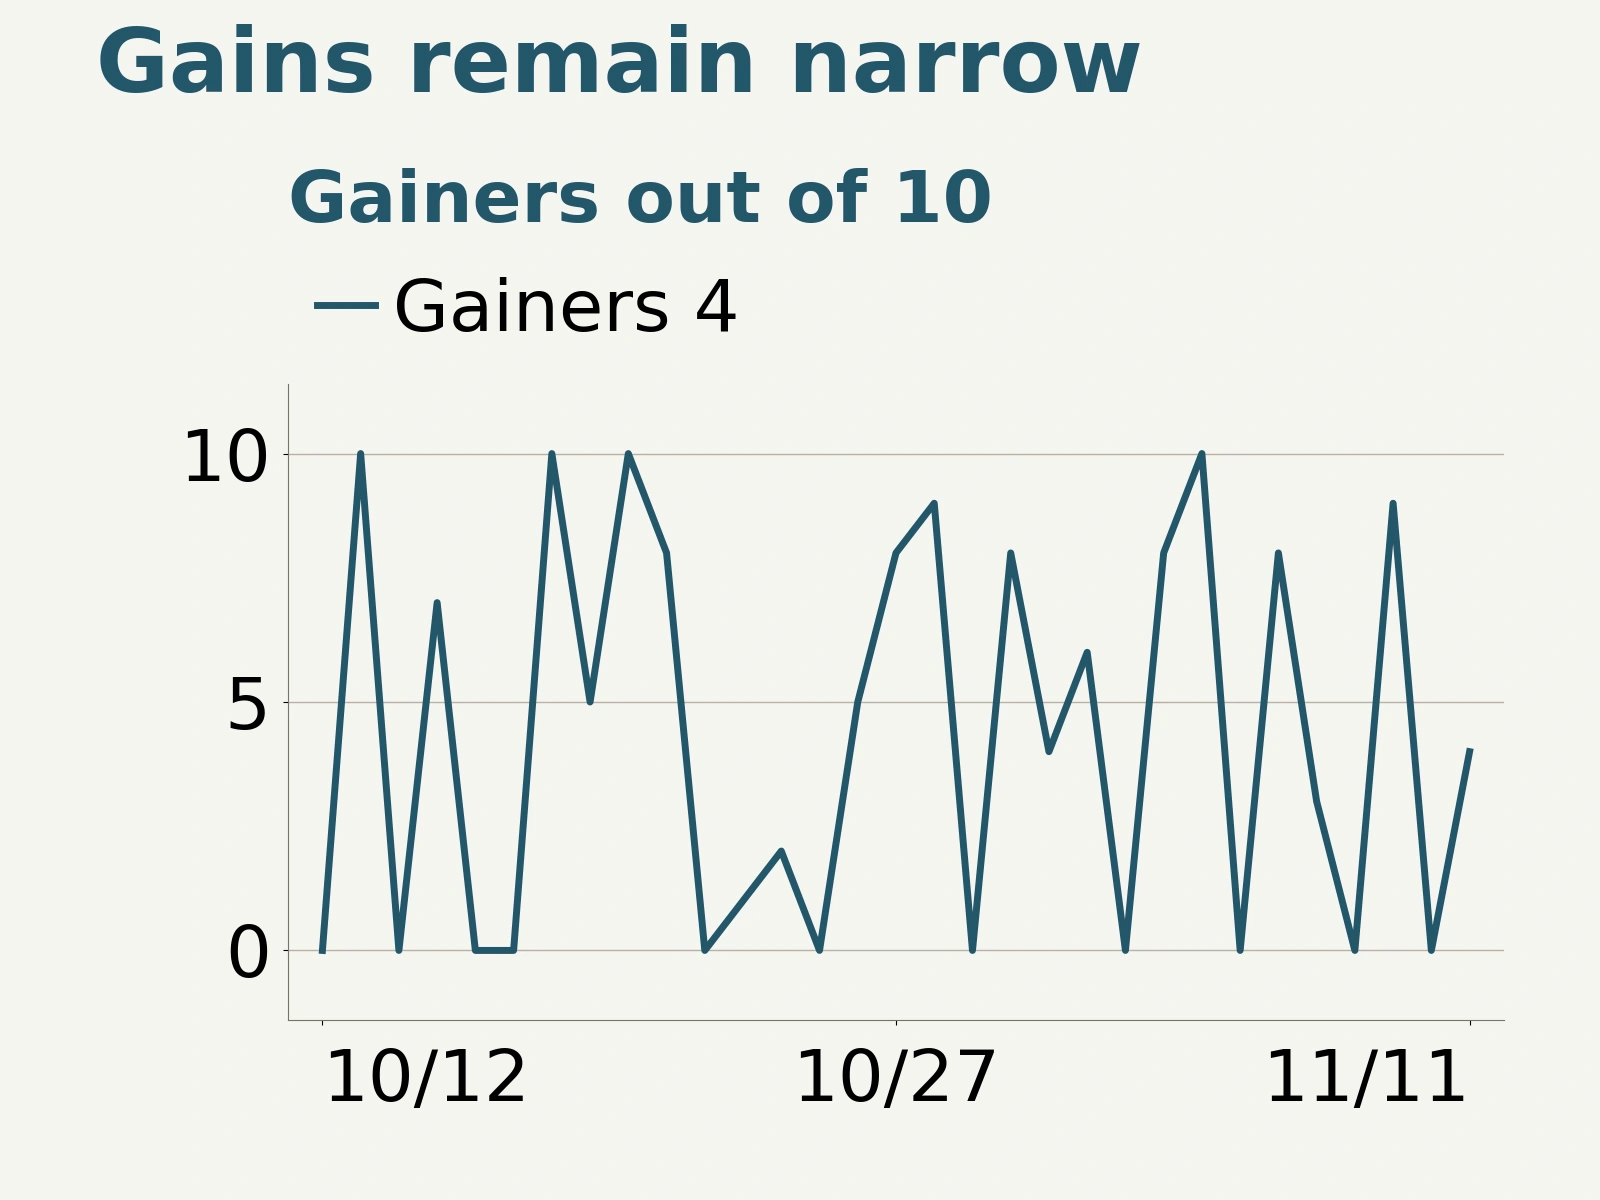
Only 4 coins rose in the fixed spot sample comprising BTC, ETH, BNB, XRP, SOL, DOGE, ADA, LINK, AVAX and SUI. AVAX gained 1.65% and ADA 0.40%, while LINK fell 1.03%, DOGE lost 0.78%, and SOL also closed slightly lower. The rebound has not spread broadly across major coins.
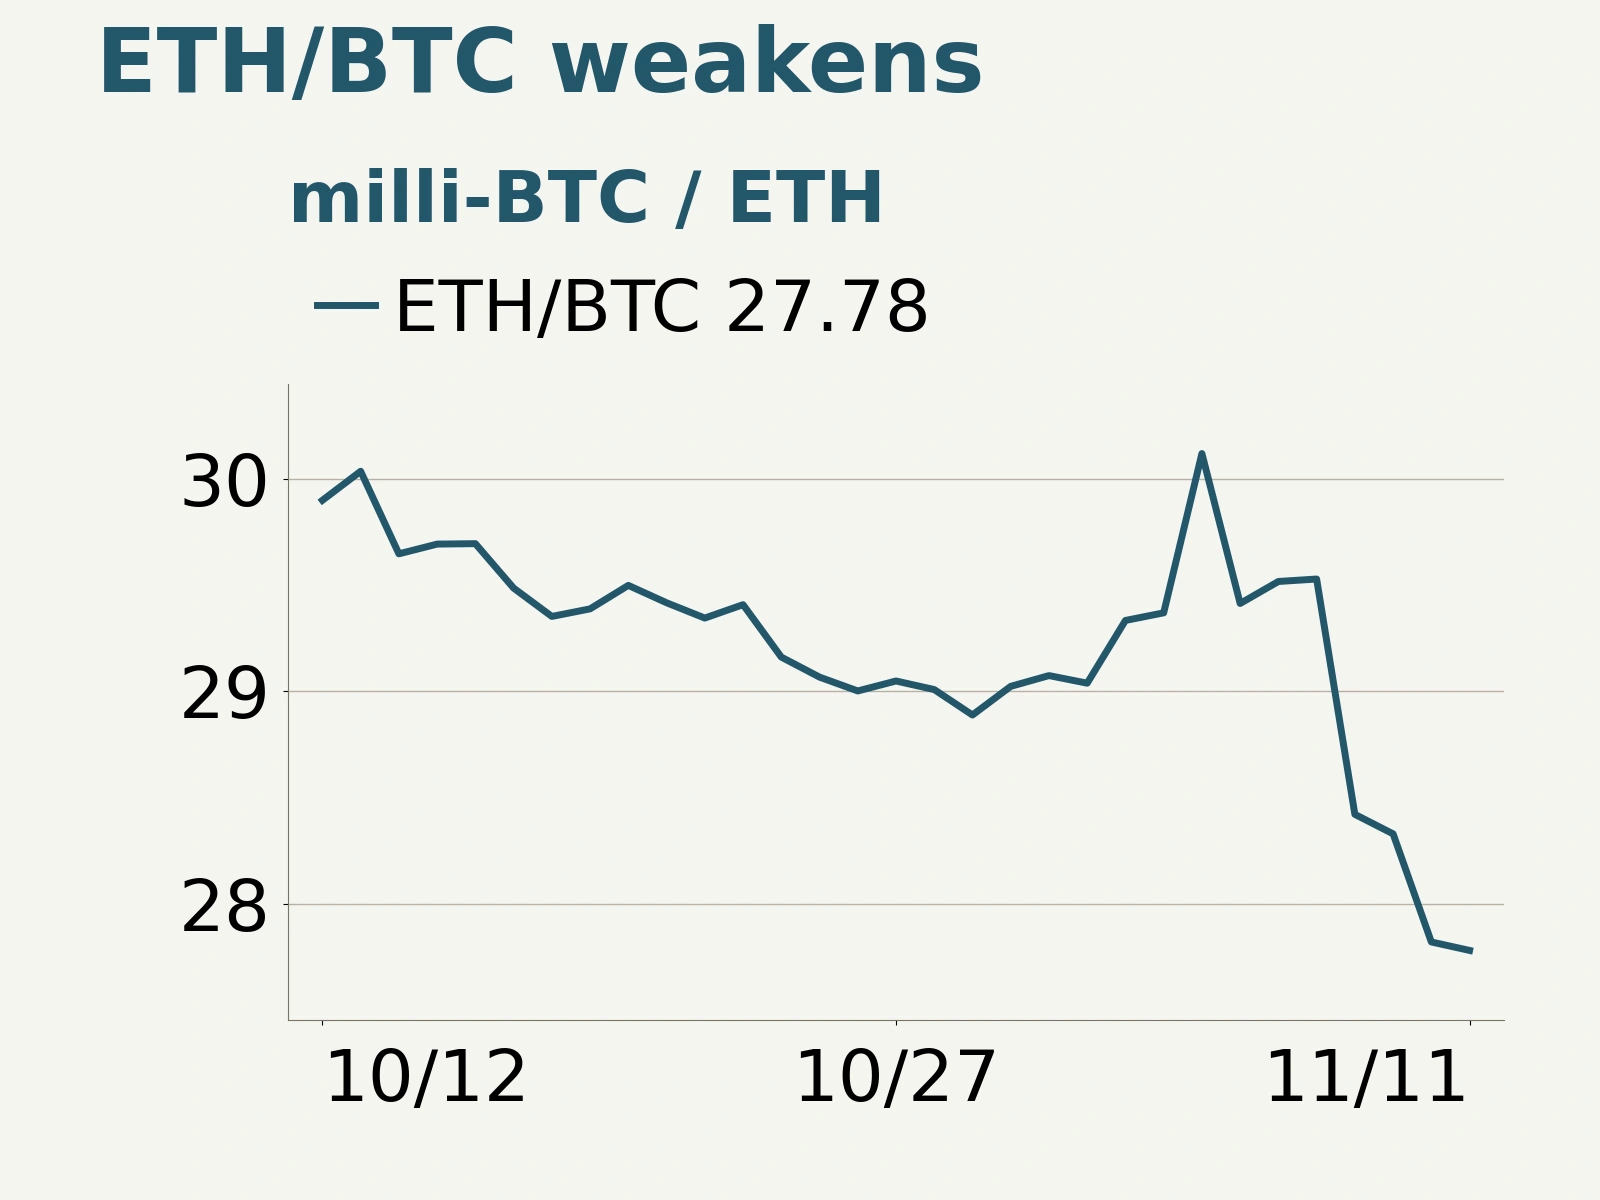
Over the past 7 complete UTC trading days, BTC fell a cumulative 8.06% and ETH 15.19%. The ETH/BTC closing ratio declined to 0.02778, another 0.14% below the previous day. Nexo’s market commentary published on November 11 also noted that Bitcoin’s share of total crypto market capitalization was approaching 61%. These changes suggest that capital still favors larger assets and that the market has yet to increase risk exposure broadly.
The equity recovery had a more direct earnings catalyst. Reuters reported that CoreWeave’s results and management’s comments on future profitability eased concerns about returns on AI investment. Its shares rose 24.7%, lifting other AI infrastructure stocks. This company-level improvement bolstered risk appetite, but has yet to produce a corresponding expansion in crypto turnover or market breadth.
Interest-rate pressure has not eased either. October CPI, released by the US Bureau of Labor Statistics on November 10, rose 0.4% month on month, while core CPI rose 0.3%. Reuters’ November 11 market-close report said traders had fully priced in at least a 25-basis-point rate increase in December. Upward earnings revisions can partly offset discount-rate pressure for equities; crypto assets lack similar support. Their price recovery depends more heavily on fresh capital, while tight interest rates add to holding costs.
Crypto treasury companies face index rebalancing; Bitcoin perpetual open interest rises 12% in 30 days
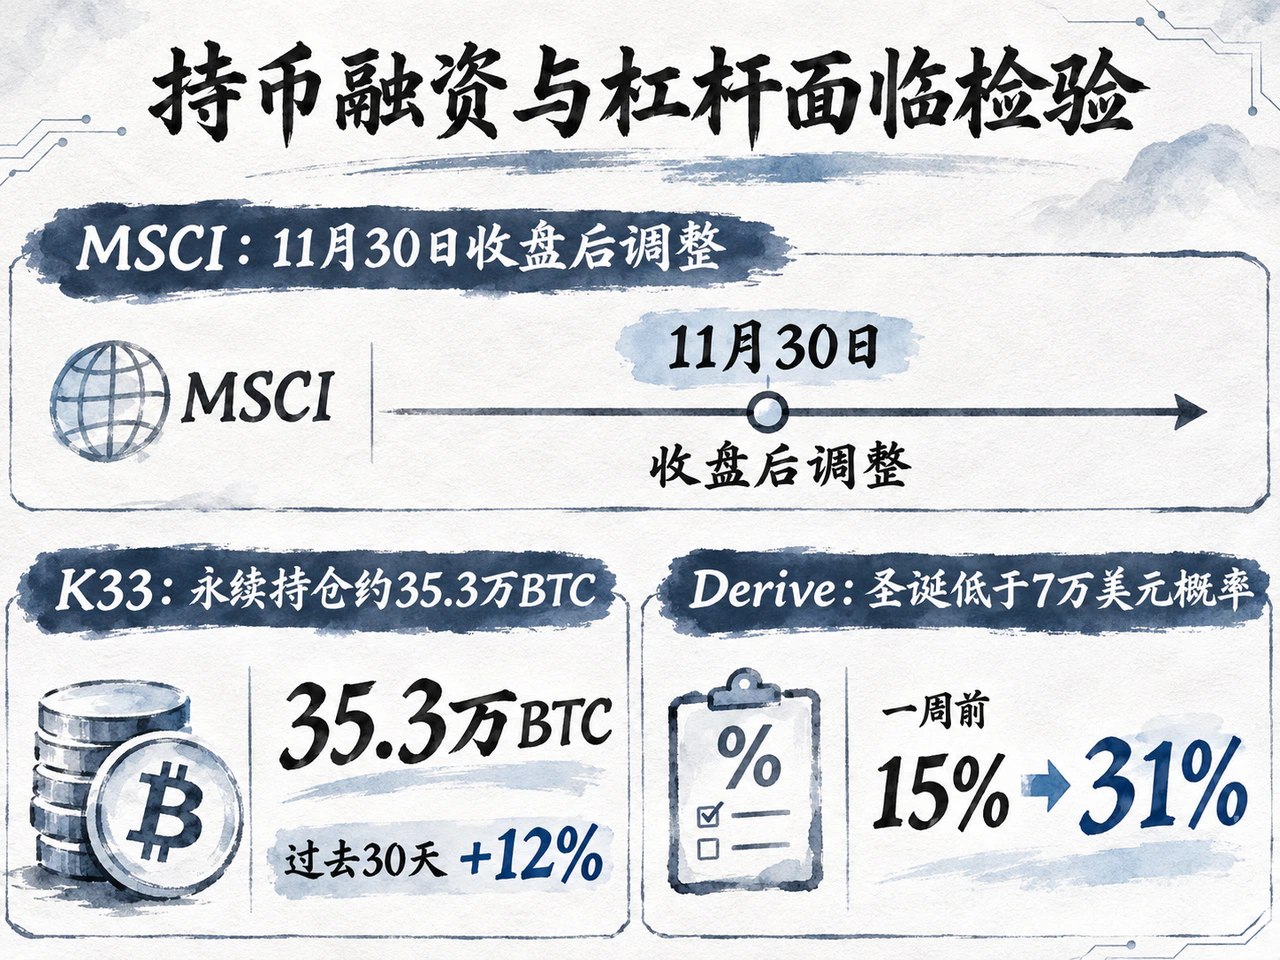
Late on November 11, a new development affected the passive-capital channel for listed crypto treasury companies. MSCI’s November review listed Strategy for deletion from its US indexes; The Block also reported that Metaplanet would be removed from the Japan Small Cap Index. The changes are scheduled to take effect after the close on November 30. The documents did not state the specific reason for either company’s removal.
This development first affects shareholders and corporate financing conditions. Products tracking the relevant indexes need to adjust their holdings. If pressure on treasury-company share prices reduces the appeal of new equity issuance, their capacity to keep buying crypto through capital-market financing could also be constrained. Because the news arrived late in the trading day, its main implications concern subsequent rebalancing and financing arrangements. Actual flows and any changes to the companies’ crypto purchase plans will bear watching.
Meanwhile, participation in derivatives continued to rise. Citing K33 research, The Block reported Bitcoin perpetual futures open interest of approximately 353,000 BTC, up 12% over the past 30 days, while Bitcoin’s price fell about 10% over the same period. With positions accumulating as prices weaken, position closures and stop-loss orders could amplify volatility once a clearer direction emerges.
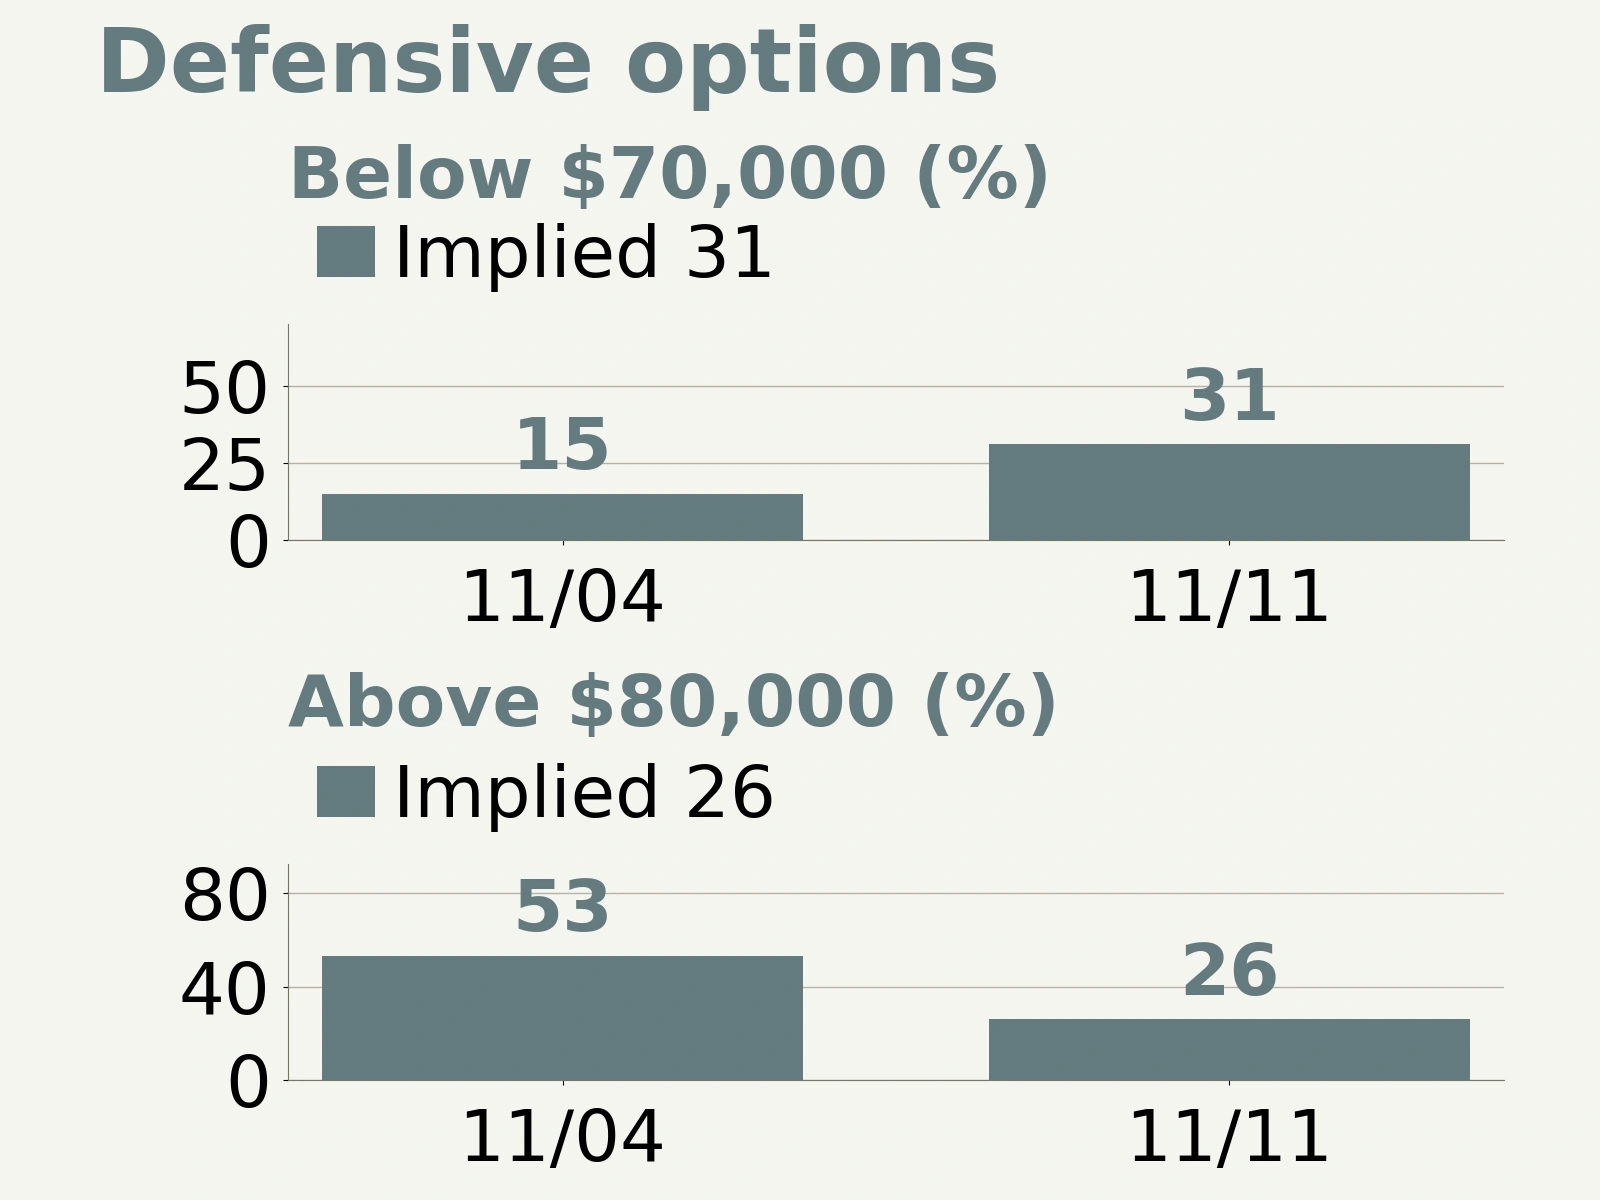
Options traders are also increasing protection. Pricing supplied by Derive to The Block showed the implied probability of Bitcoin finishing below $70,000 at Christmas rising from 15% a week earlier to 31%. The probability of finishing above $80,000 fell from 53% to 26%. This pricing reflects demand for downside protection; the day’s modest rebound has not changed the defensive bias.
Spot turnover, corporate financing and leveraged positions all point to the same question: can potential buyers become sustained buying demand? Improving ETF flows, higher spot turnover and gains spreading to more major coins would give a stabilization a better chance of becoming a lasting recovery. US equities have already found an earnings catalyst; crypto is still waiting for a capital-flow catalyst. Rising leveraged positions could amplify subsequent moves in either direction.
Click the original article link for full details.