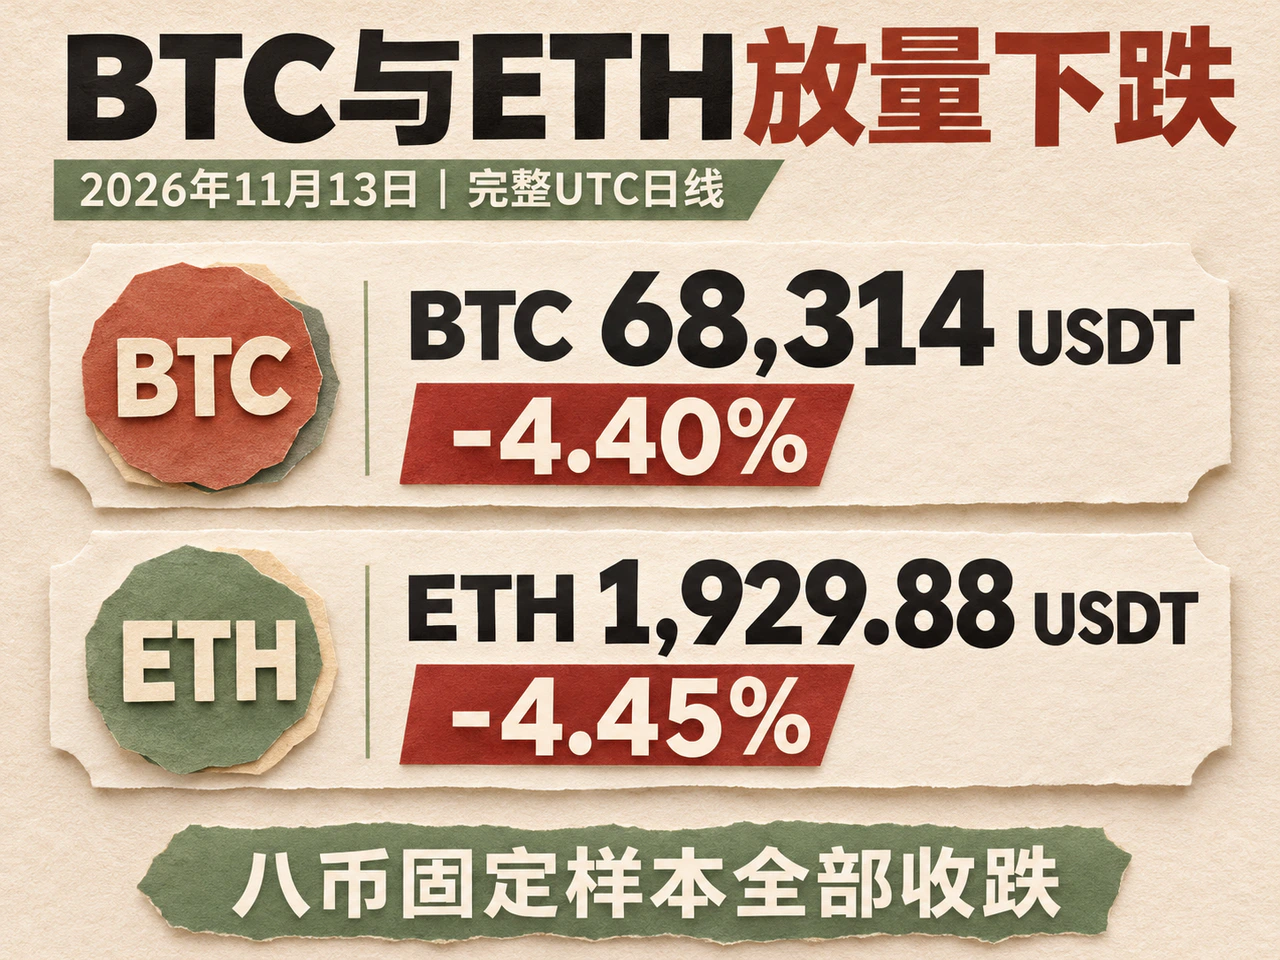
On November 13, 2026, Bitcoin closed at 68,314 USDT, down 4.40% from the previous day, after breaking below 70,000 USDT intraday. Ethereum closed at 1,929.88 USDT, down 4.45%, losing the 2,000 USDT level. These prices use Binance spot USDT quotes and UTC daily candles; the corresponding daily session had fully closed by 8 a.m. Beijing time on November 14. Major highly liquid cryptocurrencies all finished lower. Rising turnover, breaches of round-number levels and long liquidations reinforced one another, turning the price retreat into a test of the spot market’s ability to absorb selling.
Bitcoin traded as high as 71,514.01 USDT and as low as 67,568 USDT that day. Its close was roughly 1.10% above the low, but remained well below the previous day’s closing level of 71,460 USDT. Ethereum touched an intraday low of 1,895.95 USDT before closing back above 1,900 USDT. Both core assets attracted buying at lower levels, yet their full-day declines were similar, pointing to a common shock.
Bitcoin Turnover Rises 85.91% as All Eight Coins Fall, with Varying Resilience
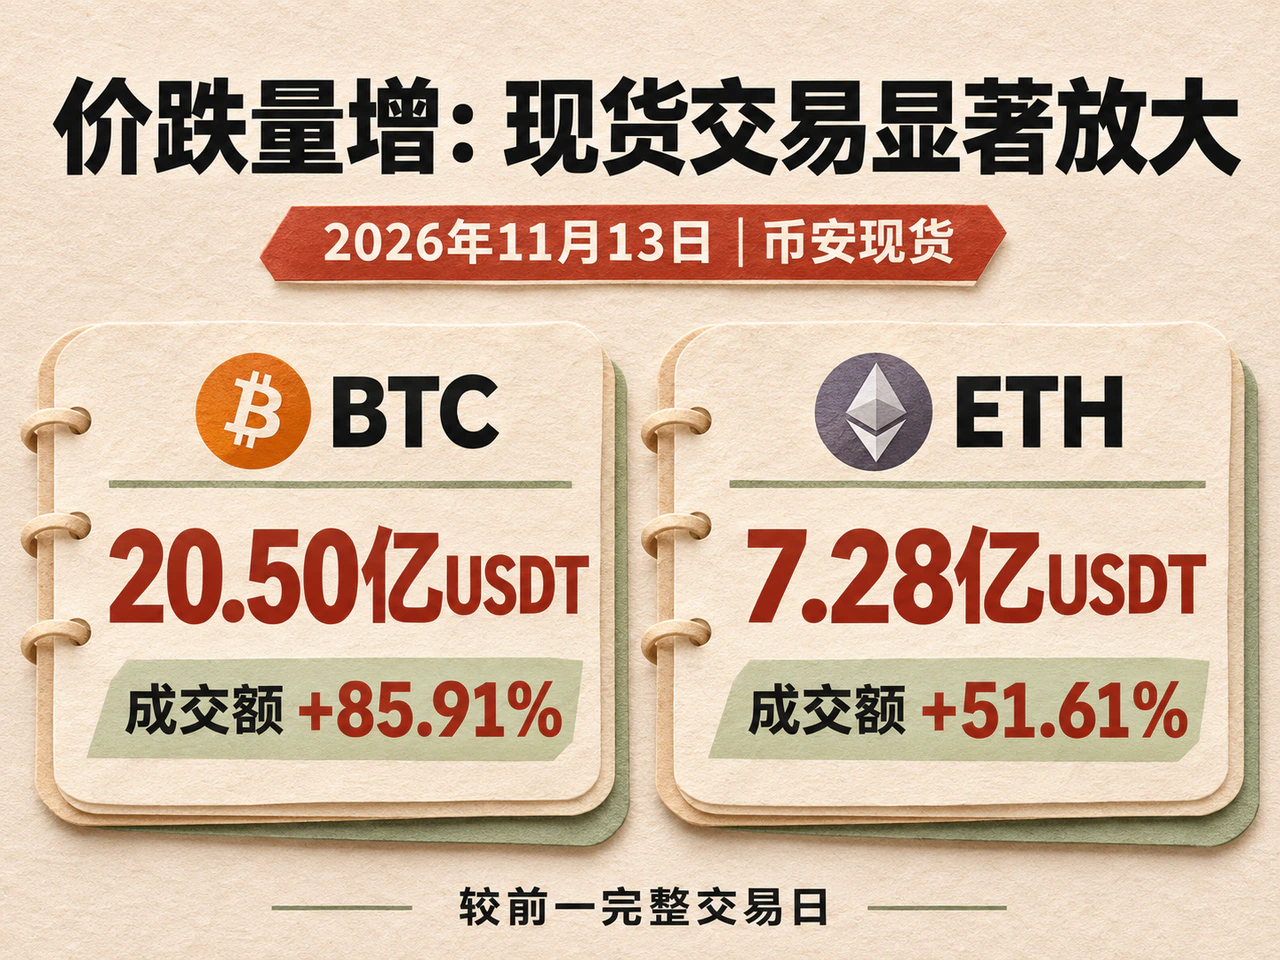
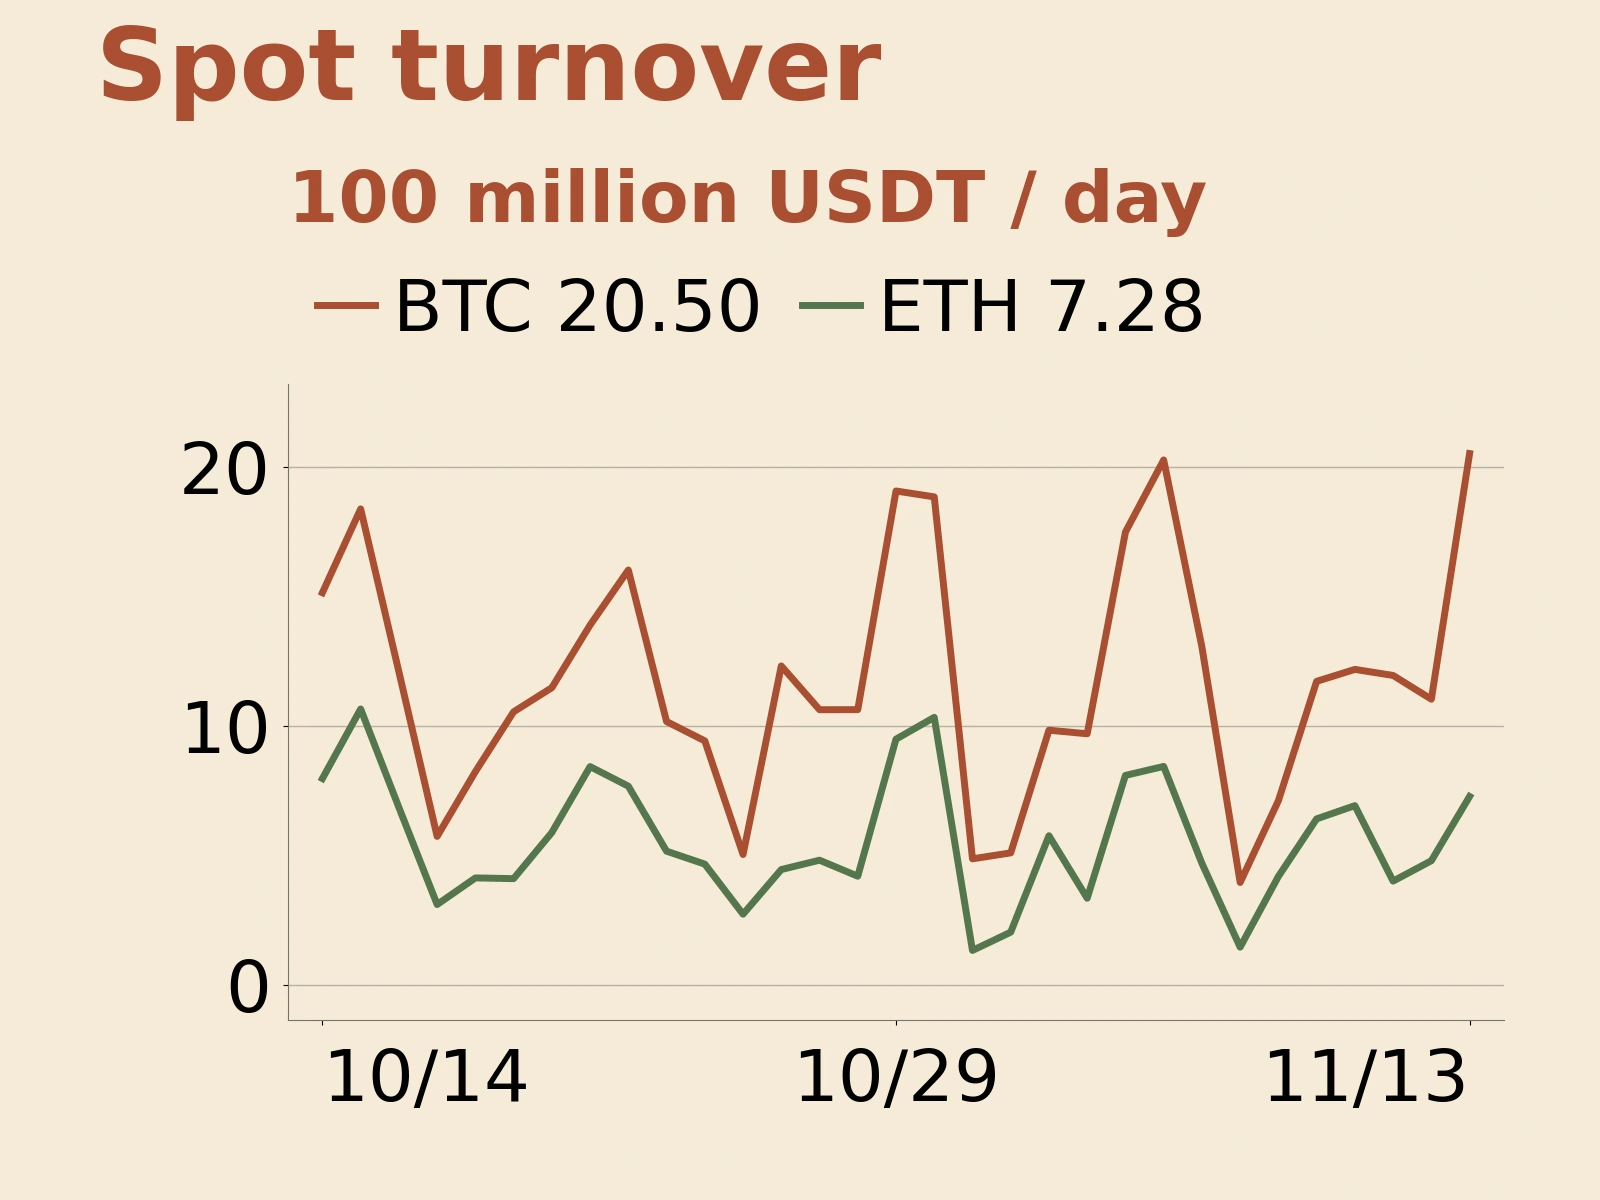
Bitcoin’s Binance spot turnover reached 2.050 billion USDT that day, up 85.91% from the previous day and roughly 1.78 times the average for the preceding 30 completed trading days. It ranked sixth over the past 91 days. Ethereum turnover was 728 million USDT, up 51.61%. Falling prices alongside rising turnover indicate that selling pressure was released in a burst of active trading; buying at lower levels had yet to produce a meaningful recovery by the close.
The fixed eight-coin sample comprises BTC, ETH, BNB, SOL, XRP, DOGE, ADA and TRX, excluding stablecoins and wrapped tokens that would duplicate exposure. All eight closed lower that day: BNB finished at 630.31 USDT, down 4.06%; SOL at 78.19 USDT, down 4.32%; and XRP at 1.011 USDT, down 2.91%. DOGE and ADA fell 2.96% and 3.33%, respectively, while TRX declined 1.14%. This sample tracks market breadth across major spot cryptocurrencies. Losses across all eight show that selling pressure extended beyond individual projects, while the differences in their declines reflect varying degrees of impact.
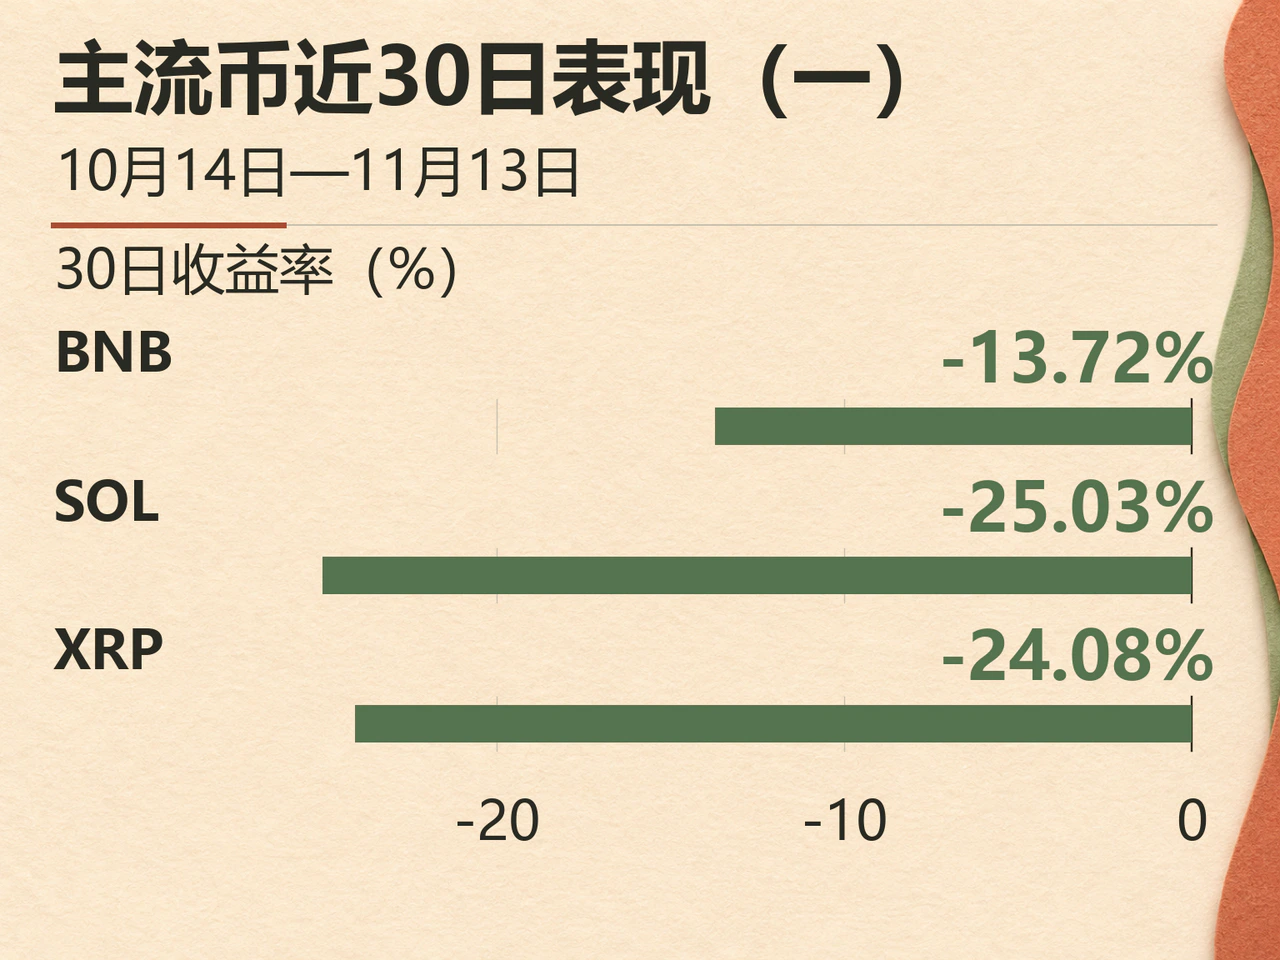
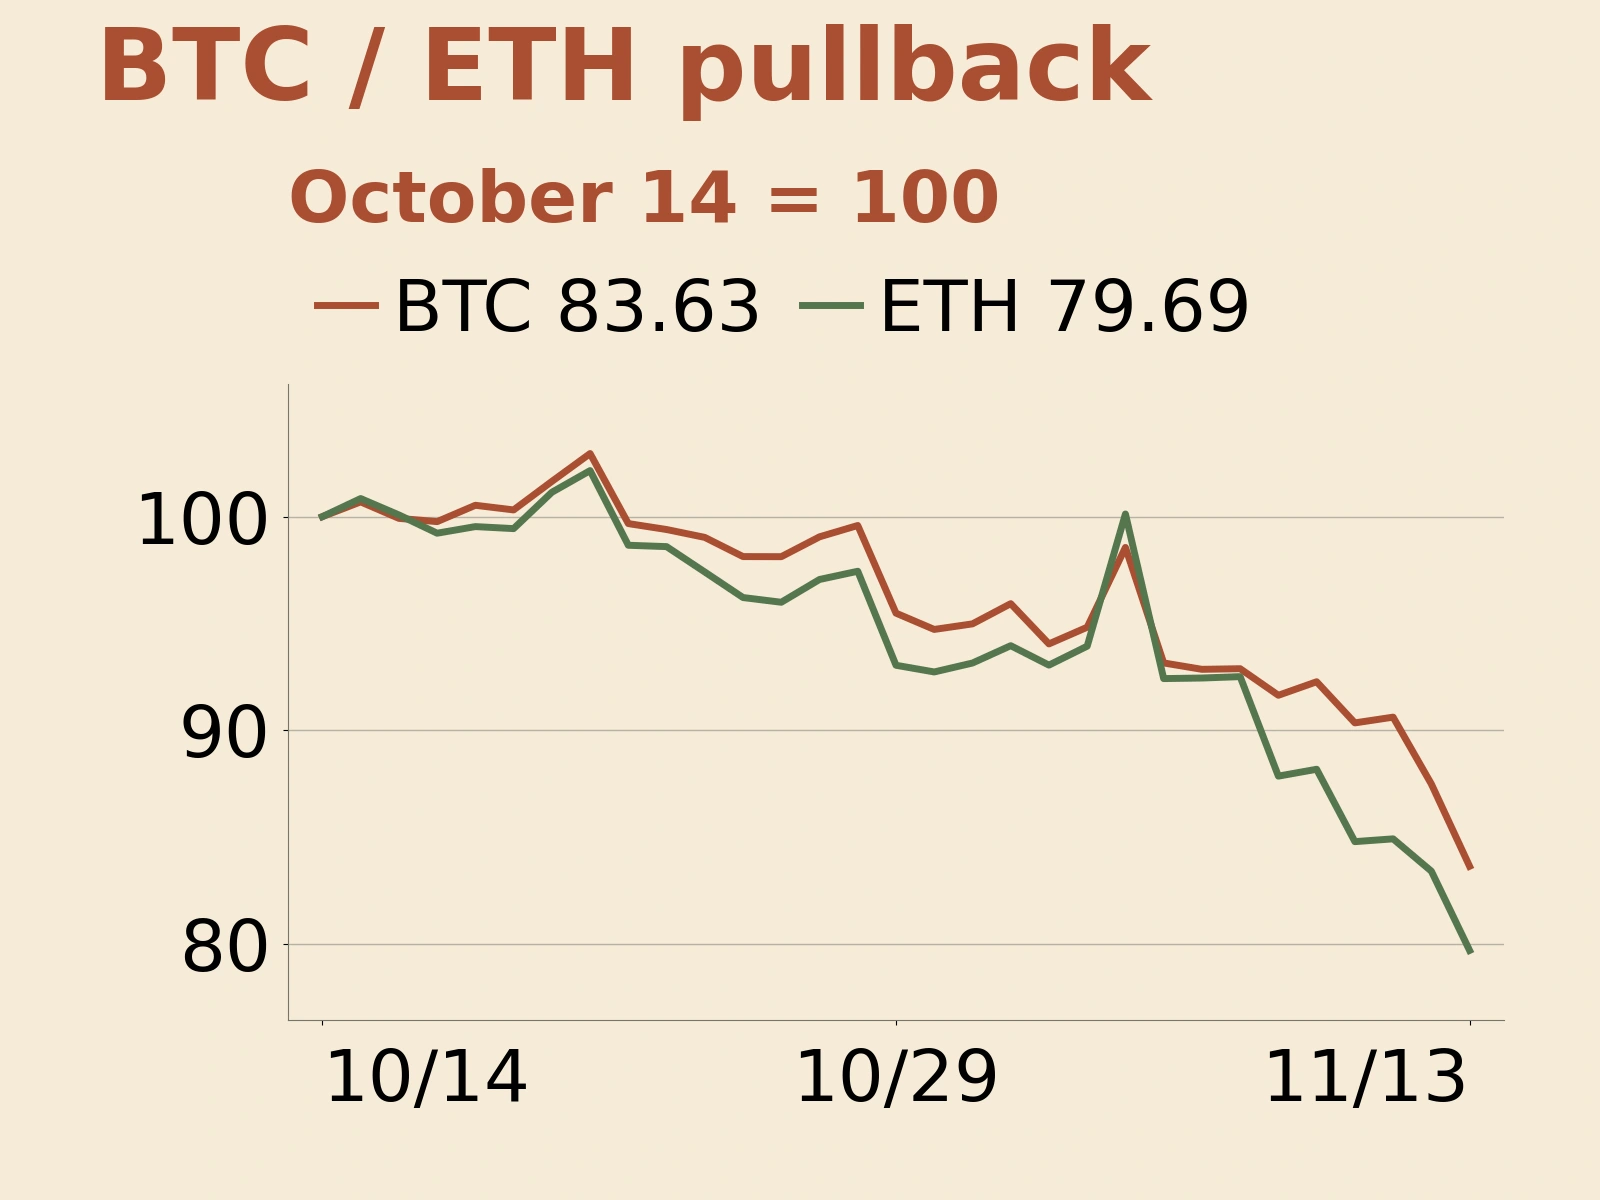
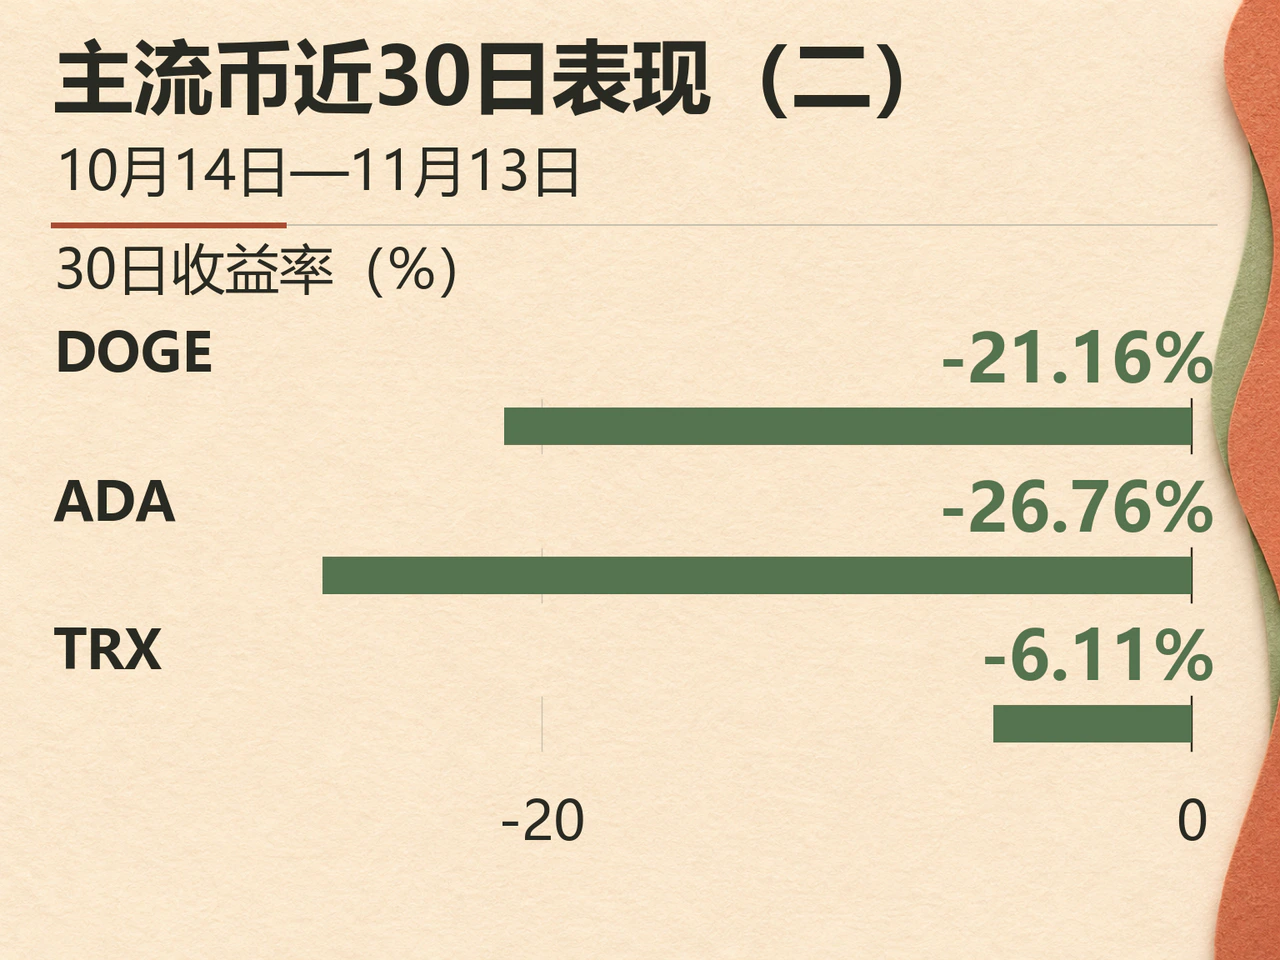
XRP and TRX both held up better than Bitcoin that day, but their medium-term performance differed. Over 30 days, Bitcoin fell 16.37%, Ethereum 20.31%, SOL 25.03%, XRP 24.08%, ADA 26.76% and TRX 6.11%. Despite its smaller one-day decline, XRP still significantly underperformed Bitcoin over the past 30 days; TRX was relatively resilient in both observation windows. Medium-term cumulative performance needs to be considered alongside daily relative strength to assess whether capital is truly rotating toward a particular asset.
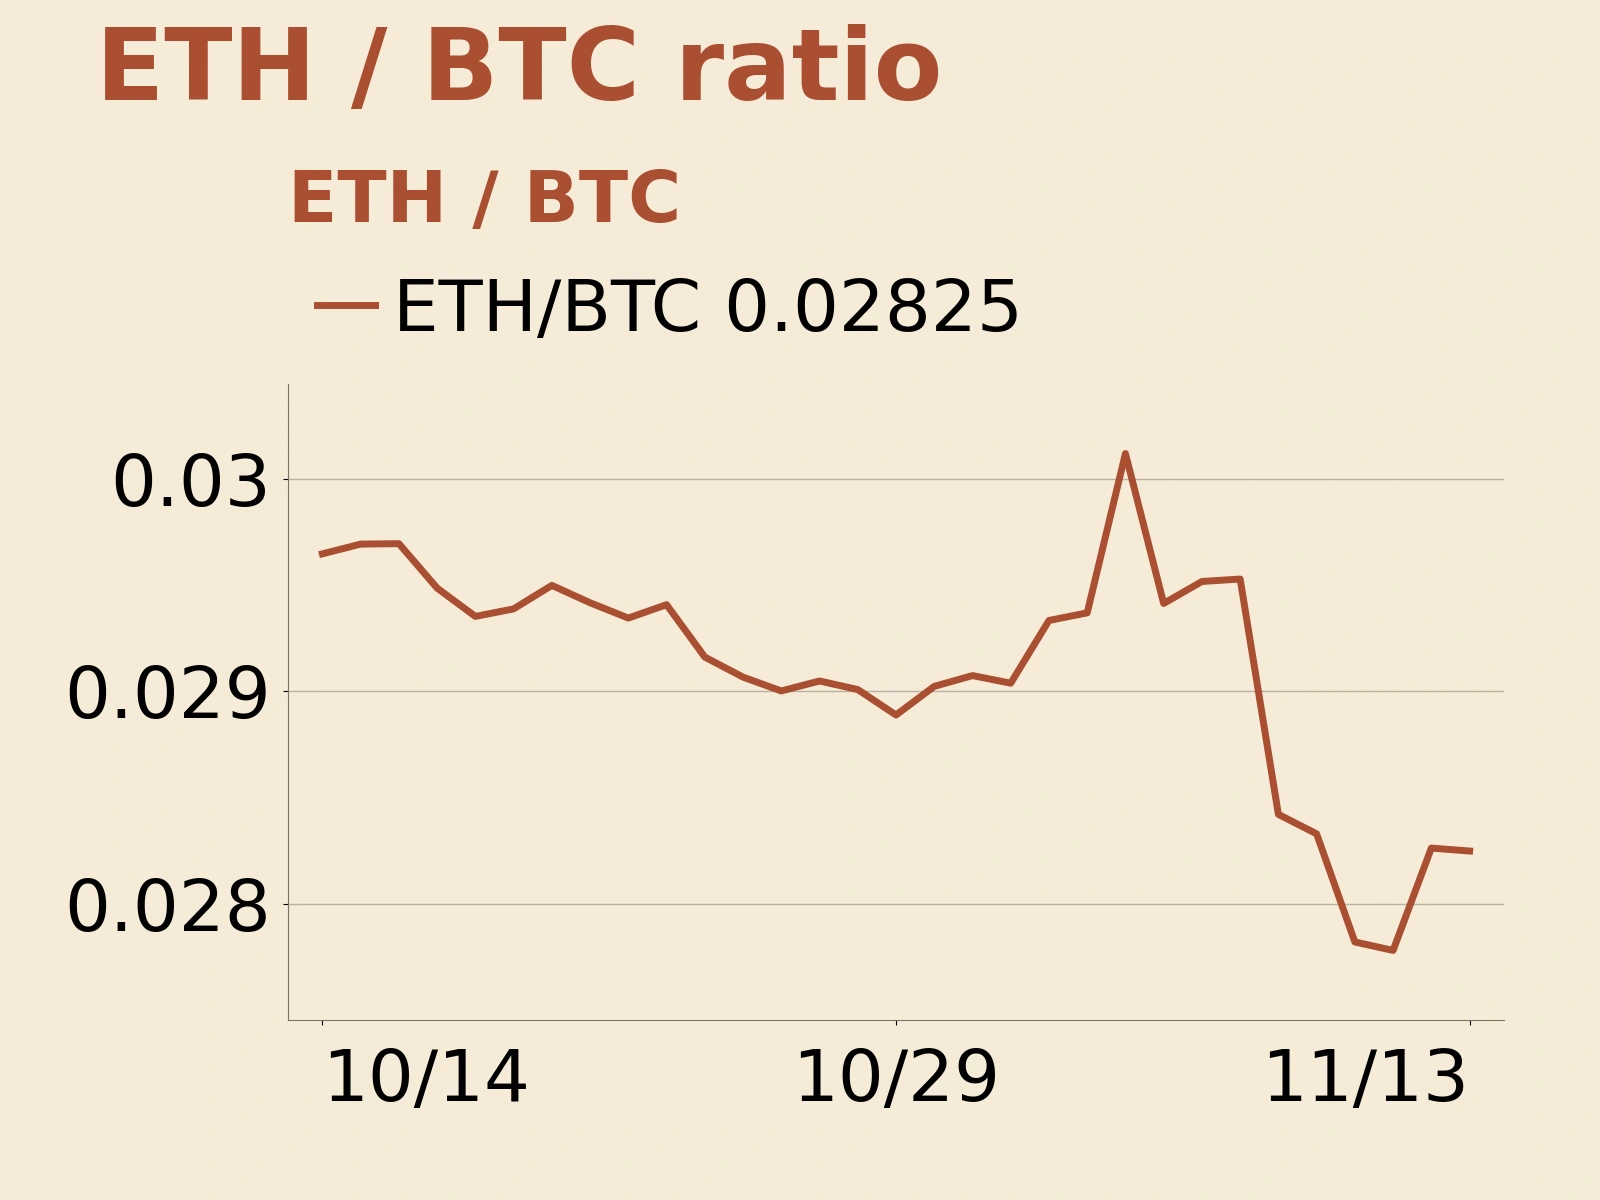
The closing ETH/BTC ratio was 0.02825, down only about 0.05% on the day but 4.71% over the past 30 days. Ethereum came under pressure alongside Bitcoin that day, while its medium-term relative weakness persisted. A renewed willingness to take on greater on-chain and application-related risk would typically require Ethereum and other major coins to improve their relative performance over several consecutive trading days. With all eight coins falling and no meaningful rise in ETH/BTC this period, a broad reduction in risk exposure remained the dominant market pattern.
A Stronger Dollar and Rate-Hike Expectations Weigh on Prices as Long Liquidations Amplify the Breakdown
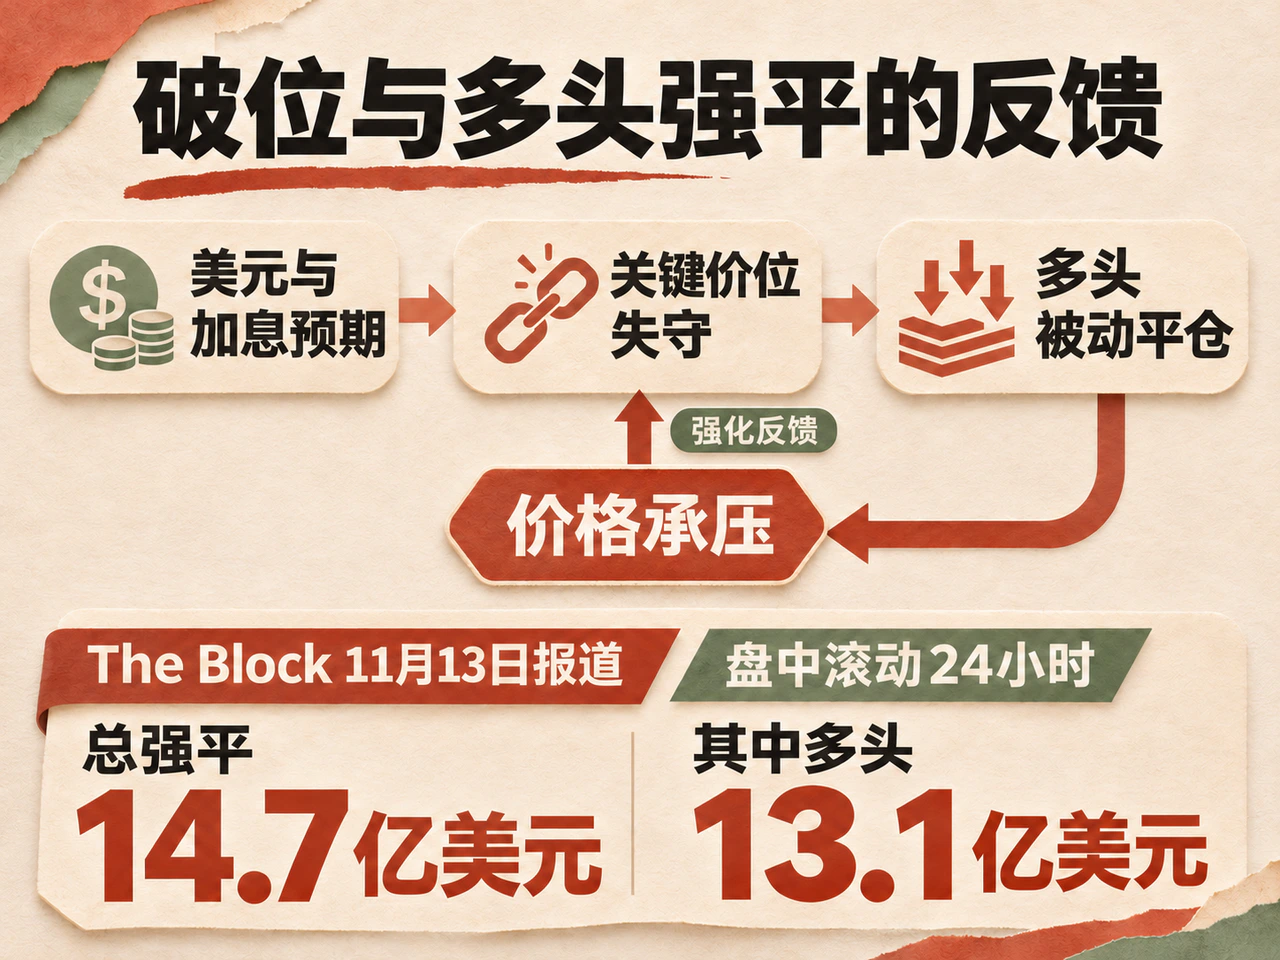
Contemporaneous reporting identified a stronger dollar and rising expectations of interest-rate increases as the main external pressures. CoinDesk reported on the morning of November 13 that the dollar index had reached its highest level since April 2025. After October U.S. inflation data exceeded expectations, markets resumed discussing the size of a possible December rate increase. Higher returns on dollar funds increase the opportunity cost of holding assets that generate no cash yield and reduce the valuations leveraged traders are willing to accept.
The trading feedback was more direct. On November 13, The Block cited Rick Maeda, head of markets at Laevitas, as saying that Bitcoin had already lost $72,000 and that, when it subsequently broke below $70,000, long positions concentrated around that level were rapidly flushed out. He described the accelerated decline as a leverage event and noted that buy-side support had been thin after the inflation release, leaving positions attempting to capture a rebound more vulnerable to liquidation.
The same report cited CoinGlass data showing approximately $1.47 billion in crypto-market liquidations over the rolling 24-hour window at that point, including about $1.31 billion in longs; rolling four-hour liquidations were approximately $798 million. The two windows overlap in time. These intraday statistics mainly show the direction and concentration of forced exits by longs. The spot selloff on higher turnover and the predominance of long liquidations corroborate each other: initial selling depresses prices, and breaches of margin thresholds trigger further forced closures, accelerating the adjustment around key price levels.
Market participants differed on the longer-term implications. BTSE’s Jeff Mei told The Block that digital assets could face further pressure if the rate increase exceeded 25 basis points. ViaBTC’s Jeff Ko, meanwhile, argued that persistent inflation could strengthen the investment case for Bitcoin as an inflation-resistant asset and a hedge against currency debasement over a longer horizon. These views address different time frames: short-term funding costs and margin constraints affect positions first, while the longer-term scarcity narrative still needs to translate into actual allocation demand.
Community discussion has also shifted toward long-term valuation ranges. On November 13, Checkonchain publicly discussed Bitcoin approaching its estimate of the 200-week moving average, raising valuation questions from the perspectives of realized losses and mean reversion. DWF Labs focused on whether weekly moving-average support would give way. Such technical levels can become common reference points for traders. The weekly candle had not yet closed, and whether sustained demand would form around the moving averages still depended on subsequent improvements in actual trading activity and relative prices.
CoinDesk also offered another explanation: expected listings by major AI companies could attract capital, prompting investors to reposition in advance. This perspective provides a way to monitor competition for capital across markets, but the report did not establish a traceable flow of funds from Bitcoin withdrawals into IPO subscriptions. Changes in the dollar and interest-rate expectations, long liquidations at technical breaks, and the increase in spot turnover this period together offer a more coherent short-term explanation.
During this adjustment, the case for long-term holding remained under discussion, while funding costs and position constraints dominated short-term trading. Bitcoin’s recovery from its intraday low to the close shows that buyers were present. For that buying to develop into a sustained recovery, prices need to regain and hold the levels they lost, accompanied by broader improvement across major coins. One coin’s resilience for a single day is not enough to alter the broader picture of contracting risk appetite over the past month.
Click “Read the original” for more details.