On November 13, 2026, DefiLlama's UTC daily data showed that on-chain decentralized exchange spot trading volume rose to $9.061 billion, up 11.57% from the previous day. Trading recovered more strongly on Ethereum and some layer-2 networks, while dollar-denominated total value locked fell across major networks. On the same day, fees at both Aave and Morpho increased by more than 60%, but their recorded protocol revenue differed markedly. The divergence between trading demand, capital retained on-chain and value capture was the main theme in the day's on-chain economy.
Ethereum and some layer-2 networks rebound, but seven-day volume still falls 11.28%
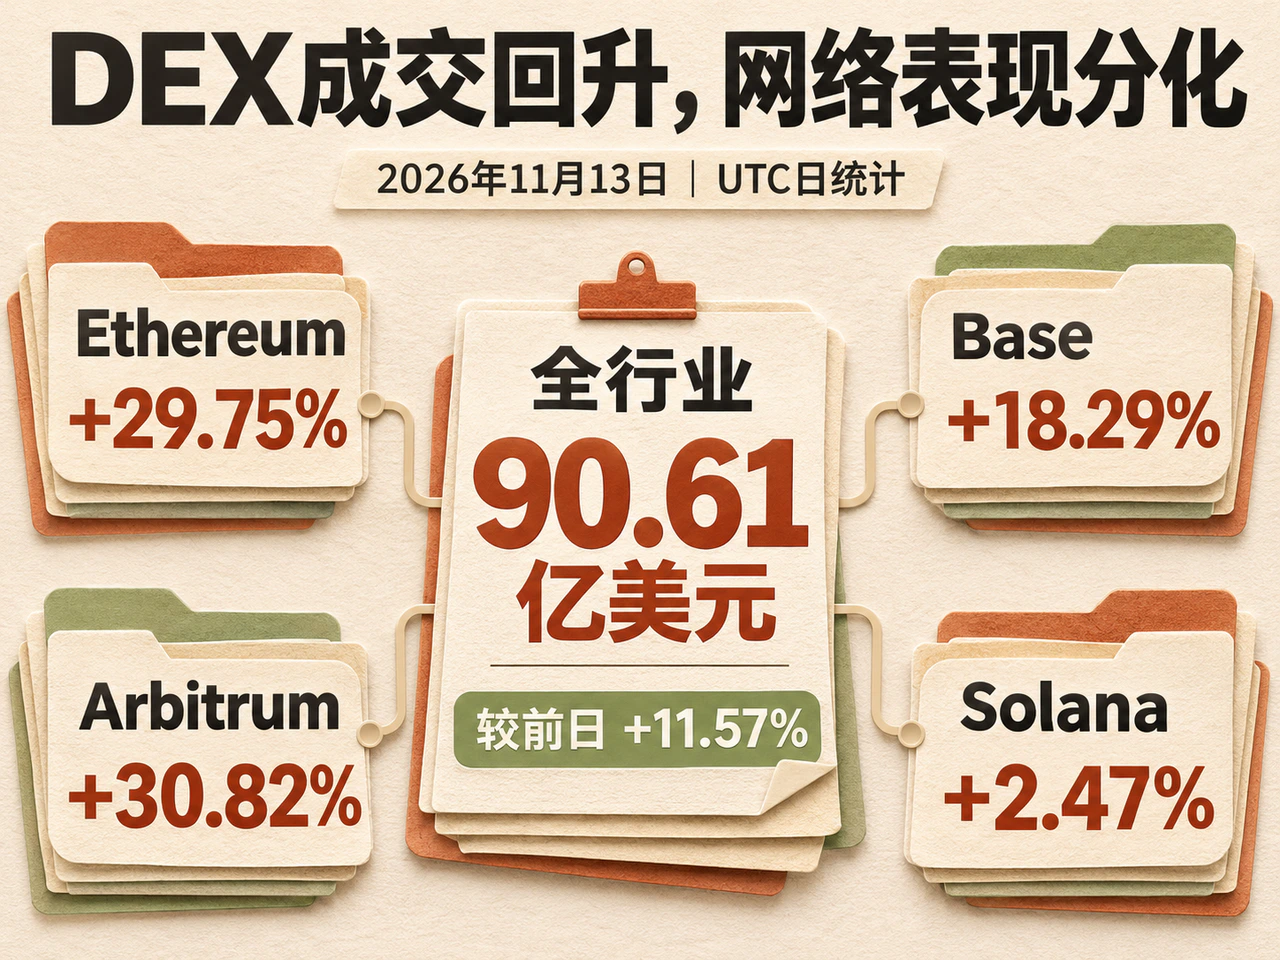
The recovery in trading volume was uneven across networks. Ethereum recorded $2.180 billion for the day, up 29.75% from the previous day; Base recorded $1.305 billion, up 18.29%; and Arbitrum recorded $262 million, up 30.82%. Solana's volume was $1.541 billion, an increase of just 2.47%. Ethereum and some layer-2 networks drove the day's rebound, rather than a synchronized acceleration across public blockchains.
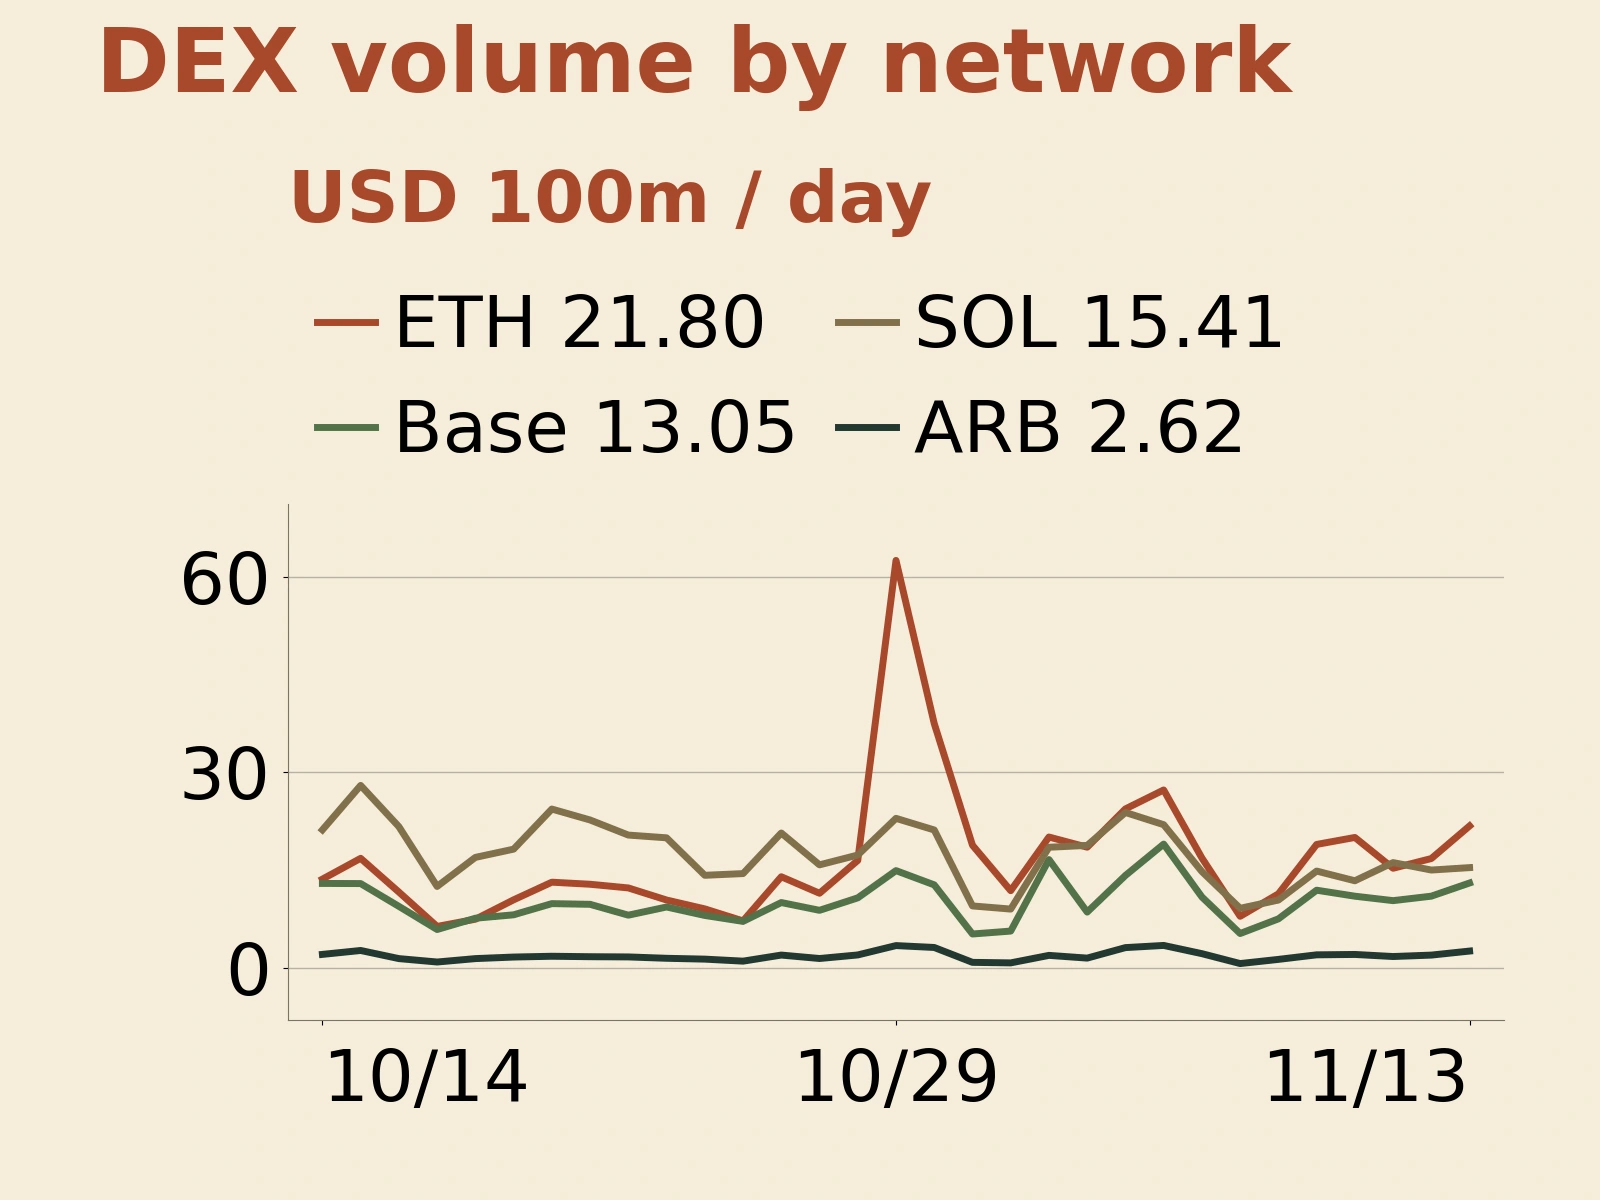
The daily rebound followed an earlier contraction in volume. Across the seven complete UTC trading days from November 7 to 13, on-chain spot trading totaled $53.893 billion, down 11.28% from $60.745 billion in the preceding seven days. November 13 volume was also below the levels on November 4 and 5, when daily volume exceeded $11 billion on each day. Daily activity has improved, but a sustained expansion still requires supporting volume over more complete trading days.
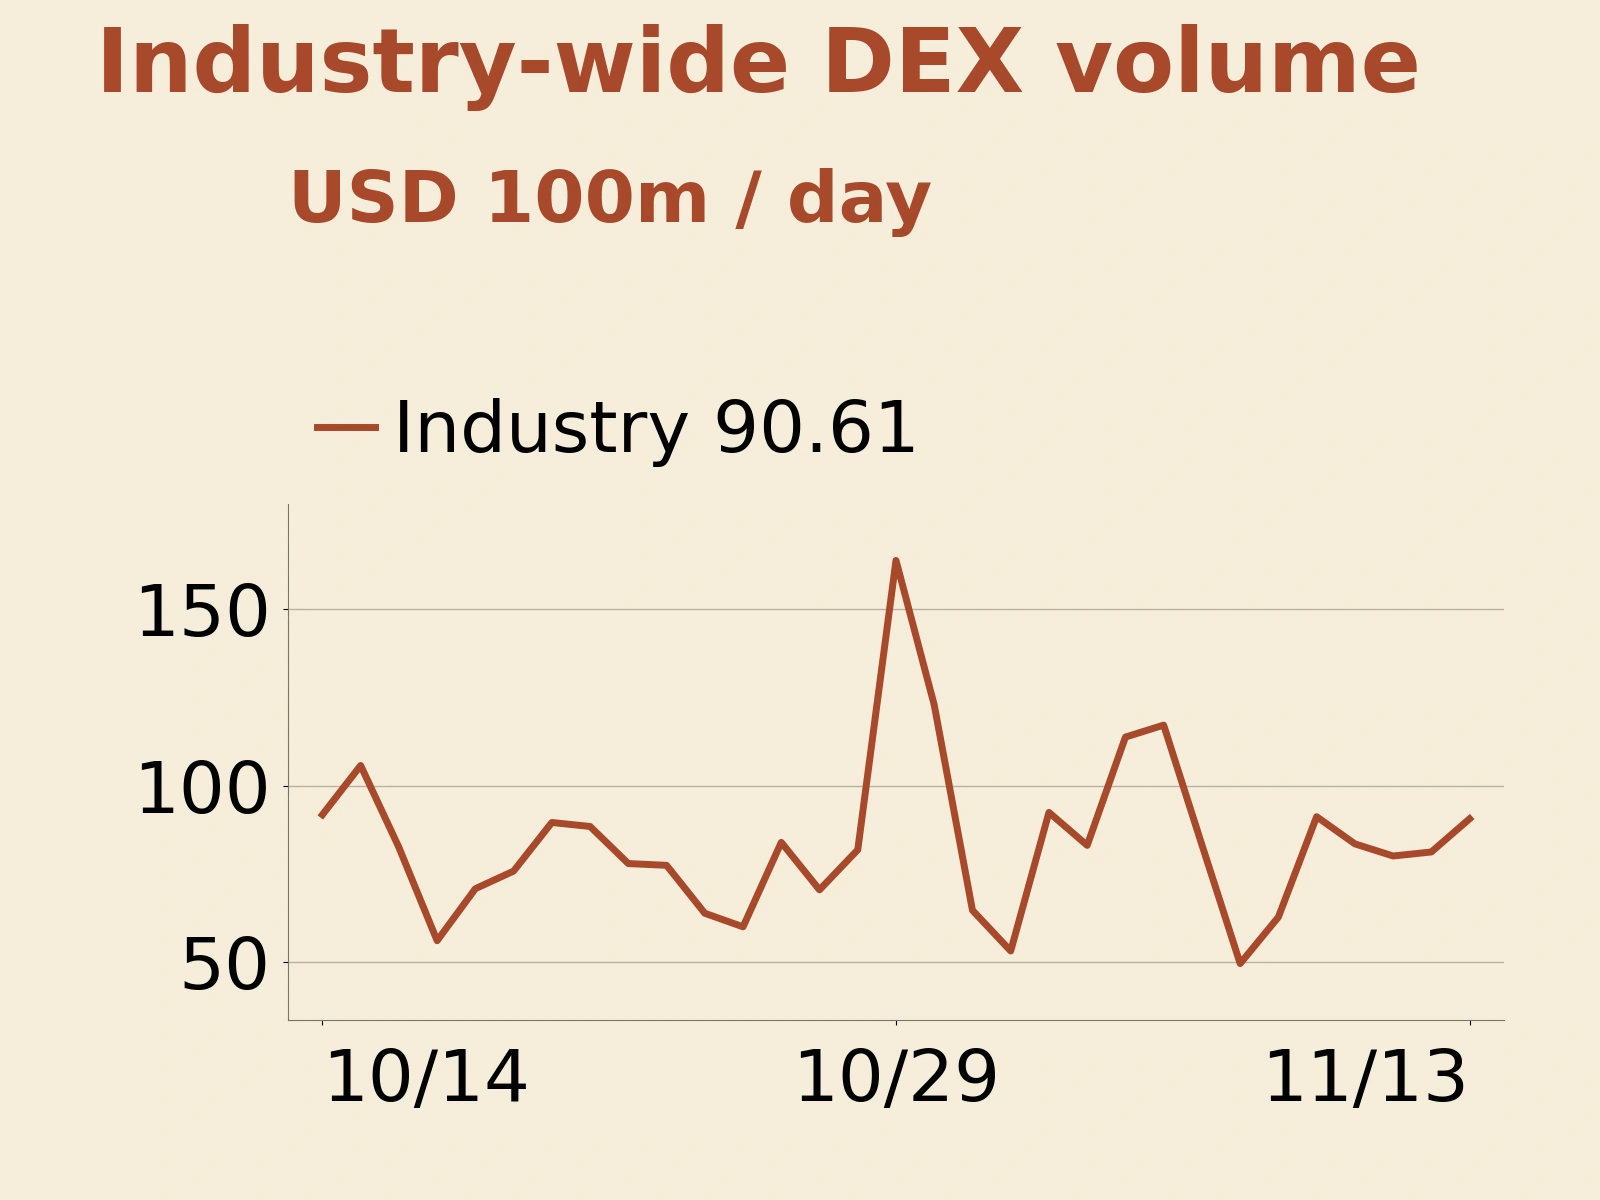
Dollar TVL falls across major networks as trading activity diverges from capital retention
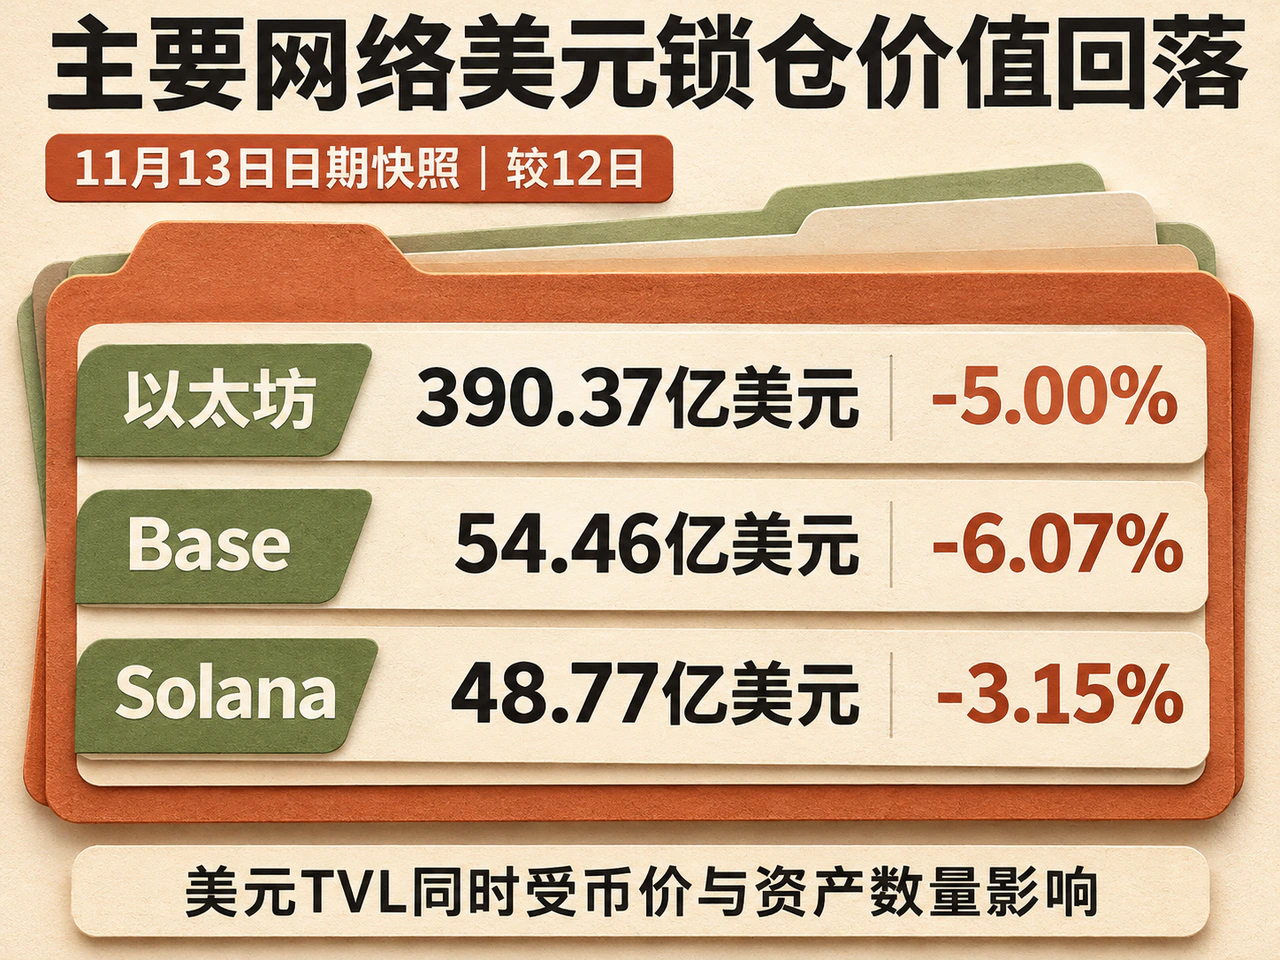
The asset side moved in the opposite direction. DefiLlama's daily TVL snapshots dated November 13 showed Ethereum at $39.037 billion, down 5.00% from the November 12 data point; Base at $5.446 billion, down 6.07%; and Solana at $4.877 billion, down 3.15%. The corresponding snapshots for Arbitrum, BNB Chain and Tron also declined.
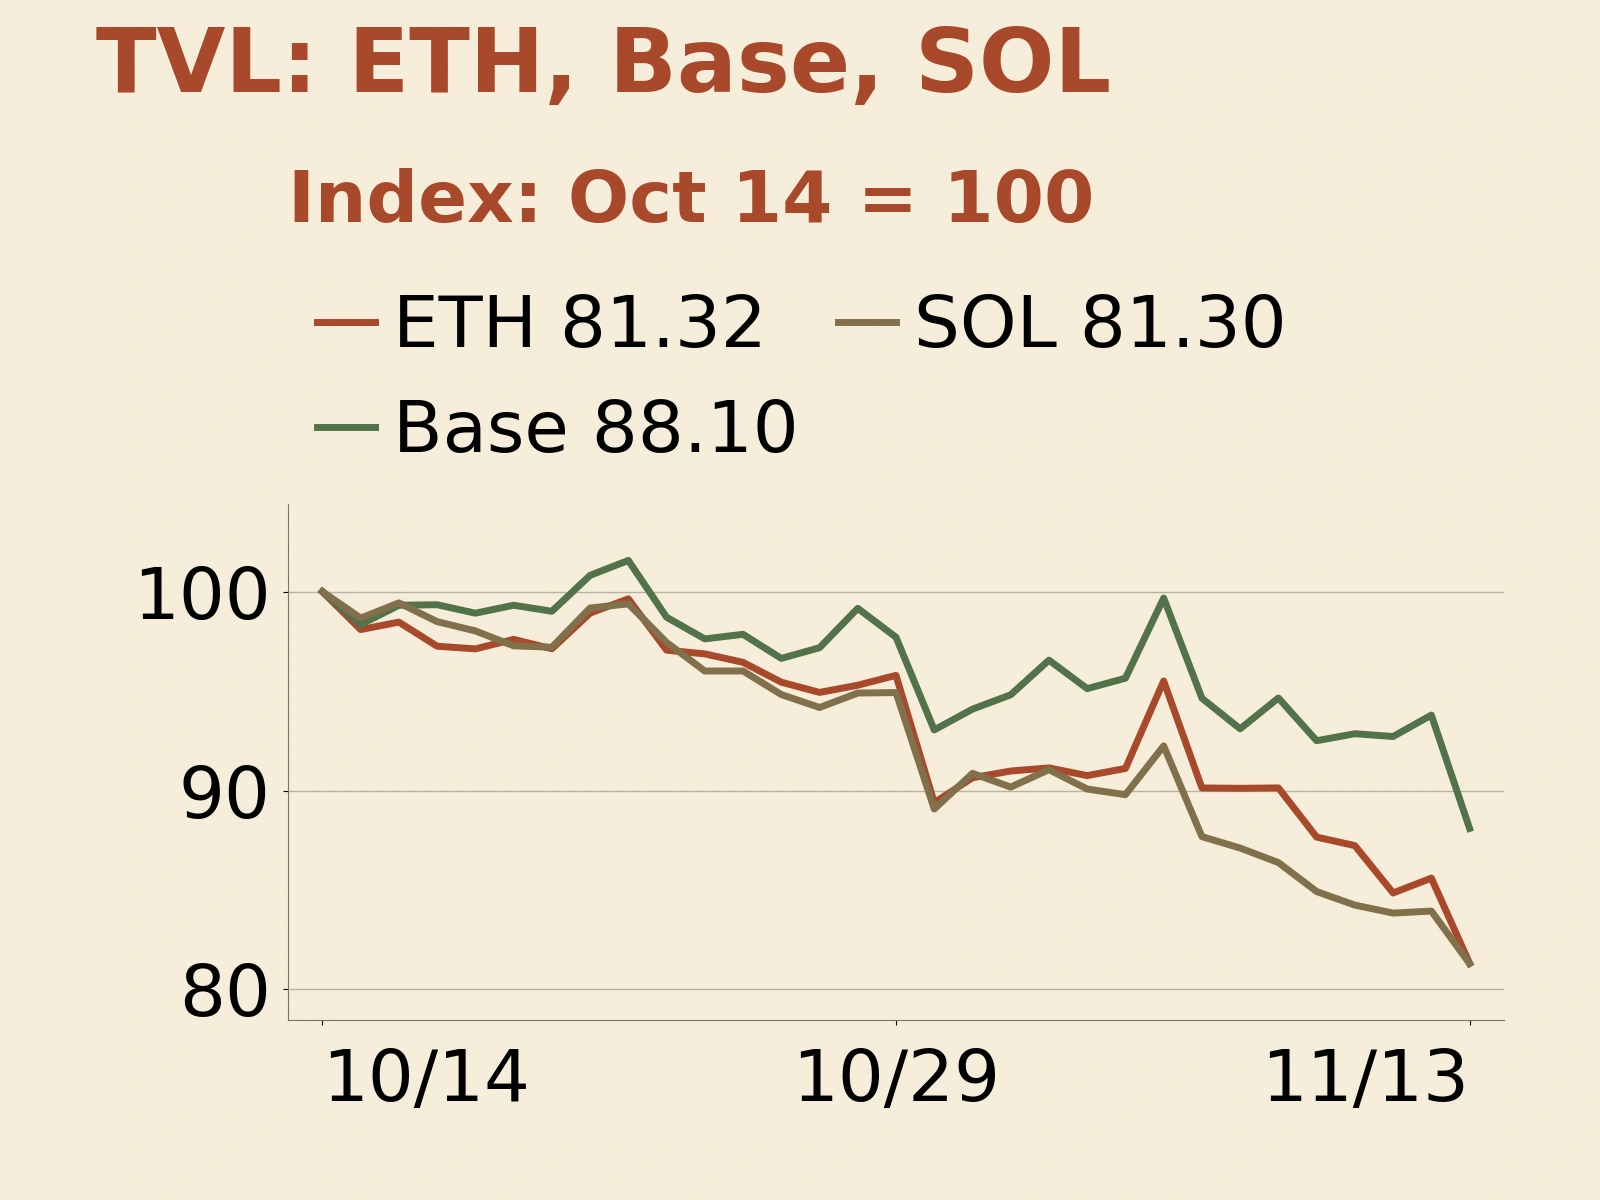
Dollar-denominated TVL reflects both token prices and the quantity of deposited assets. These figures show a decline in the dollar value of assets held; assessing whether capital has moved, and where it has gone, also requires asset quantities and cross-chain flows.
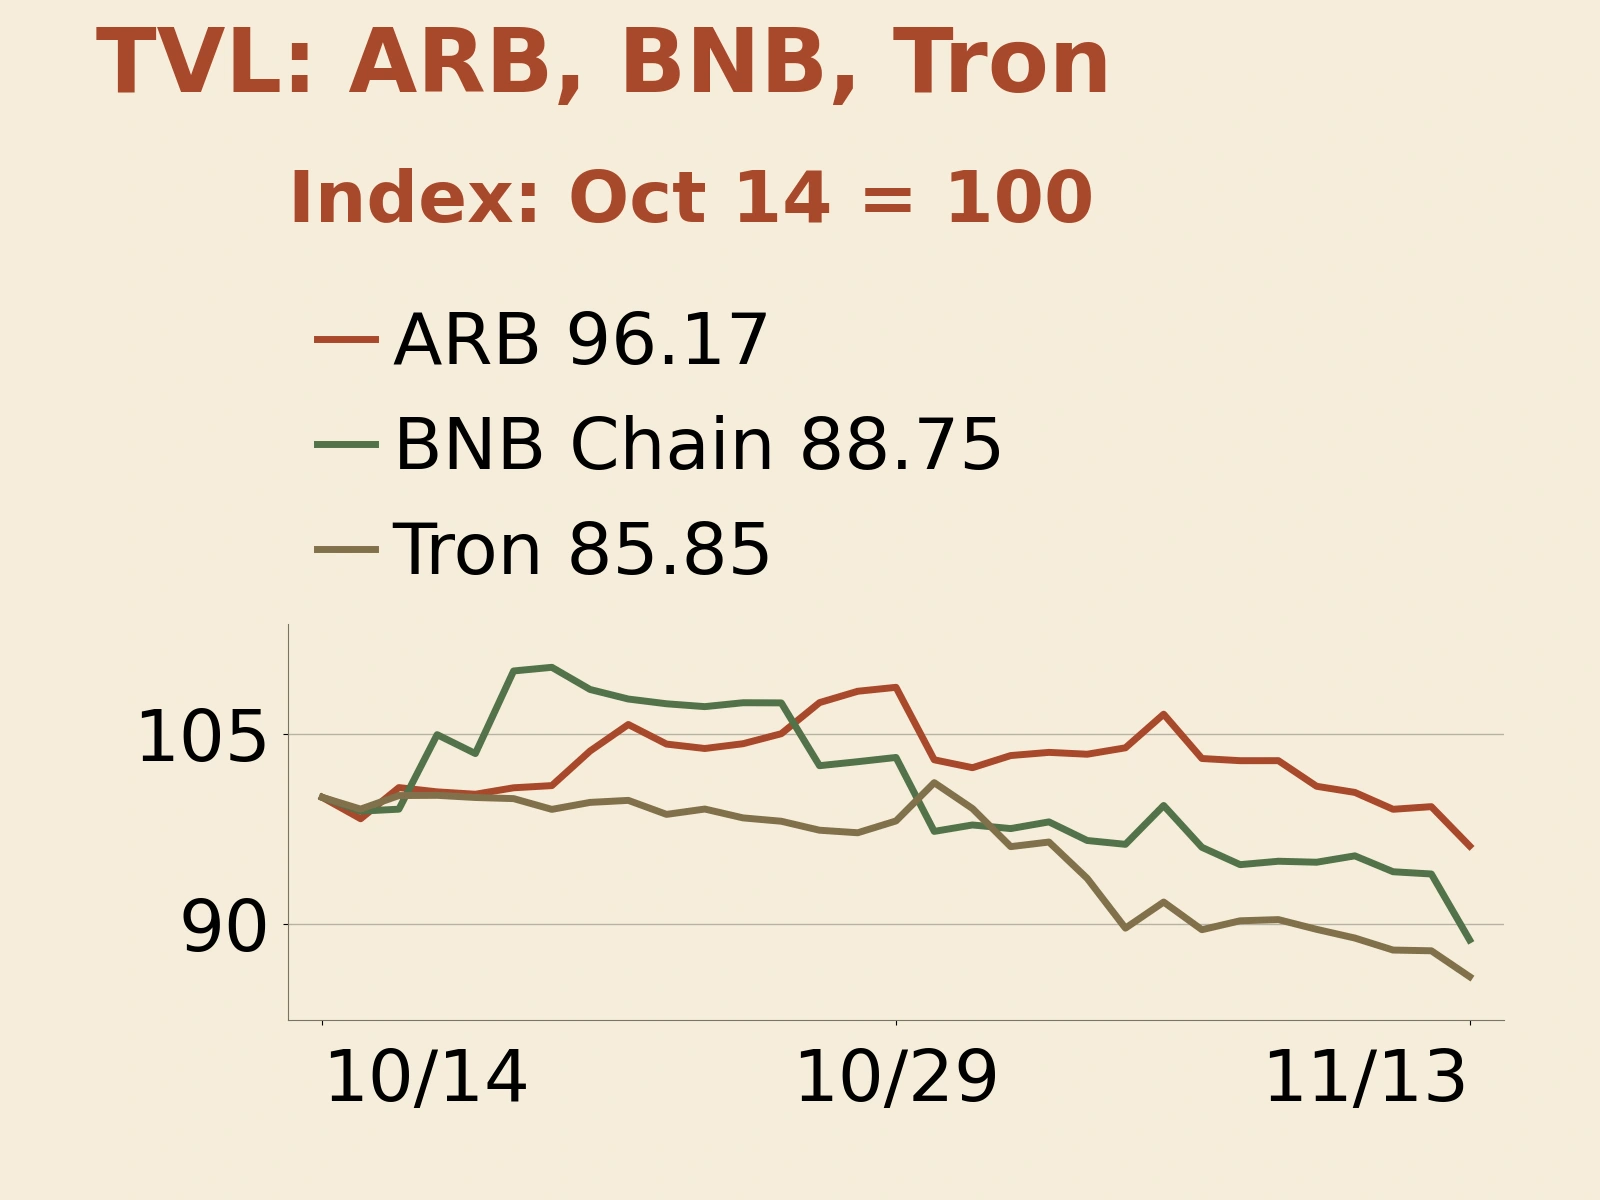
The combination of rising volume and falling TVL suggests that asset swaps and position adjustments are the more prominent sources of on-chain demand at present. A smaller pool of capital can be traded repeatedly, increasing the intensity of trading-service use without necessarily expanding the capital available for lending, market making and risk taking. Evaluating public blockchains and applications requires attention both to how much users want to trade and to whether capital is willing to remain in the system.
Stablecoin payments and real-world asset tokenization are longer-term sources of demand. On November 12, DTCC announced plans to integrate Solana, aiming to enable eligible DTC-custodied assets to be tokenized on the network in the second half of 2027, with a focus on collateral mobility, liquidity management and capital efficiency. The plan offers a concrete route for institutional assets to enter a public blockchain; translating integration plans into actual asset balances, turnover and fees still depends on product implementation.
Lending fees rise more than 60% at both protocols, while Aave and Morpho revenue diverges
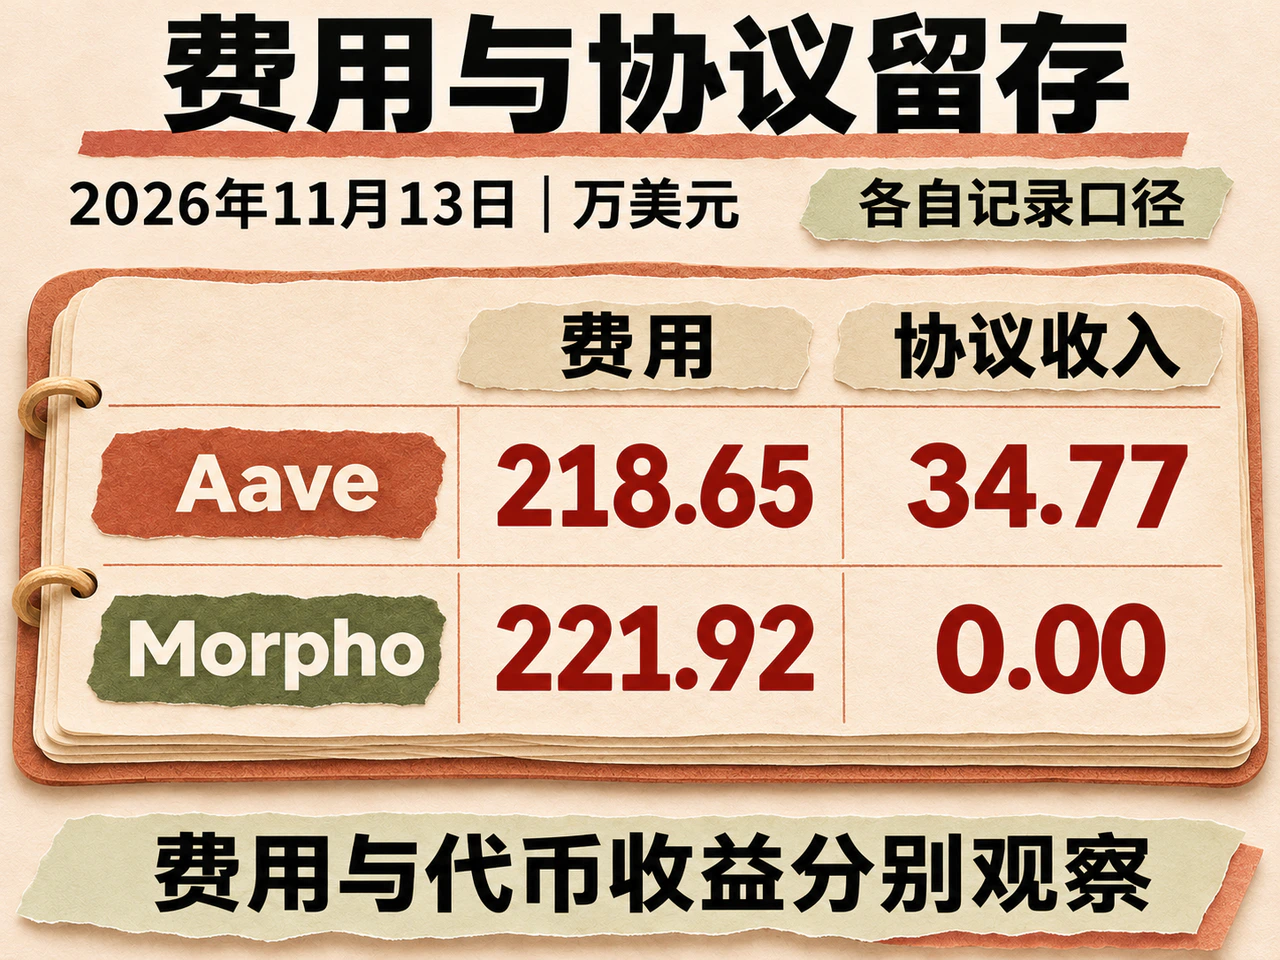
Lending provides one way to examine how on-chain activity translates into revenue. On November 13, Aave's fees across all products were $2.1865 million, up 61.19% from the previous day; Morpho's fees were $2.2192 million, up 71.35%. Under DefiLlama's respective reporting methodologies, the two protocols generated similar fee totals and both posted sharp increases, reflecting higher payments for lending and related settlement activities. Their fee composition and distribution, however, differ.
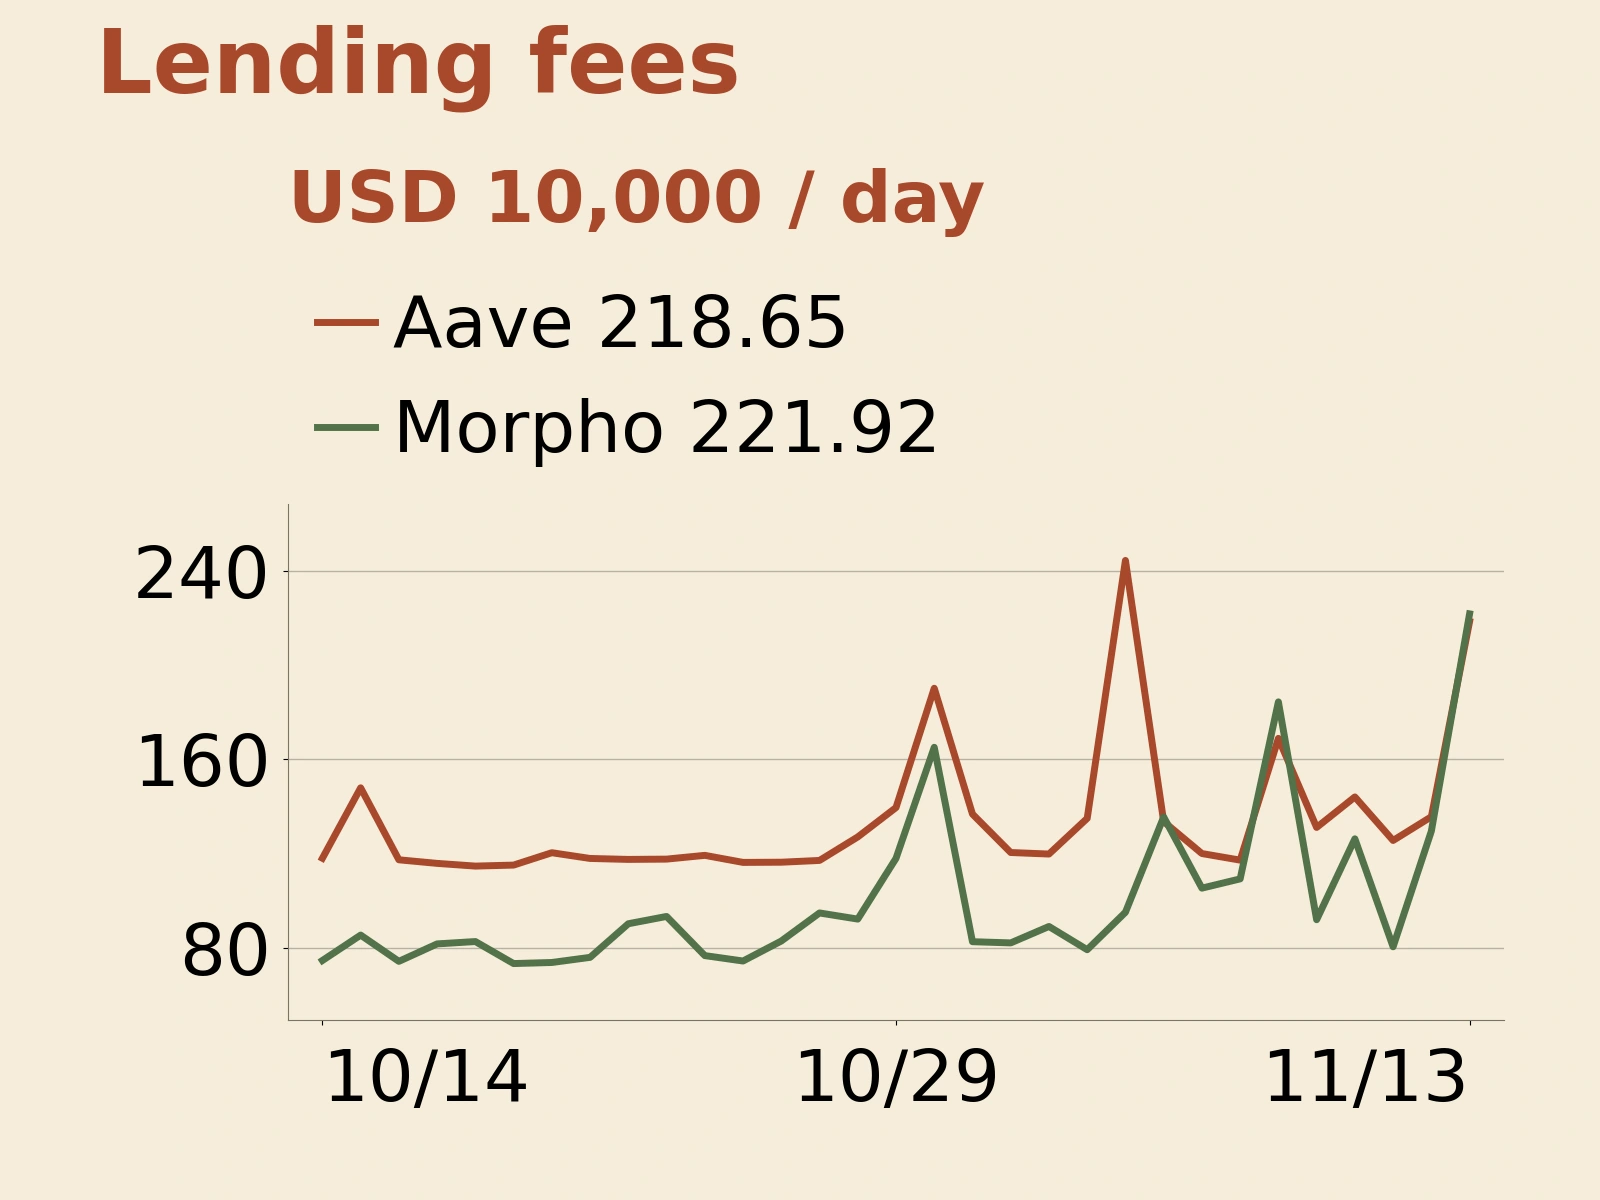
Under DefiLlama's definitions, Aave's fees include borrowing interest, flash-loan fees and liquidation-related fees, among other items; Morpho Blue's fees include borrowing interest and liquidation incentives received by liquidators. These amounts therefore include interest from ongoing lending relationships and may also include one-off payments arising from position adjustments. When markets are volatile, assessing revenue quality and durability also requires outstanding borrowing balances, interest rates and the composition of liquidations.
The difference in value retained by the protocols is more direct. Aave recorded $347,700 in protocol revenue for the day, about 15.9% of total fees. The gap between total fees and protocol revenue reflects the need to distribute returns to capital providers and other participants in the lending business. Morpho's corresponding recorded protocol revenue was zero: under its Blue methodology, interest goes to capital providers and liquidation incentives go to liquidators. Similar fee totals thus corresponded to markedly different protocol revenue.
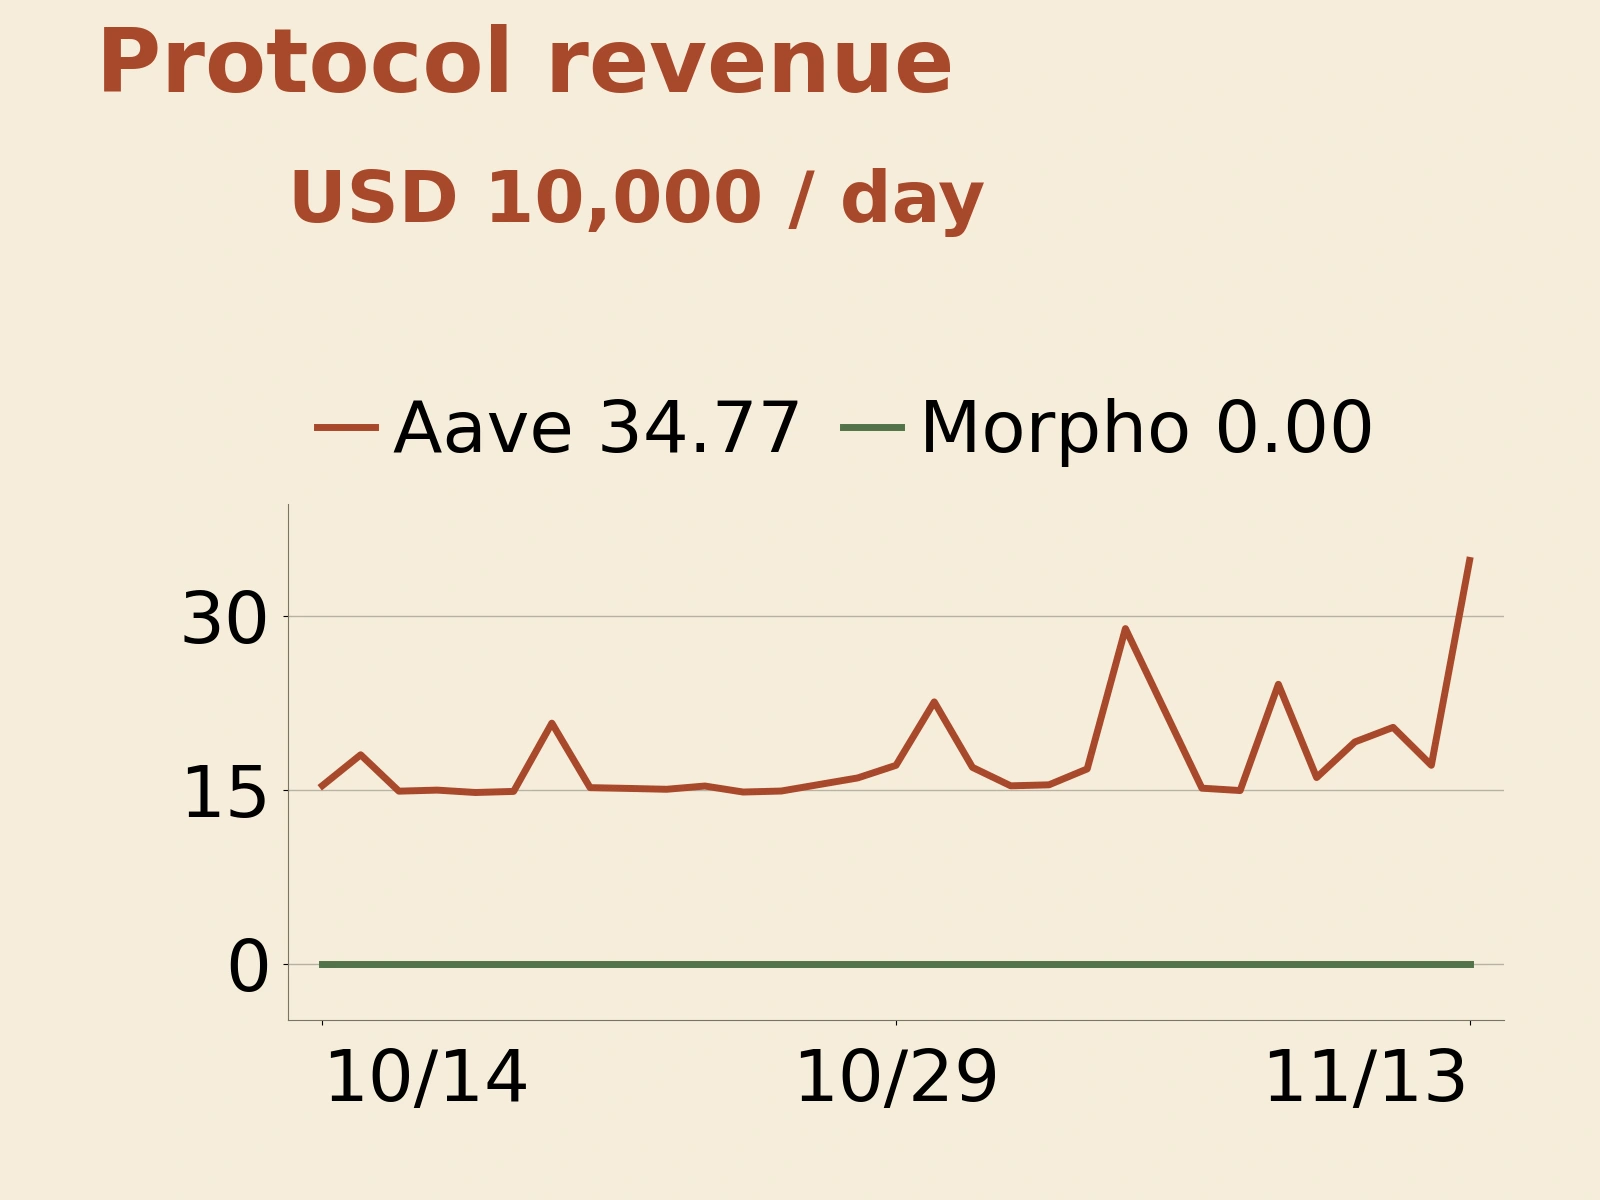
Analysis of on-chain business performance therefore needs to trace the distribution mechanism further. Fees paid by traders, interest earned by depositors, revenue retained by protocols and value actually received by token holders are distinct, connected stages. Fee growth demonstrates that services are being used; whether it improves a token's economic foundations also depends on the protocol's actual retention of revenue, governance arrangements and implementation.
The day's data reveal three developments moving out of step: demand for trading and some lending services recovered, dollar-denominated TVL fell across major networks, and the conversion of fees into protocol revenue differed with distribution mechanisms. A firmer foundation for improved business performance would require trading volume to remain elevated over multiple complete trading days, asset quantities and TVL to stabilize, and protocol revenue to keep rising alongside fees. Institutional tokenization businesses will need actual asset turnover and fee generation to follow the current integration plans.
Click the original-article link for further details.