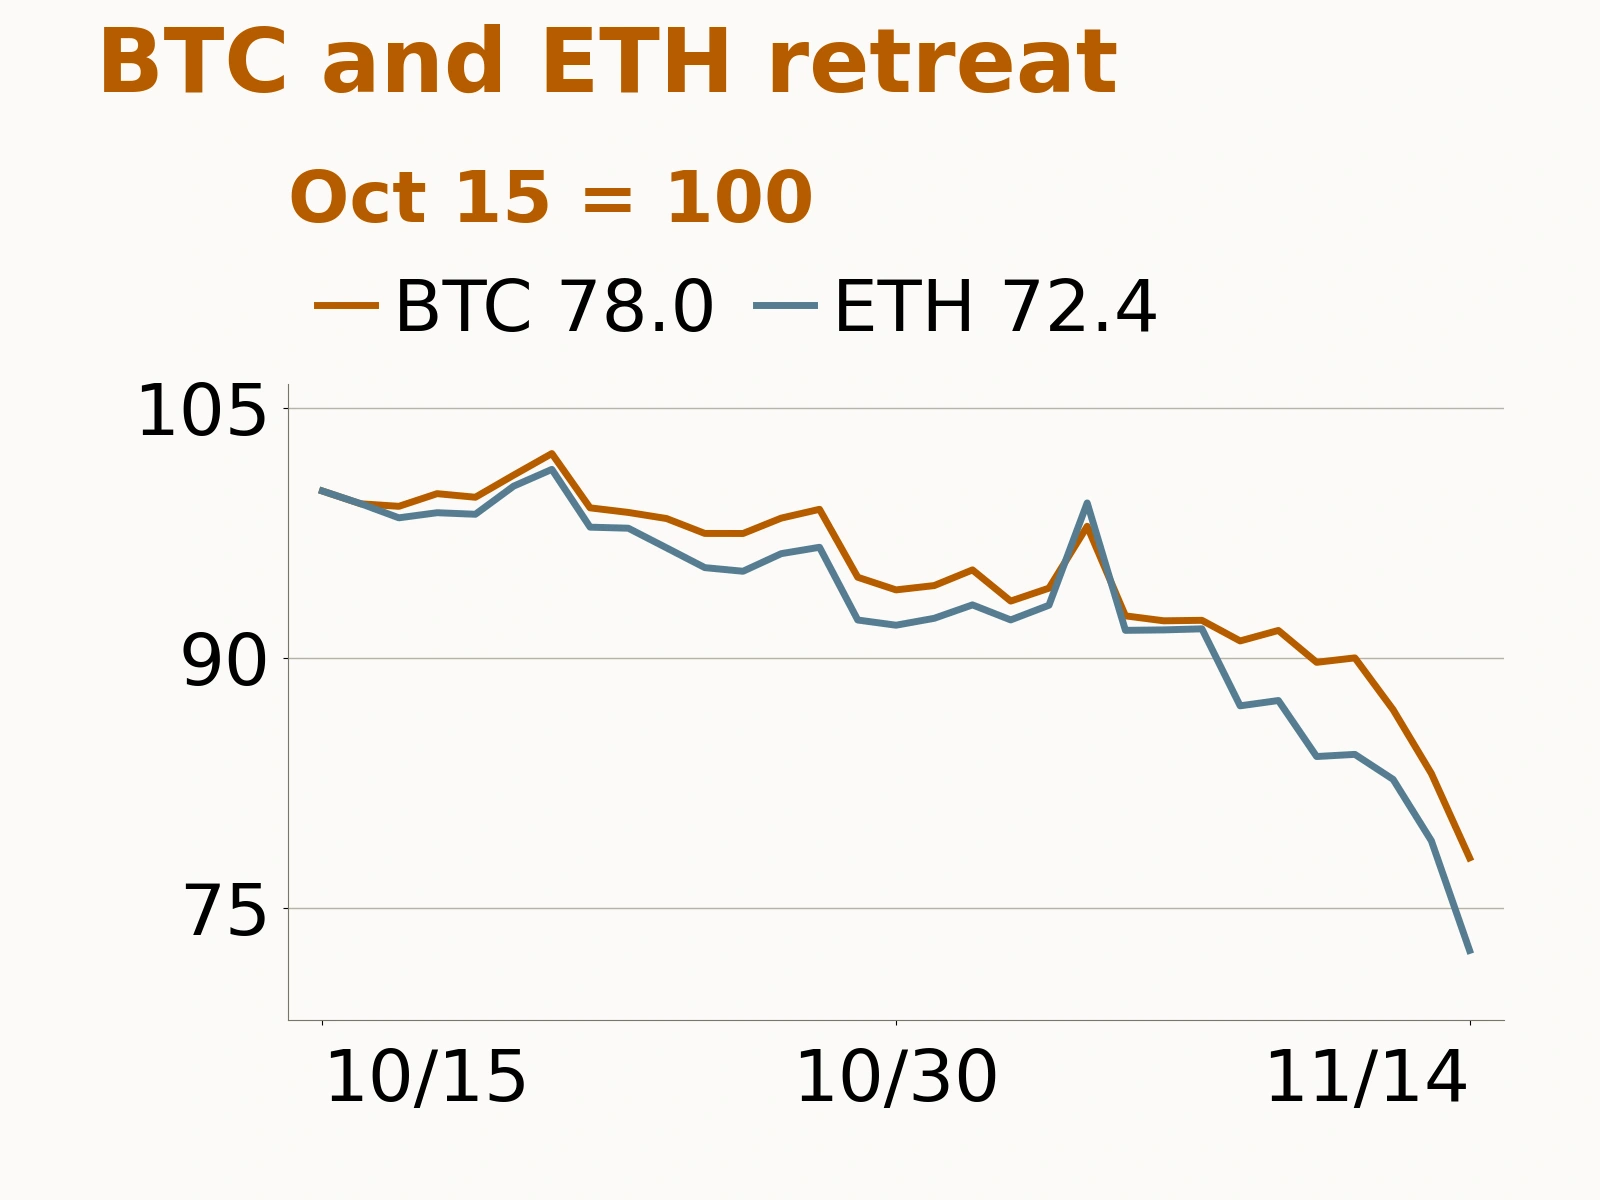
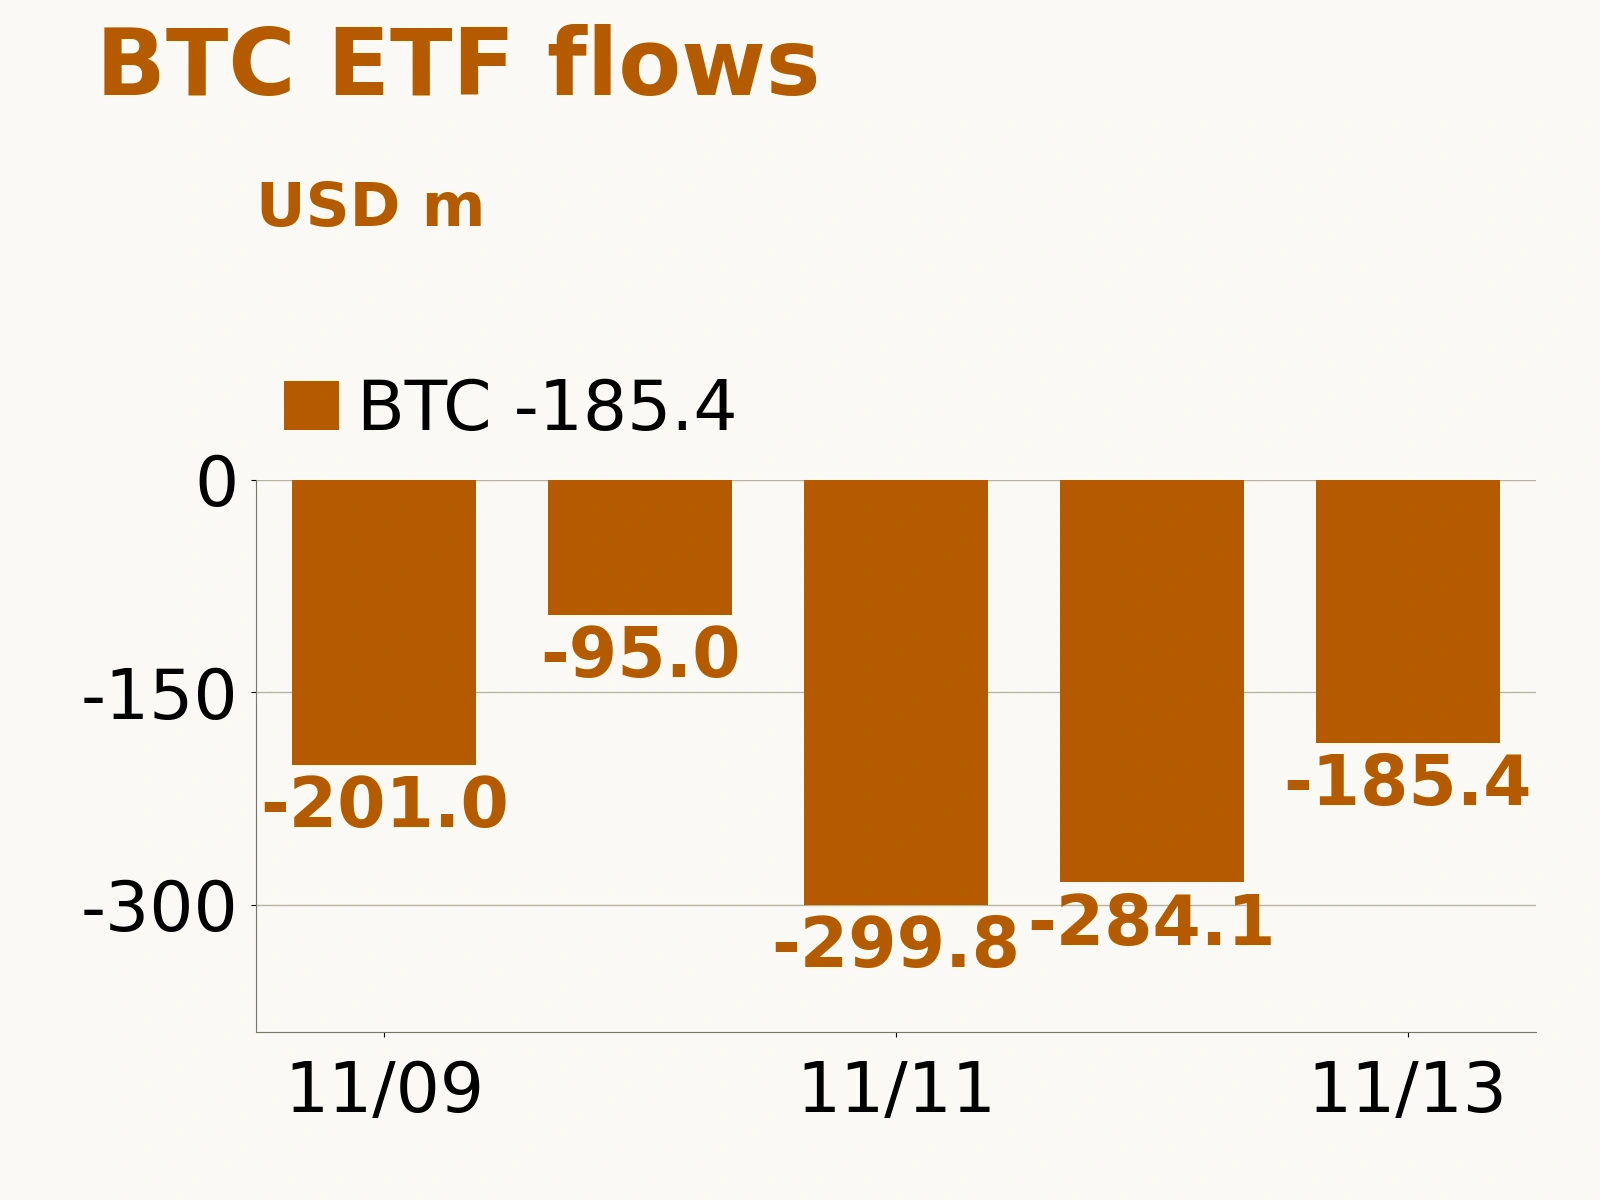
On November 14, 2026, Kava disclosed an irregularity in its lending application and subsequently confirmed cross-chain transfers and sales of KAVA. An analysis of on-chain data by The Block found that an attacker exploited a nearly empty BUSD lending market to borrow approximately 55.2 million KAVA from Kava Lend.
The incident comes at a time when on-chain asset valuations are under pressure and trading activity and user payments are diverging. Major networks still support substantial assets and transaction demand, yet legacy lending markets can continue to accumulate risk despite low activity. Assessing the on-chain economy requires distinguishing total value locked, user fees and revenue retained by protocols, while also tracking who ultimately bears the risk.
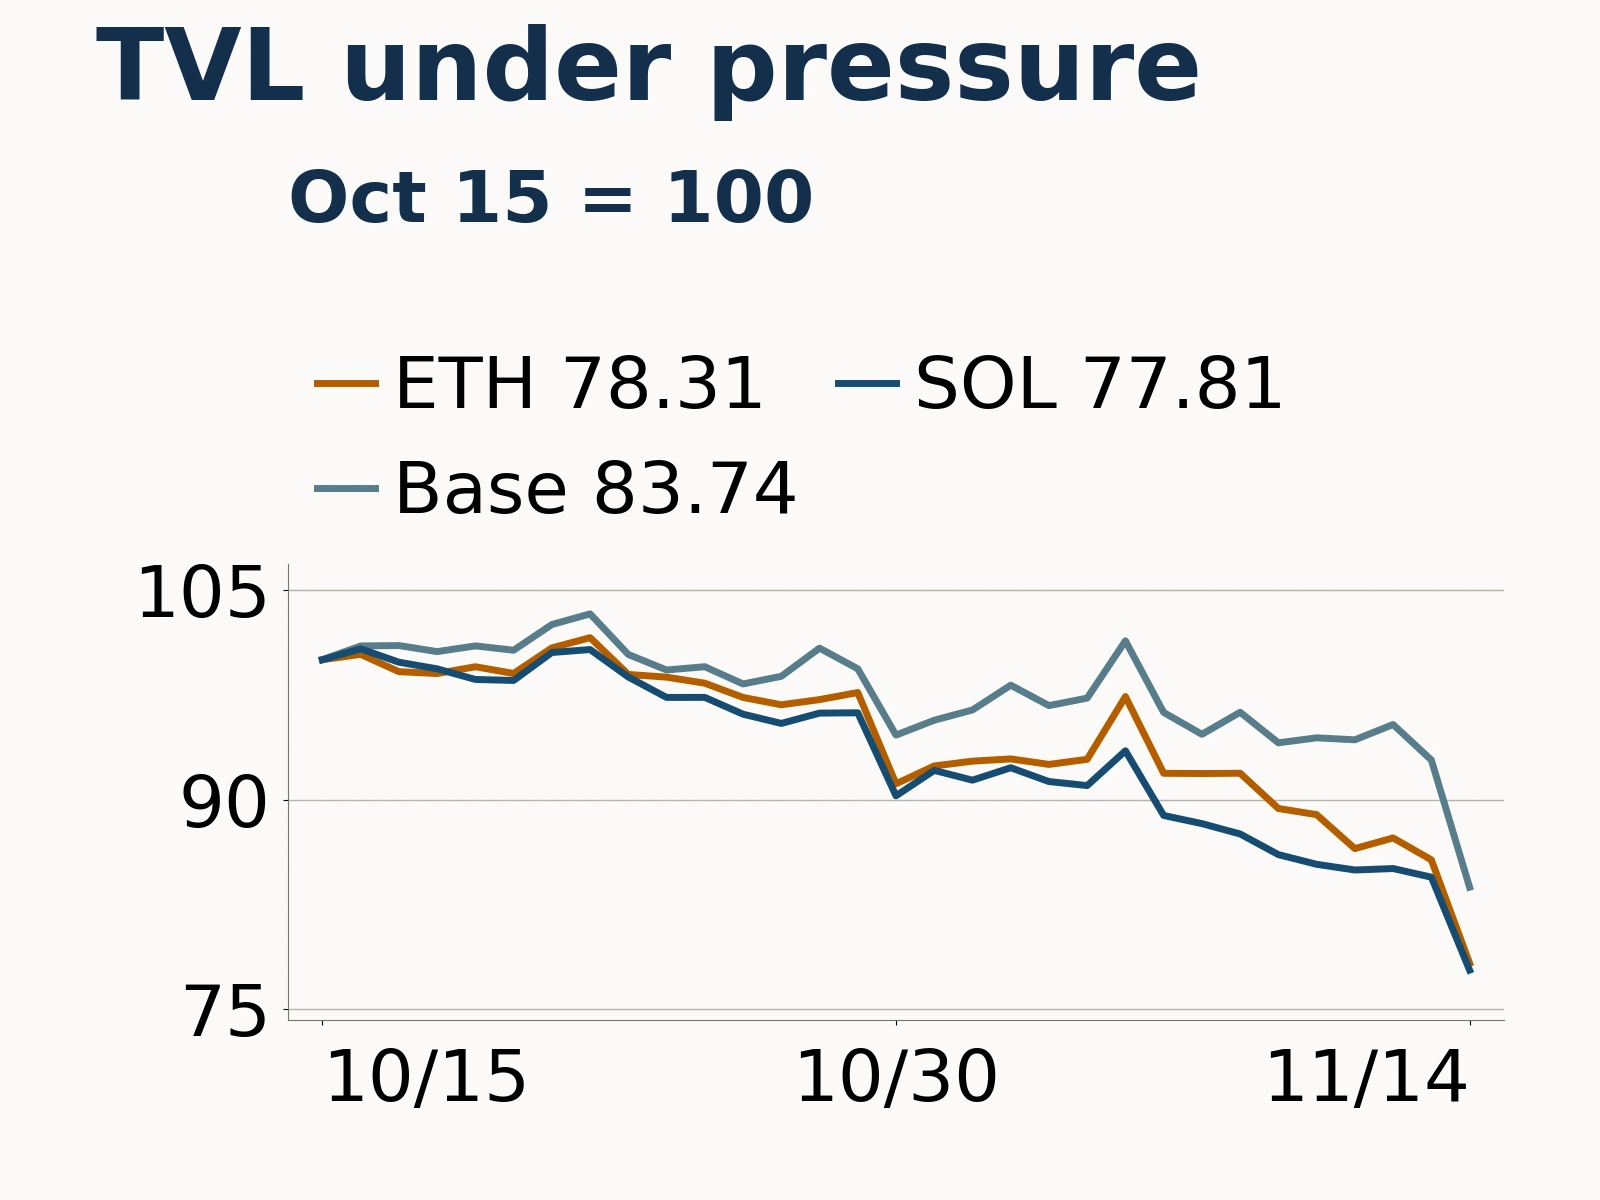
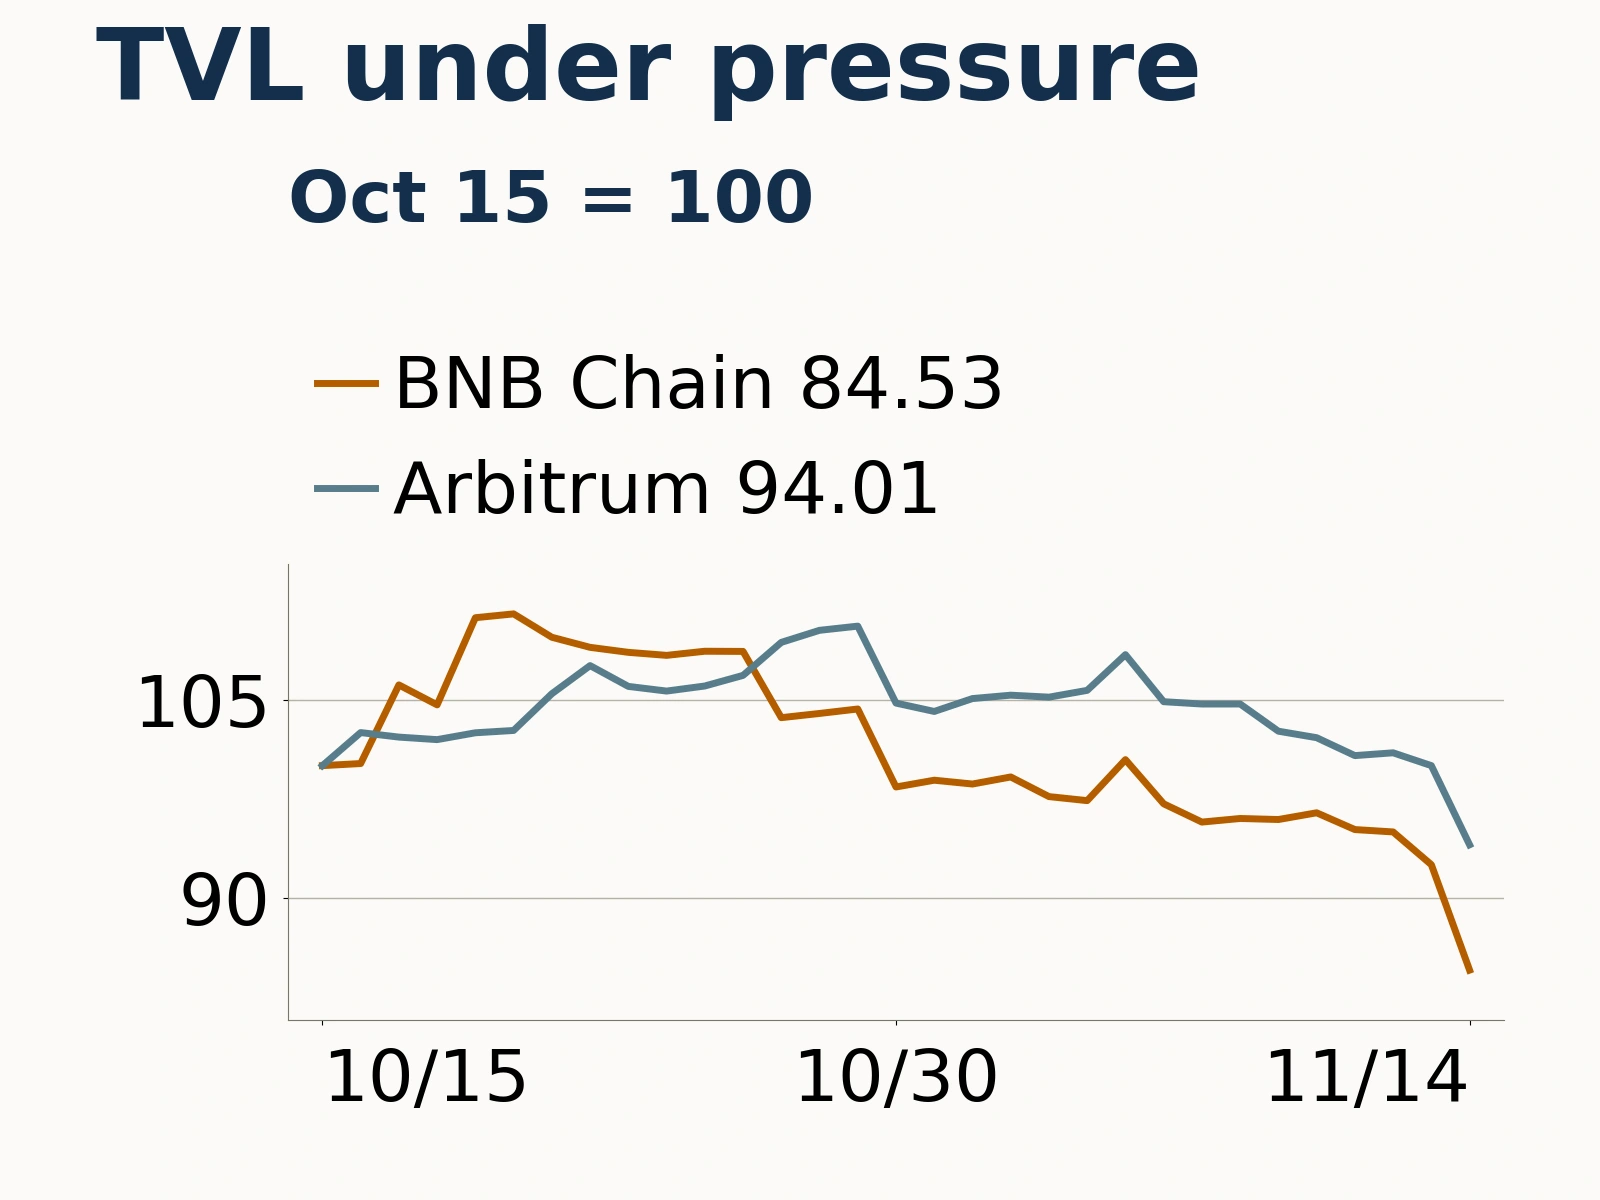
TVL on five major networks falls roughly 10%–15% over seven days; Base fees rise 77%

DefiLlama’s daily records labelled November 14 put DeFi total value locked at approximately $36.877 billion on Ethereum, $5.092 billion on Base, $4.606 billion on Solana, $4.483 billion on BNB Chain and $1.290 billion on Arbitrum. TVL across all five networks was down approximately 10%–15% from seven days earlier. These changes include movements in collateral prices and reflect a contraction in the dollar value of assets; the declines cannot be equated directly with net capital outflows of the same amount.
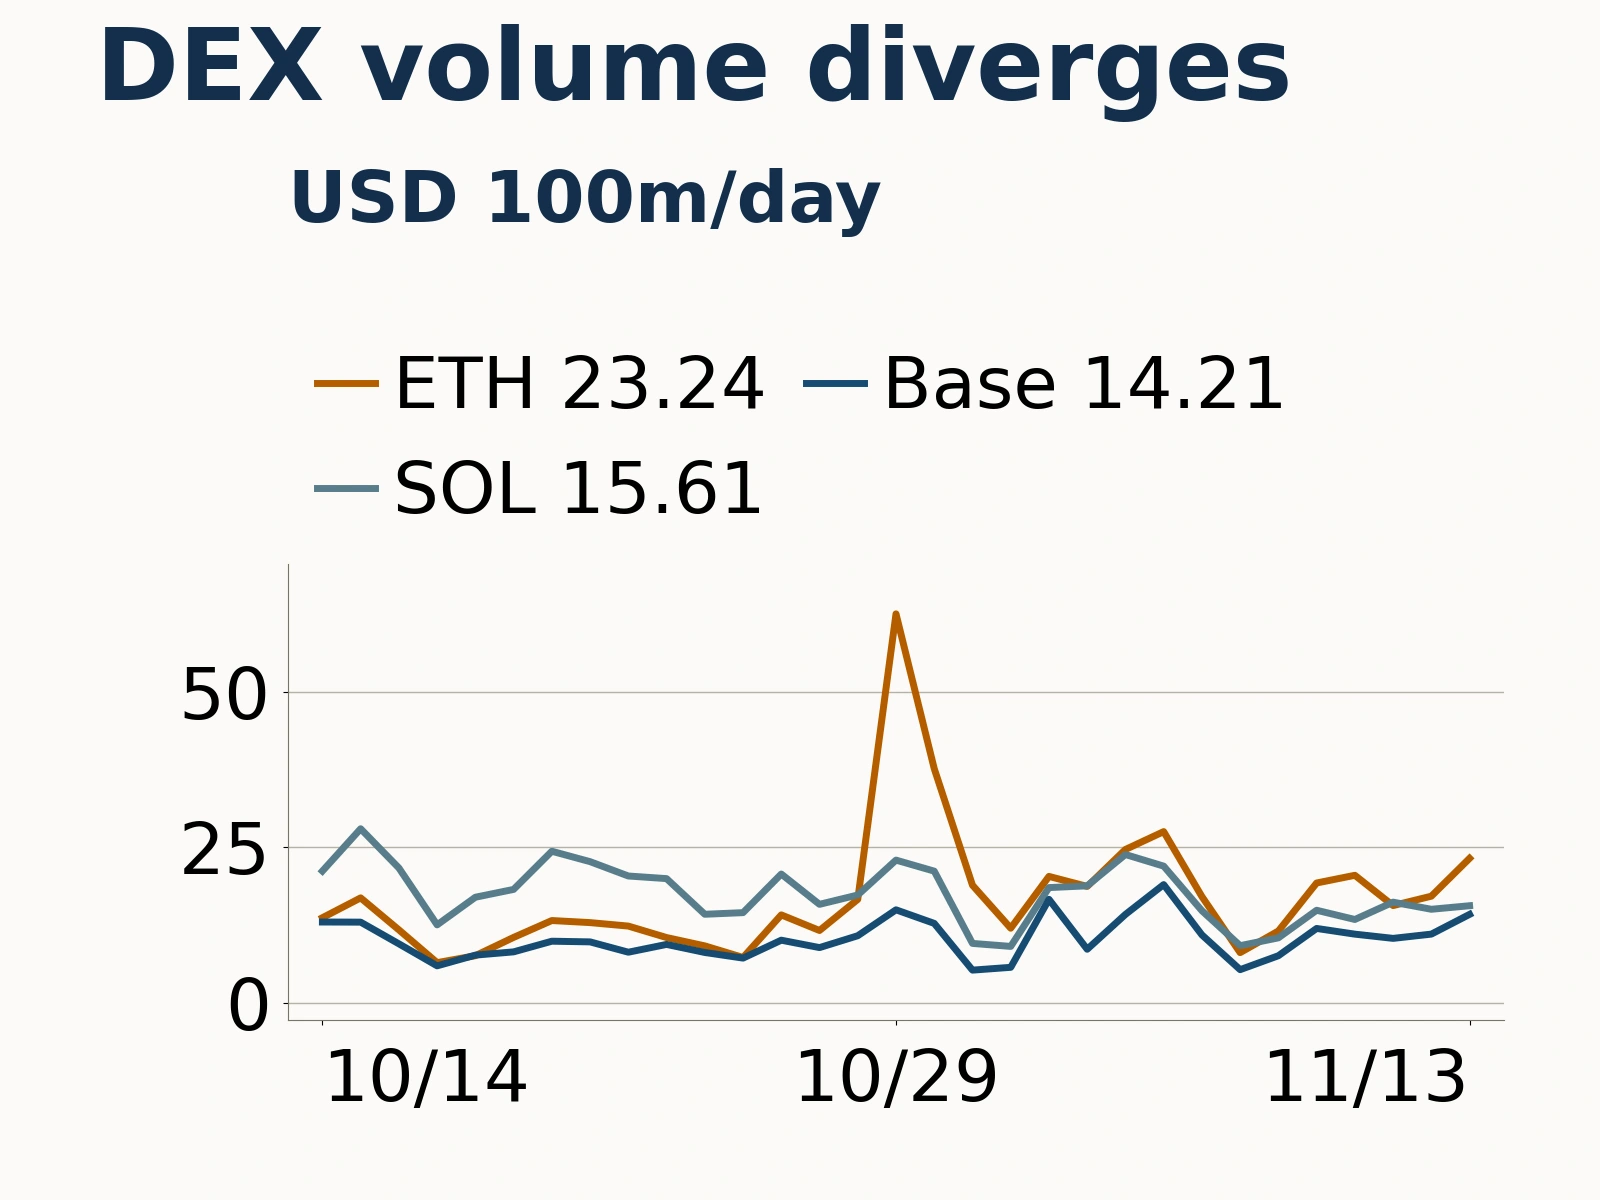
Trading activity is diverging. Comparable daily records for November 13 show DEX volumes of approximately $2.324 billion on Ethereum, $1.561 billion on Solana and $1.421 billion on Base. As an Ethereum layer-2 network, Base was already approaching Solana’s daily trading volume. This comparison shows that competition for applications and liquidity takes place both among public blockchains and between mainnets and layer-2 networks. An assessment of on-chain trading therefore needs to extend beyond mainnets.
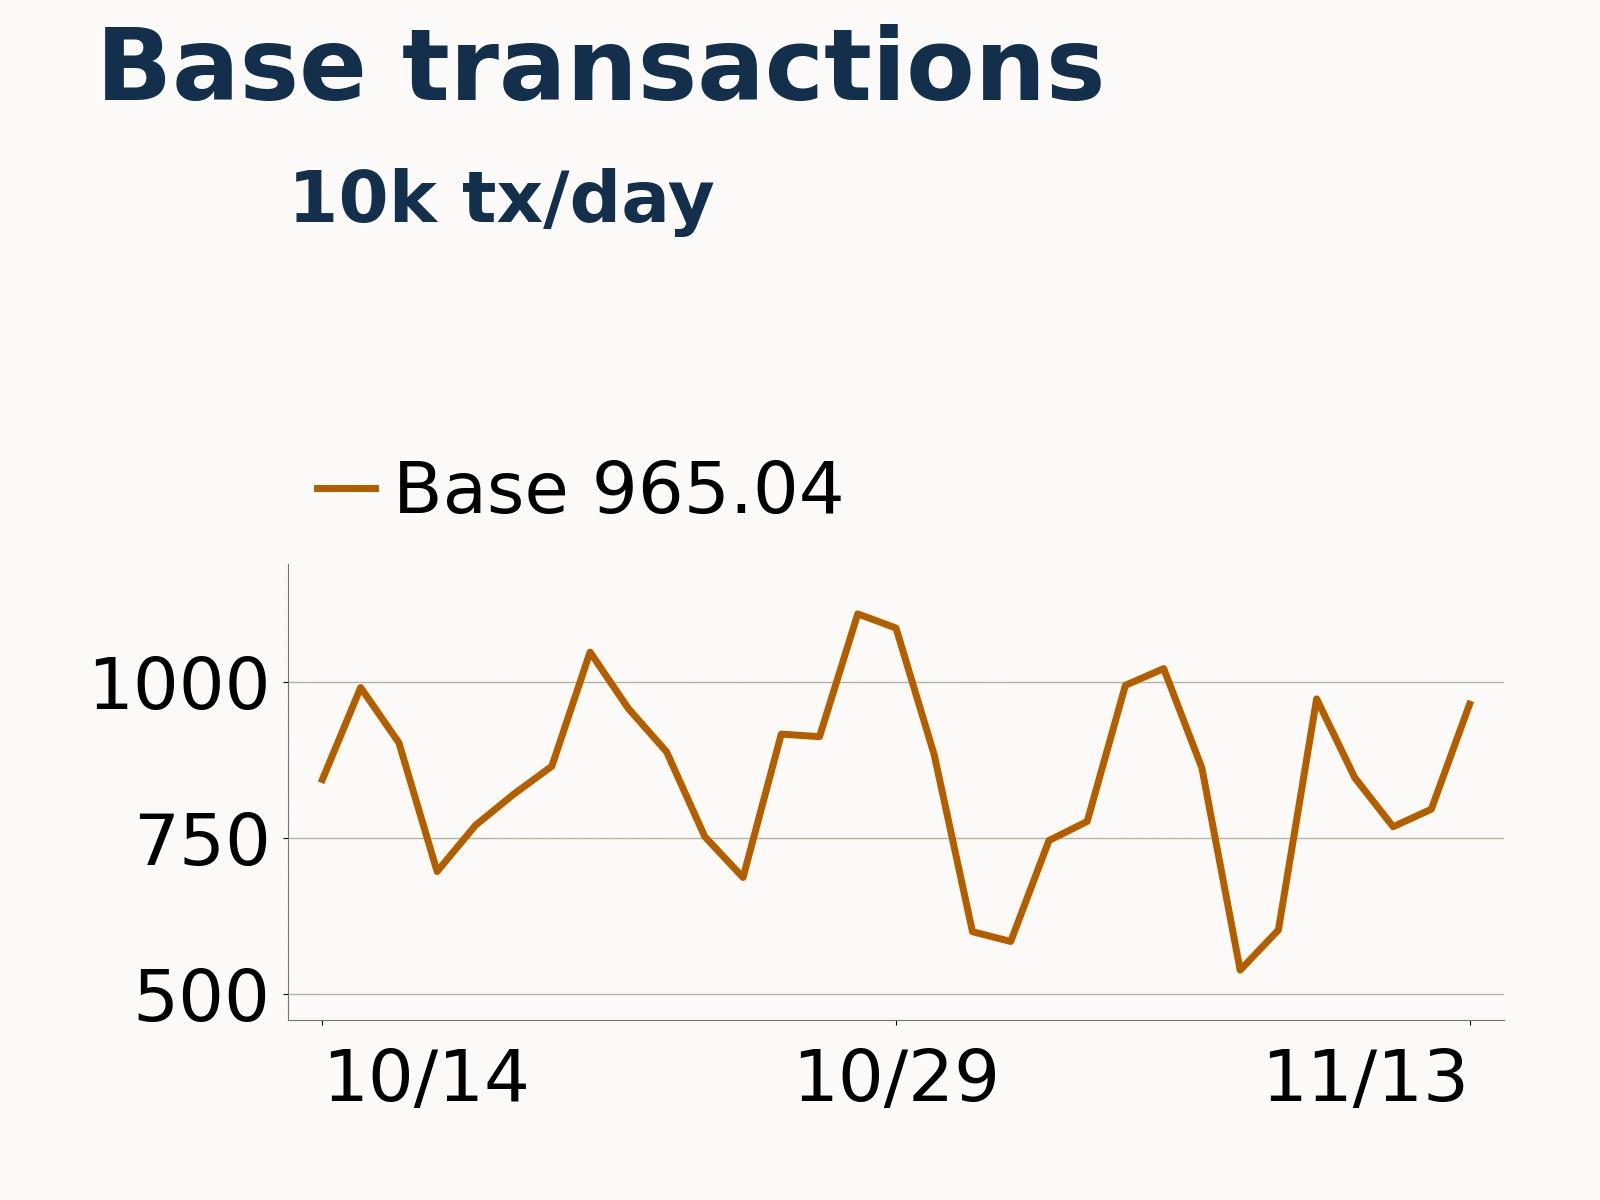
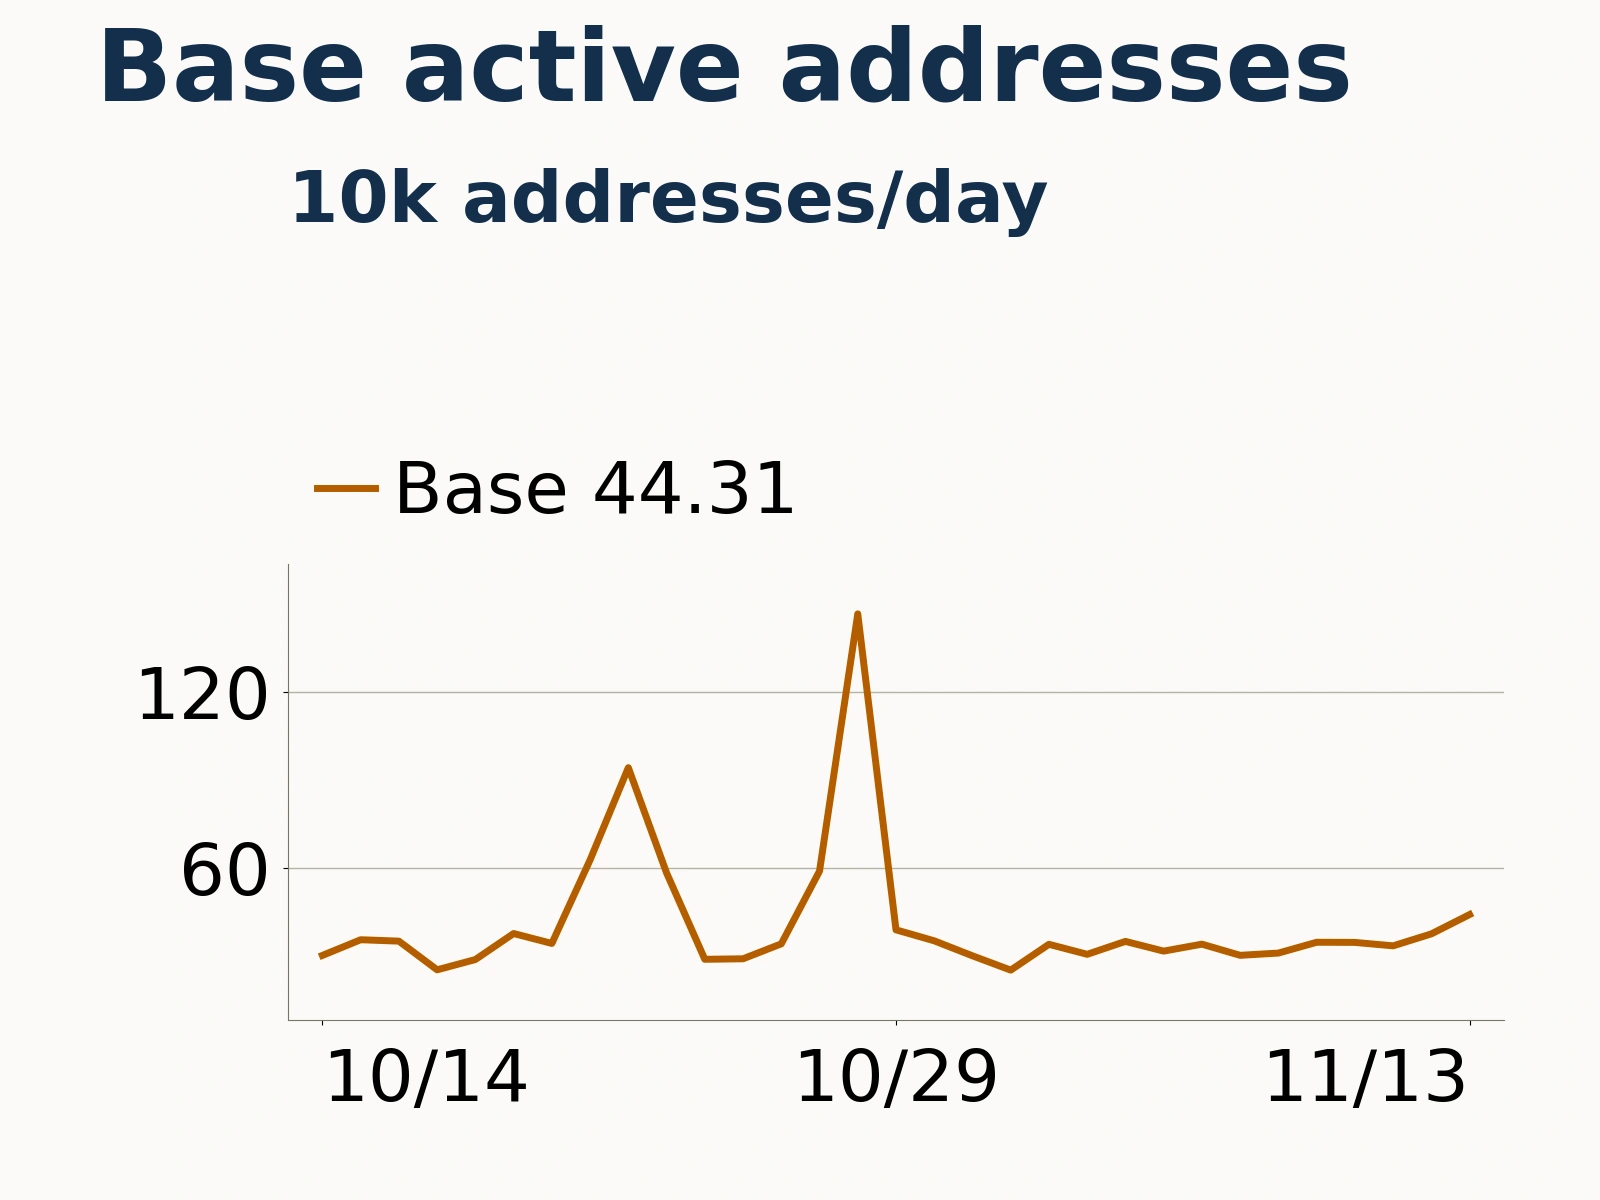
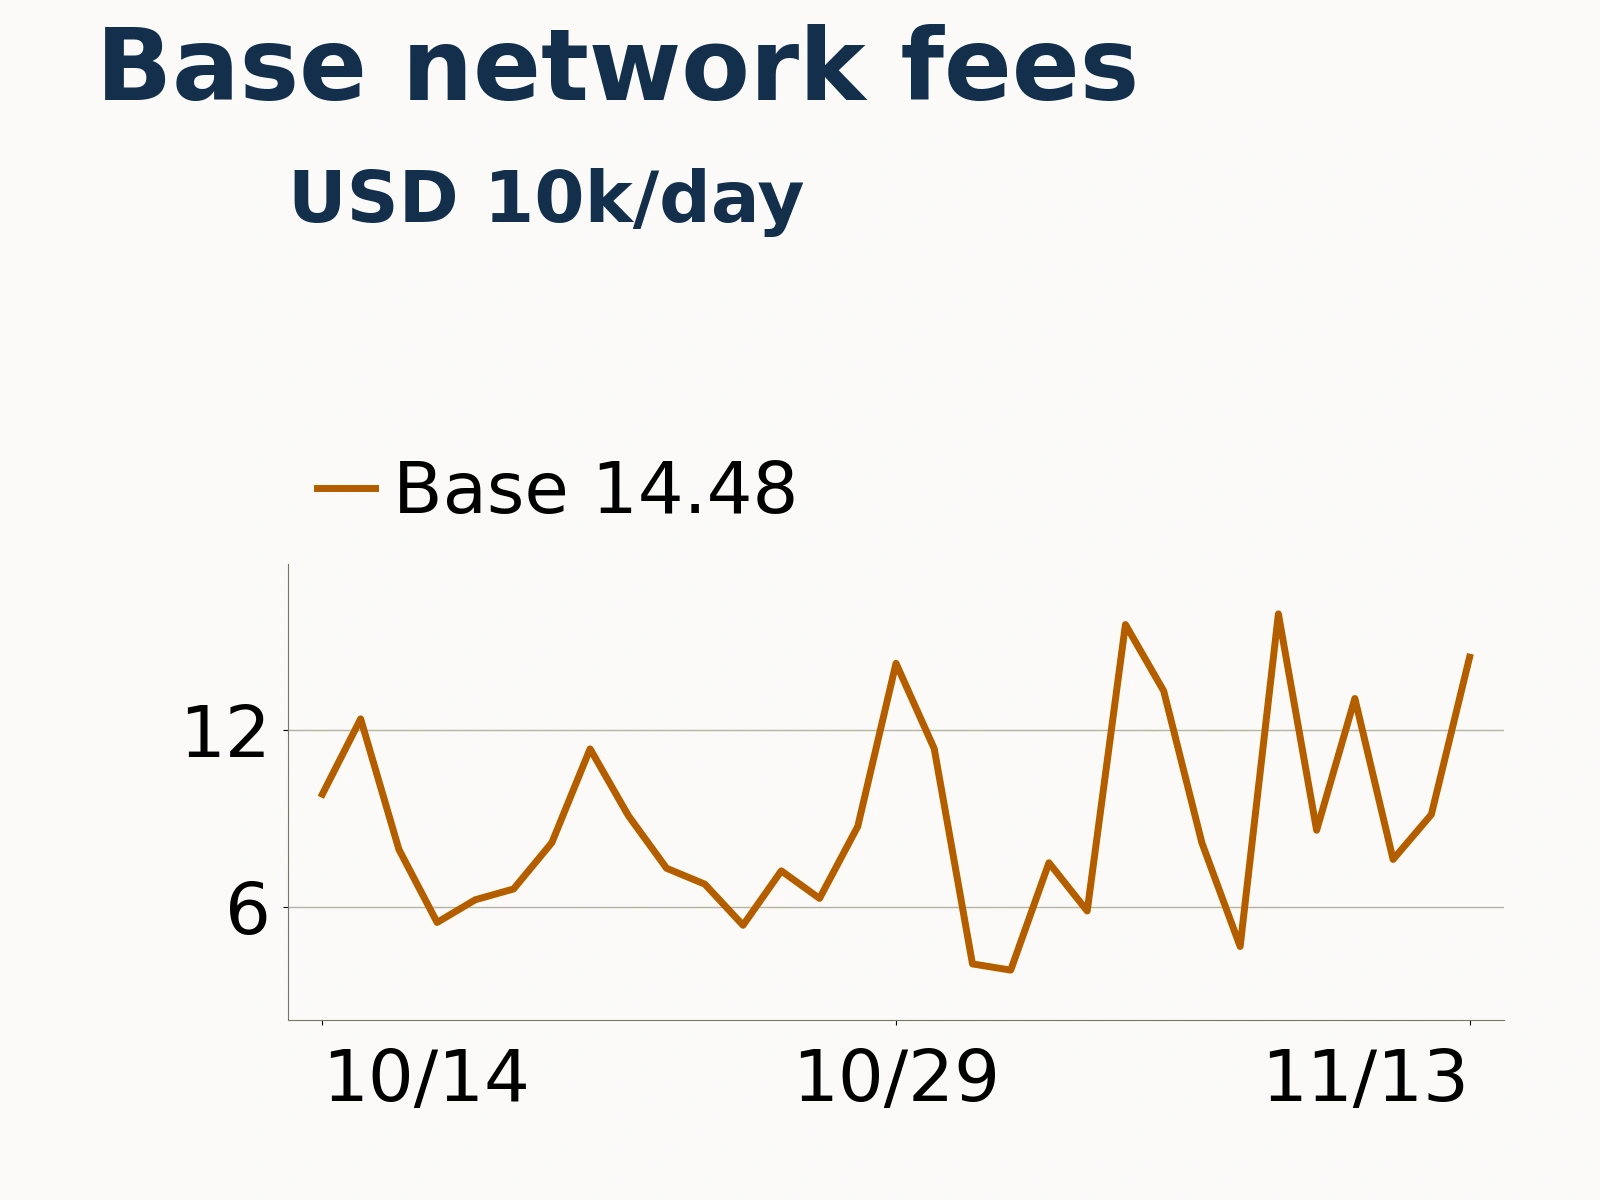
growthepie’s November 13 data also show that Base recorded approximately 9.65 million transactions and 443,100 active addresses that day, with users paying approximately $144,800 in network fees. Transaction count was up approximately 11.9% from seven days earlier, while network fees rose approximately 77%. Fees growing faster than transaction count indicates that the day’s growth also involved changes in transaction mix, resource usage and fee intensity. Active addresses measure participating accounts and cannot be converted directly into a count of unique users.
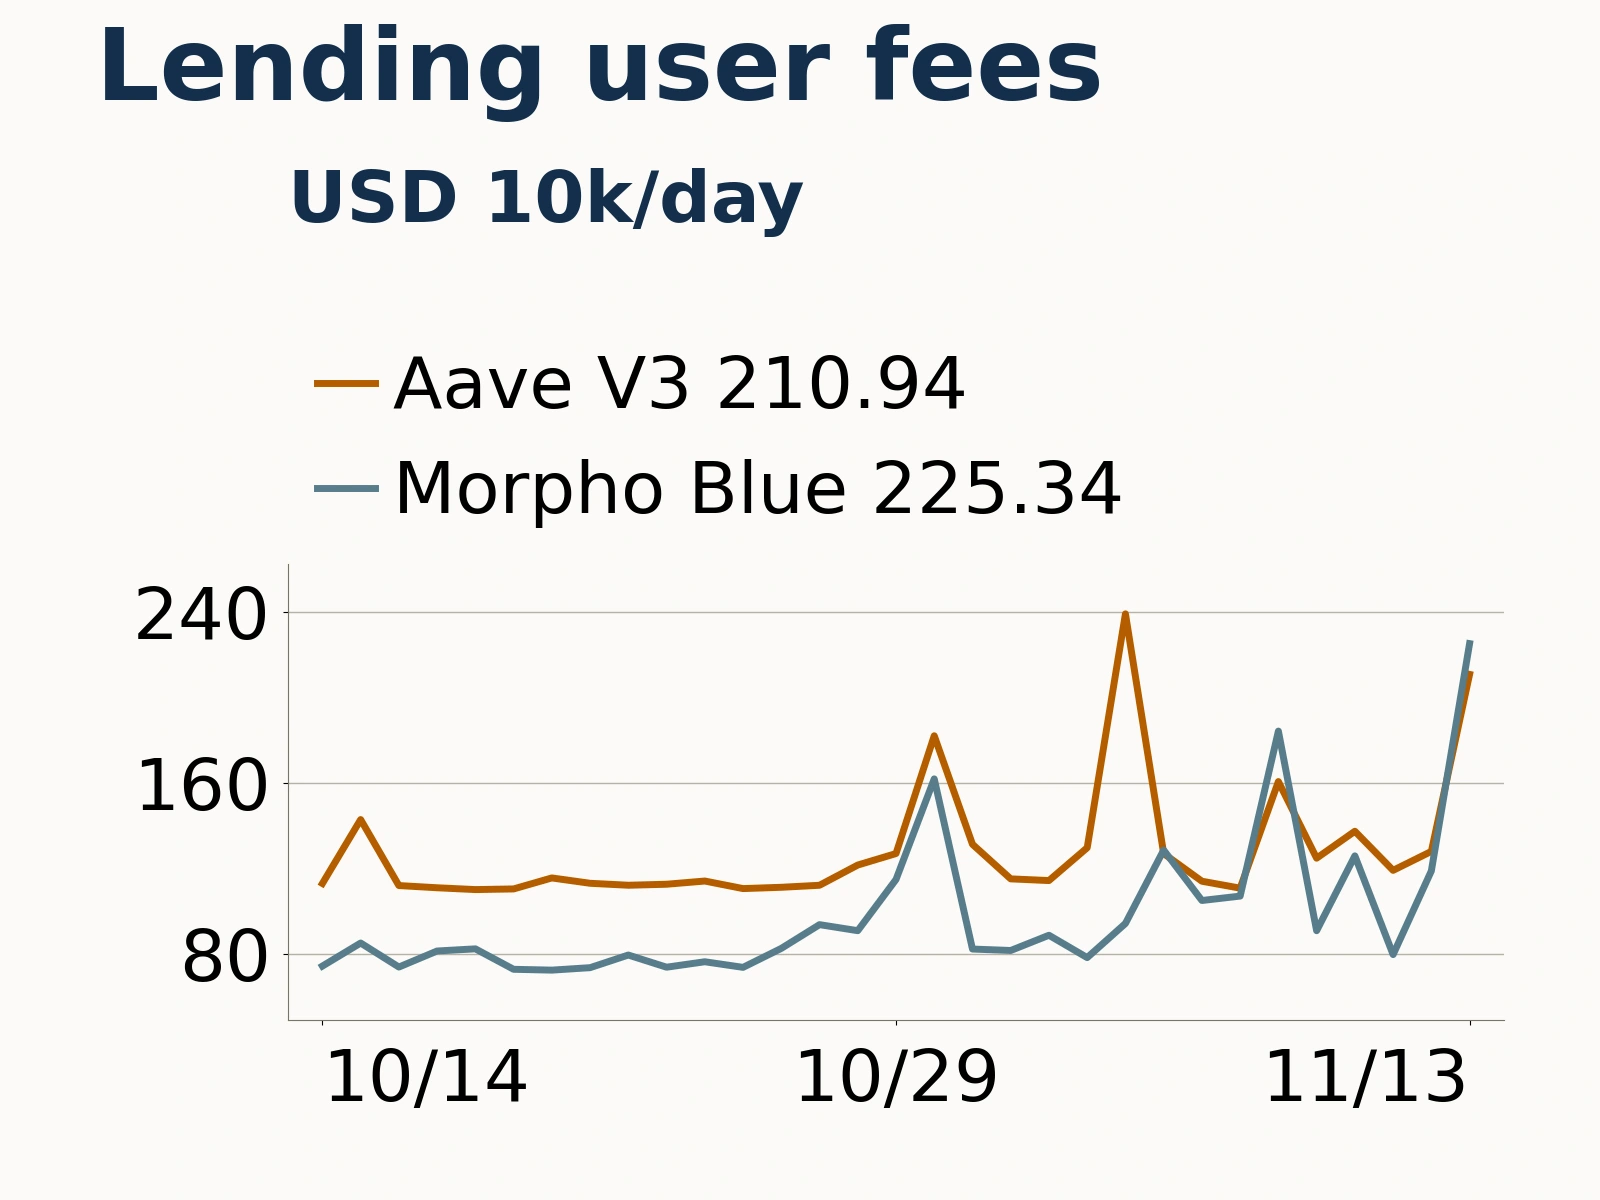
Lending applications continue to generate user payments. On November 13, user fees at Aave V3 and Morpho Blue were approximately $2.11 million and $2.25 million, respectively, primarily representing borrowing interest. Some of that interest is paid to depositors; only the portion actually retained by a protocol counts as protocol revenue. Assessing a lending business requires considering deposits, borrowing demand and risk pricing together.
RWA distributed assets total roughly $39.66 billion; stablecoin revenue comes mainly from reserve yields
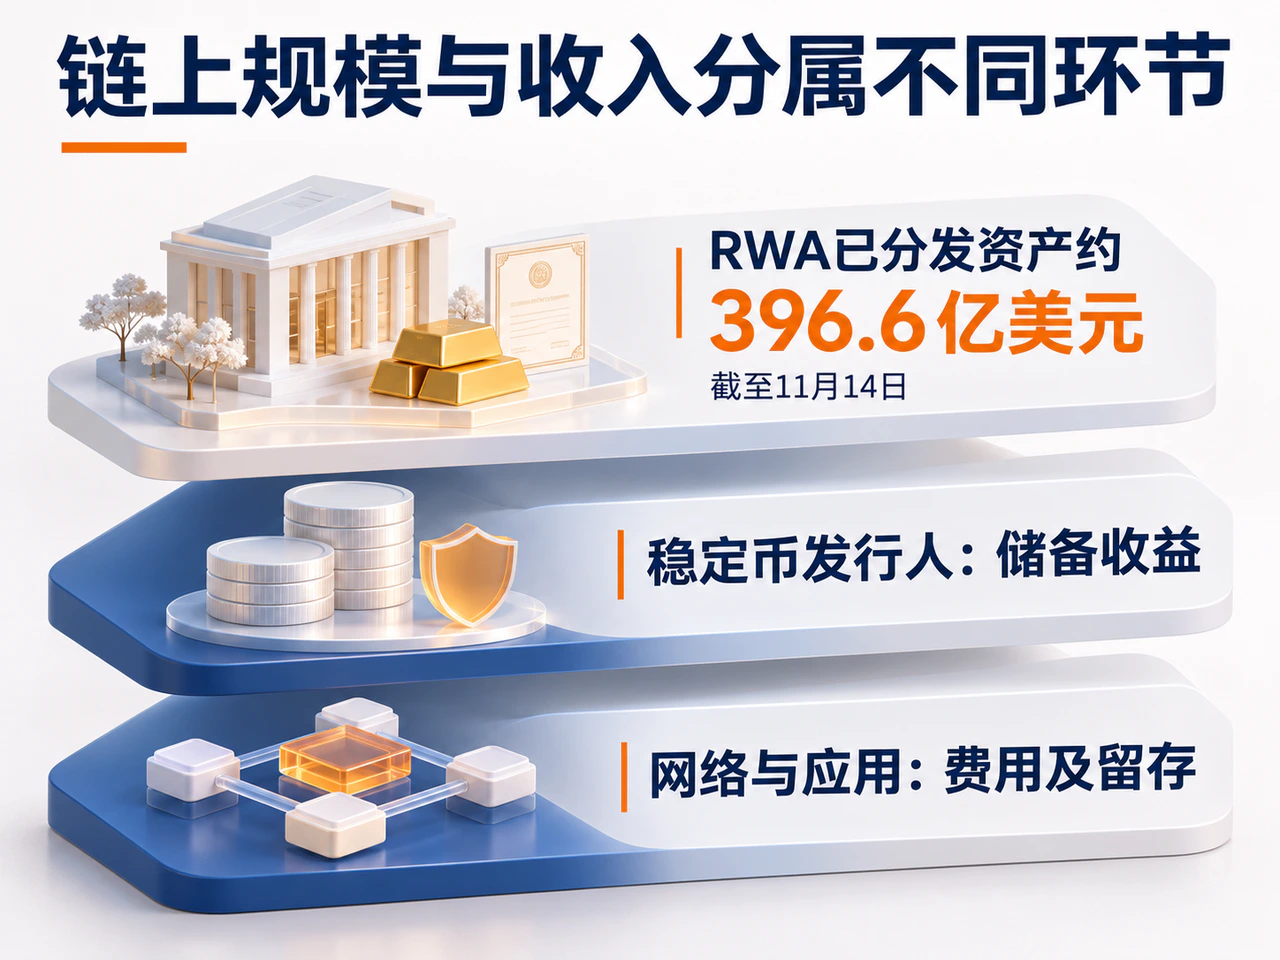
Real-world asset tokenization (RWA) provides a source of demand distinct from trading on token prices. RWA.xyz’s page as of November 14 showed approximately $39.66 billion in “distributed assets,” down 1.51% over the preceding 30 days, with substantial coverage on Ethereum, BNB Chain and Solana. Products such as Treasury funds, credit and gold bring off-chain assets and yields onto blockchains. Their value continues to depend on the underlying assets, redemption mechanisms and legal rights.
Stablecoins are also part of this value chain. Issuers earn interest on reserve assets, while payment networks and applications provide transfer and conversion services. Castle Labs’ 30-day statistics as of November 14 put revenue at Tether and Circle at approximately $513 million and $205 million, respectively, mainly from reserve yields. This is a different revenue measure from the on-chain transaction fees paid by users.
The on-chain economy continues to generate cash flow, but that cash flow is distributed among issuers, applications, liquidity providers and underlying networks. Transaction counts can indicate network activity; who receives the revenue depends on the fees charged and the amounts retained at each stage. Revenue does not automatically accrue to public-blockchain token holders in proportion to transaction count.
The book value of deposits in Kava’s legacy market was inflated roughly 243,000-fold
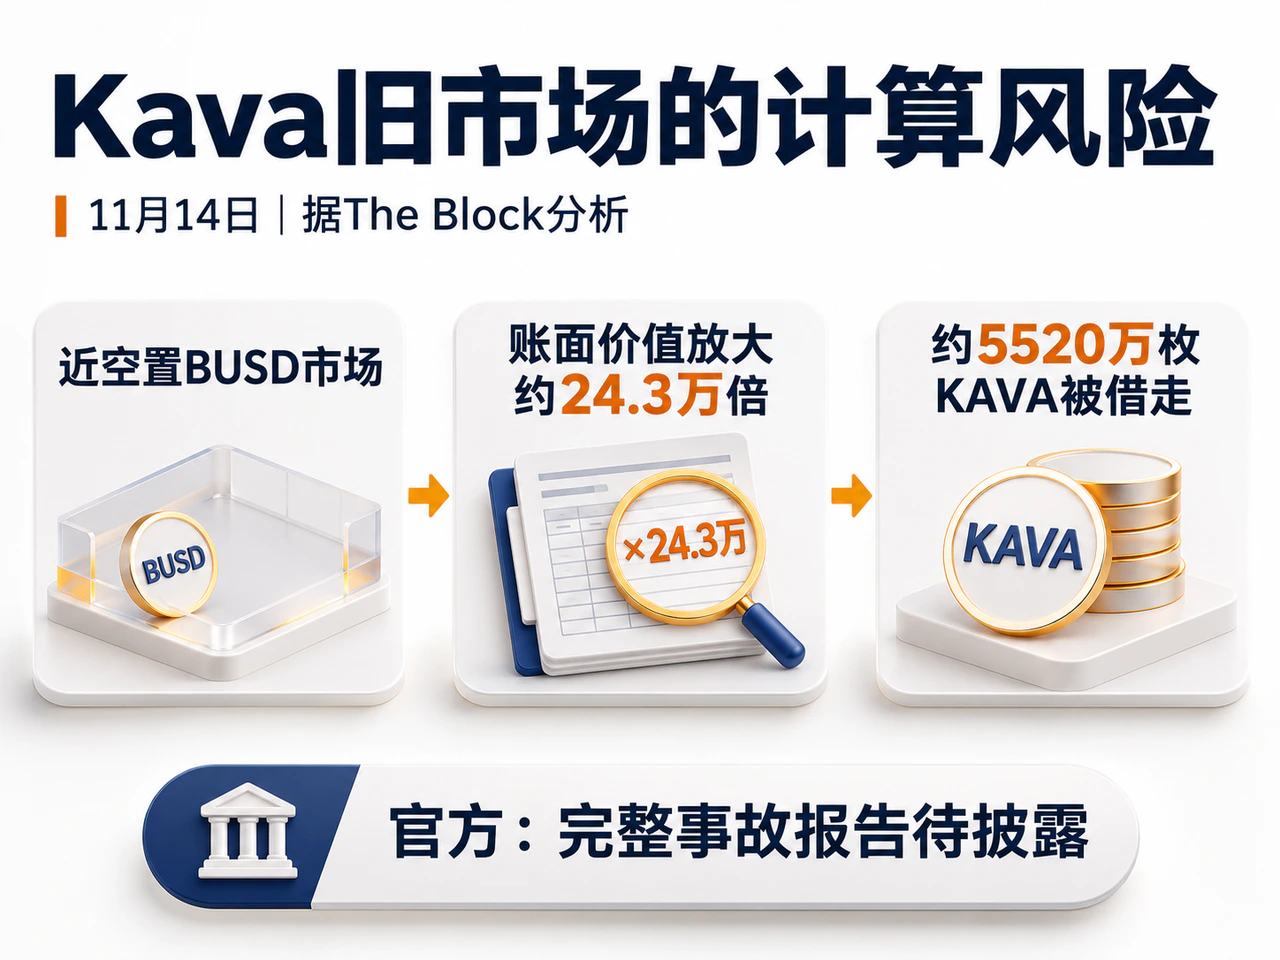
According to The Block’s analysis of on-chain data, the attacker borrowed approximately 55.2 million KAVA from Kava Lend, worth approximately $3.76 million at pre-attack prices. Of that amount, approximately 49.2 million KAVA was bridged through LayerZero to BNB Chain and swapped for BNB and USDT worth approximately $2.09 million. The $3.76 million figure represents the pre-attack valuation of the assets taken, whereas $2.09 million represents the disclosed swap proceeds. They are different measures for assessing the loss.
The problem lay in the nearly empty BUSD lending market. The report said the attacker reduced the market’s net supply to an extremely small positive number, abnormally shrinking the denominator used in interest calculations. The book value of deposits was then inflated approximately 243,000-fold, allowing repeated KAVA borrowing against the overstated collateral. The distorted accounting calculations inflated borrowing capacity and made other depositors’ assets available to borrow, independently of genuine borrowing demand or interest income.
Kava said the incident was confined to Kava Lend and did not involve unlimited KAVA issuance. Partner exchanges suspended deposits and withdrawals, and the team subsequently paused the Axelar bridge as a precaution. The transfer of exploited assets through LayerZero and the suspension of the Axelar bridge concern separate parts of the process. The official team has yet to release a full incident report; specific responsibility and the final loss await further disclosure.
The case shows that risk does not automatically disappear when users leave. After BUSD issuance stopped and liquidity approached zero, the protocol remained exposed to the legacy market as long as collateral, interest accrual and cross-market borrowing permissions remained active. The smaller a market becomes, the more necessary it is to test calculations and borrowing limits under extreme balance conditions and maintain appropriate oversight as markets wind down and asset pools shrink.
Major networks still hold substantial assets and support significant fee-paying activity, even as operating performance diverges and risks in legacy markets emerge. Assessing the quality of on-chain financial businesses requires examining whether actual user payments are sustainable, who receives the revenue and whether protocols can protect depositors’ assets as markets wind down and asset pools shrink. These conditions determine whether business scale can translate into lasting value.
Click through to the original article for further details.